Aljane's 1348ema strategy13/48ema crossover powerful setup EMAs (13, 48, 200) VWAP buy/sell labels Candles turn white on bullish , red on bearish Ideal for traders who want a simplified but powerful chart setup without clutter.Pine Script®指标由ajpangit提供已更新 5
Aljane's 13/48 strategyThis indicator combines key moving averages (EMA 13, EMA 48, and EMA 200) with VWAP and SuperTrend to help identify market trends, reversals, and potential entry/exit points. EMA crosses provide momentum signals, VWAP tracks volume-weighted price, and SuperTrend highlights trend direction with buy/sell labels.Pine Script®指标由ajpangit提供已更新 12
MACD Pre-Cross)macd indicator on the price. it shows the bars where the crossover occured Pine Script®指标由doomfakie提供76
Adaptive Convergence Divergence### Adaptive Convergence Divergence (ACD) By Gurjit Singh The Adaptive Convergence Divergence (ACD) reimagines the classic MACD by replacing fixed moving averages with adaptive moving averages. Instead of a static smoothing factor, it dynamically adjusts sensitivity based on price momentum, relative strength, volatility, fractal roughness, or volume pressure. This makes the oscillator more responsive in trending markets while filtering noise in choppy ranges. #### 📌 Key Features 1. Dual Adaptive Structure: The oscillator uses two adaptive moving averages to form its convergence-divergence line, with EMA/RMA as signal line: * Primary Adaptive (MA): Fast line, reacts quickly to changes. * Following Adaptive (FAMA): Slow line, with half-alpha smoothing for confirmation. 2. Adaptive MA Types * ACMO: Adaptive CMO (momentum) * ARSI: Adaptive RSI (relative strength) * FRMA: Fractal Roughness (volatility + fractal dimension) * VOLA: Volume adaptive (volume pressure) 3. PPO Option: Switch between classic MACD or Percentage Price Oscillator (PPO) style calculation. 4. Signal Smoothing: Choose between EMA or Wilder’s RMA. 5. Visuals: Colored oscillator, signal line, histogram with adaptive transparency. 6. Alerts: Bullish/Bearish crossovers built-in. #### 🔑 How to Use 1. Add to chart: Works on any timeframe and asset. 2. Choose MA Type: Experiment with ACMO, ARSI, FRMA, or VOLA depending on market regime. 3. Crossovers: * Bullish (🐂): Oscillator crosses above signal → potential long entry. * Bearish (🐻): Oscillator crosses below signal → potential short entry. 4. Histogram: expansion = strengthening trend; contraction = weakening trend. 5. Divergences: * Bullish (hidden strength): Price pushes lower, but ACD turns higher = potential upward reversal. * Bearish (hidden weakness): Price pushes higher, but ACD turns lower = potential downward reversal. 6. Customize: Adjust lengths, smoothing type, and PPO/MACD mode to match your style. 7. Set Alerts: * Enable Bullish or Bearish crossover alerts to catch momentum shifts in real time. #### 💡 Tips * PPO mode normalizes values across assets, useful for cross-asset analysis. * Wilder’s smoothing is gentler than EMA, reducing whipsaws in sideways conditions. * Adaptive smoothing helps reduce false divergence signals by filtering noise in choppy ranges. Pine Script®指标由singhxgurjit提供121
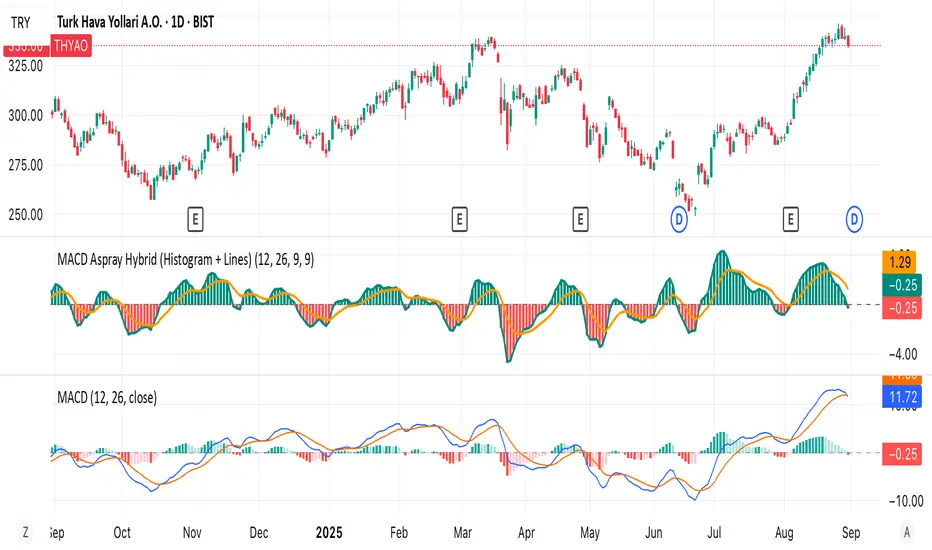
MACD Aspray Hybrid Bars (teal/red) = raw momentum (Aspray Histogram). Teal line = smooth curve of the histogram (Aspray Line). Orange line = 9-EMA of that line (new signal). Zero line for reference.Pine Script®指标由tolgasisman提供26
MIT MACD • Filled/Hollow Momentum HistogramThe MIT MACD • Filled/Hollow Momentum Histogram is an enhanced version of the classic MACD. - Dual-style histogram (filled for acceleration, hollow for deceleration). - Customizable colors for bars, MACD/Signal lines, and background. - Background highlight when the slow line crosses the zero-line. - Fully adjustable parameters, keeping TradingView defaults. 此脚本是经典 MACD 的进阶版,支持实心/空心动能柱体,零轴背景高亮,参数与配色可自由调整,更直观捕捉趋势与动能变化。 Pine Script®指标由HONGJIT提供14
REMS Snap Shot OverlayThe REMS Snap Shot indicator is a multi-factor, confluence-based system that combines momentum (RSI, Stochastic RSI), trend (EMA, MACD), and optional filters (volume, MACD histogram, session time) to identify high-probability trade setups. Signals are only triggered when all enabled conditions align, giving the trader a filtered, visually clear entry signal. This indicator uses an optional 'look-back' feature where in it will signal an entry based on the recency of specified cross events. To use the indicator, select which technical indicators you wish to filter, the session you wish to apply (default is 9:30am - 4pm EST, based on your chart time settings), and if which cross events you wish to trigger a reset on the cooldown. The default settings filter the 4 major technical indicators (RSI, EMAs, MACD, Stochastic RSI) but optional filters exist to further fine tune Stochastic Range, MACD momentum and strength, and volume, with optional visual cues for MACD position, Stochastic RSI position, and volume. EMAs can be drawn on the chart from this indicator with optional shaded background. This indicator is an alternative to REMS First Strike, which uses a recency filter instead of a cool down.Pine Script®指标由KodiakMarket提供已更新 23
REMS First Strike OverlayThe REMS First Strike indicator is a multi-factor, confluence-based system that combines momentum (RSI, Stochastic RSI), trend (EMA, MACD), and optional filters (volume, MACD histogram, session time) to identify high-probability trade setups. Signals are only triggered when all enabled conditions align, giving the trader a filtered, visually clear entry signal. This indicator uses an optional 'cool down' feature where in it will signal an entry only after any of the specified cross events occur. To use the indicator, select which technical indicators you wish to filter, the session you wish to apply (default is 9:30am - 4pm EST, based on your chart time settings), and if which cross events you wish to trigger a reset on the cooldown. The default settings filter the 4 major technical indicators (RSI, EMAs, MACD, Stochastic RSI) but optional filters exist to further fine tune Stochastic Range, MACD momentum and strength, and volume, with optional visual cues for MACD position, Stochastic RSI position, and volume. EMAs can be drawn on the chart from this indicator with optional shaded background. This indicator is an alternative to REMS Snap Shot, which uses a recency filter instead of a cool down.Pine Script®指标由KodiakMarket提供已更新 24
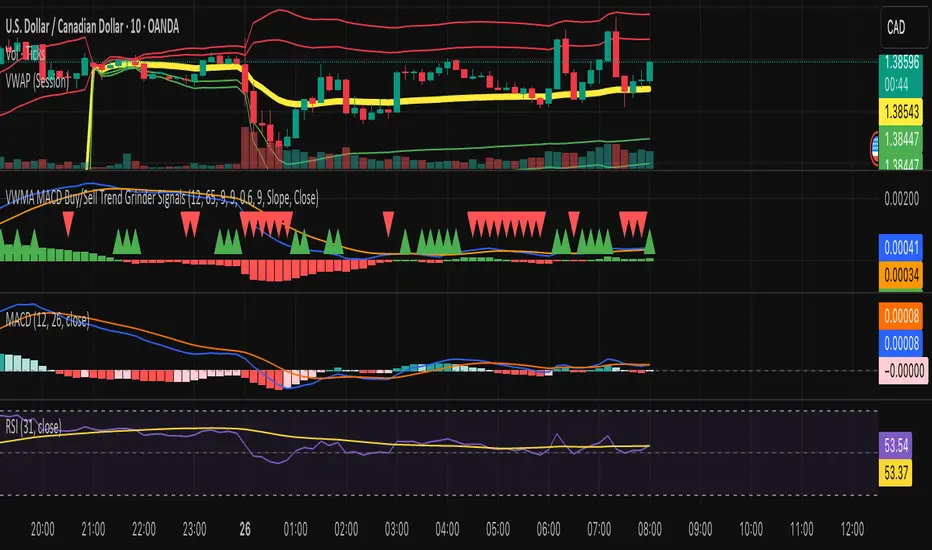
VWMA MACD Trend Grinder Buy/Sell SignalsDescription: This indicator combines a VWMA-based MACD with volume and trend filters to reduce false buy and sell signals. It is designed to give more reliable entry and exit points in trending markets while avoiding low-volume noise. Features: 1. VWMA MACD: - MACD is calculated using Volume-Weighted Moving Averages (VWMA) instead of standard EMAs. - Histogram shows the difference between MACD and its signal line. 2. Volume Filter: - Signals are only triggered when current volume exceeds a multiple of its moving average. - Reduces false signals in low-volume periods. 3. Trend Filter: - Only triggers buy signals when price is above a long-term VWMA (uptrend). - Only triggers sell signals when price is below the long-term VWMA (downtrend). - Helps avoid counter-trend trades. 4. Plots: - MACD (blue), Signal (orange), Histogram (green/red) - Trend VWMA (purple) - Buy and Sell arrows in the indicator pane (green/red) 5. Alerts: - Configurable alerts for buy and sell signals filtered by volume and trend. Inputs: - Fast Length: VWMA period for the fast MACD line (default 12) - Slow Length: VWMA period for the slow MACD line (default 26) - Signal Length: EMA period for the MACD signal line (default 9) - Volume MA Length: Length for volume moving average filter (default 20) - Volume Threshold Multiplier: Multiplier for volume filter (default 1.2) - Trend VWMA Length: Period for long-term trend VWMA (default 50) - Price Source: Close, HL2, HLC3, OHLC4 Usage: - Use as a confirmation tool along with other analysis techniques. - Buy when the green triangle appears (MACD crossover, above trend VWMA, sufficient volume). - Sell when the red triangle appears (MACD crossunder, below trend VWMA, sufficient volume). - Trend VWMA helps visually confirm the market trend.Pine Script®指标由kmarin137提供已更新 25
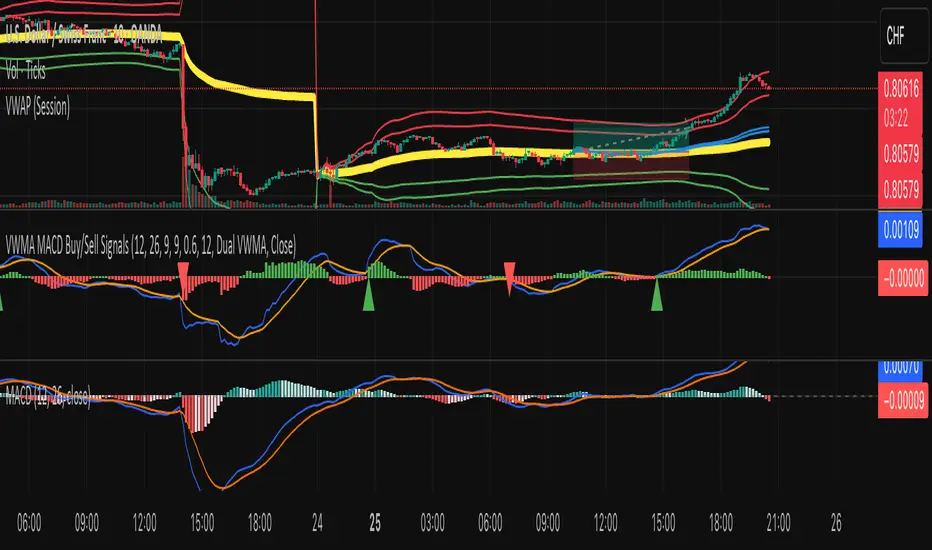
VWMA MACD Amanita Buy/Sell Signals VWMA MACD Amanita Buy/Sell Signals – Volume-Weighted Momentum Indicator A twist on the classic MACD: this indicator uses Volume Weighted Moving Averages (VWMA) instead of EMAs, giving more weight to price moves backed by higher volume. Features: VWMA-based MACD line & signal line Histogram highlights bullish/bearish momentum Color-coded for easy visualization Quick Guide: MACD above Signal → bullish MACD below Signal → bearish Rising histogram → strengthening trend Falling histogram → weakening trend Perfect for traders who want momentum confirmed by volume.Pine Script®指标由kmarin137提供已更新 38
VWMA MACD AmanitaVWMA MACD (Volume-Weighted MACD) This indicator modifies the standard MACD by replacing EMAs with VWMAs (Volume-Weighted Moving Averages). - Fast VWMA (default 12 bars) - Slow VWMA (default 26 bars) - MACD Line = Fast VWMA - Slow VWMA - Signal Line = EMA of MACD (default 9 bars) - Histogram = MACD - Signal Compared to the standard MACD, this version emphasizes price moves that are backed by higher trading volume, helping to filter out weak signals. The script also lets you choose the price source (Close, HL2, HLC3, OHLC4).Pine Script®指标由kmarin137提供已更新 1114
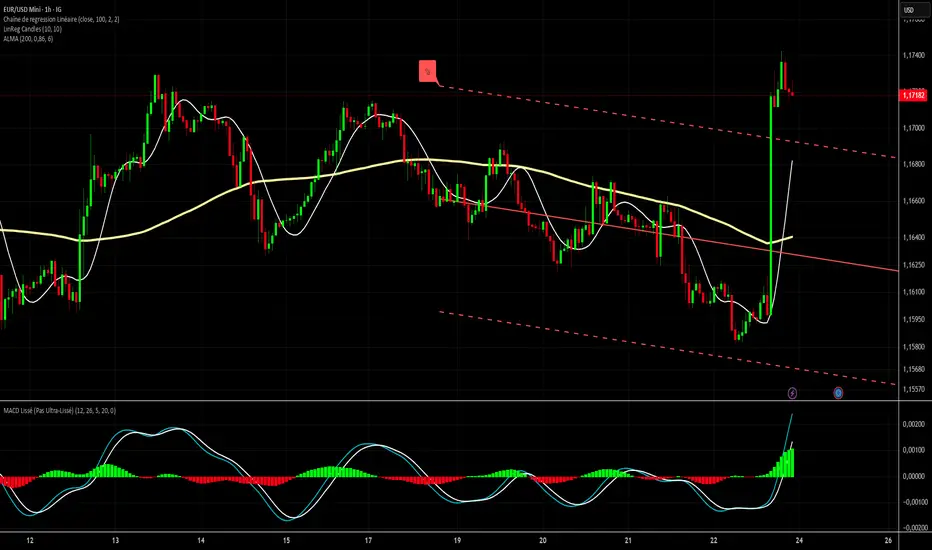
MACD Lissé Smoothed MACD – Custom Indicator This indicator is an enhanced version of the classic MACD, designed to balance responsiveness and noise reduction. It uses a short HMA (Hull Moving Average) smoothing to track price movements faster while keeping the signal smooth. Key Features: HMA-Smoothed MACD: Tracks trends with less lag than a standard MACD. Signal Line: A simple EMA applied to the smoothed MACD to identify crossovers and generate buy/sell signals. Filtered Histogram: Shows the difference between the smoothed MACD and its signal line, with an optional threshold to focus on meaningful movements and reduce visual noise. Customizable Parameters: Fast EMA Length and Slow EMA Length to adjust the classic MACD HMA MACD Smoothing for faster or smoother MACD response Signal Smoothing to fine-tune the signal line Histogram Threshold to filter small movements and reduce noise This indicator is ideal for traders who want a MACD that is responsive but not ultra-smoothed, perfect for spotting trend changes quickly without being overwhelmed by minor price fluctuations. Colors and Display: Smoothed MACD: Blue Signal Line: Orange Histogram: Green (positive) / Red (negative)Pine Script®指标由maxime15提供11
MACD Bullish Divergence + Multi-TF RSI Buy SignalsNew script to overlap MACD Bullish Divergence and RSI signals to give confluence. Pine Script®指标由bpnelsen提供1198
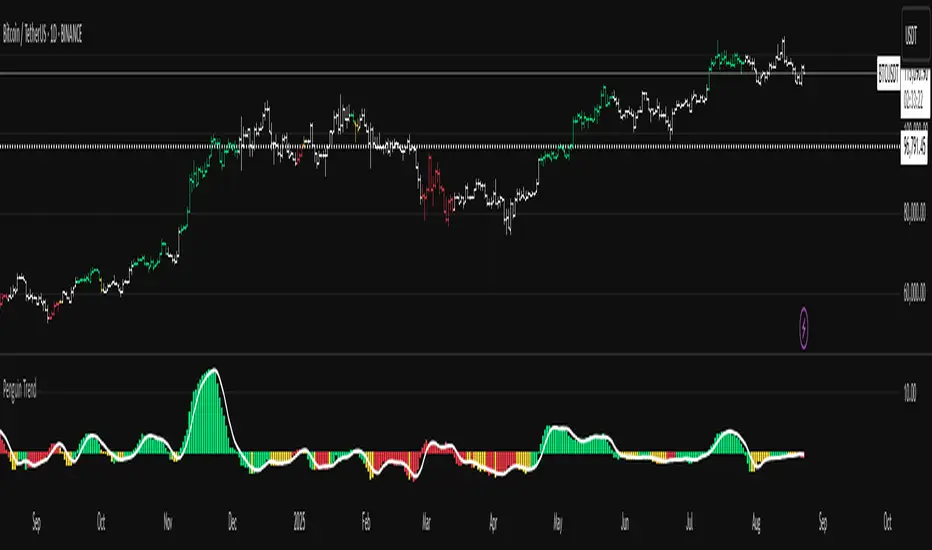
Penguin Trend with RSI on DiffVisualizes volatility regime via the percent spread between the upper Bollinger Band and the upper Keltner Channel, with bar colors from a lightweight trend engine and an RSI computed on the Diff signal. Supports SMA/EMA/WMA/RMA/HMA/VWMA/VWAP and an optional calculation timeframe. Defaults preserve the original look and behavior. Penguin Trend with RSI on Diff shows expansion vs. compression in price action by comparing two classic volatility envelopes. It computes: Diff% = (UpperBB − UpperKC) / UpperKC × 100 • Diff > 0: Bollinger Bands are wider than Keltner Channels → expansion / momentum regime • Diff < 0: BB narrower than KC → compression / squeeze regime A white “Average Diff” line smooths Diff% (default: SMA(5)) to highlight regime shifts. Bars are colored only when Diff > 0 to focus on expansion phases. A lightweight trend engine defines four states from a fast/slow MA bias and a short “thrust” MA on ohlc4: • Green: Bullish bias and thrust > fast MA (healthy upside thrust) • Red: Bearish bias and thrust < fast MA (healthy downside thrust) • Yellow: Bullish bias but thrust ≤ fast MA (pullback/weakness) • Blue: Bearish bias but thrust ≥ fast MA (bear rally/short squeeze) RSI on Diff: The indicator adds an RSI applied to Diff% to gauge momentum of the expansion/compression signal itself. Choose between Built-in RSI or a manual RMA-based computation, and optionally smooth it. Default OB/OS lines are 70/30. How it works: • Bollinger Bands (BB): Basis = selected MA of src (default SMA(20)); Width = StdDev × Mult (default 2.0) • Keltner Channels (KC): Basis = selected MA of src (default SMA(20)); Width = ATR(kcATR) × Mult (defaults 20 and 2.0) • Diff%: Safe division guards against division-by-zero • MA engine: Select SMA / EMA / WMA / RMA / HMA / VWMA / VWAP for BB/KC bases, Average Diff, and trend components (VWAP is session-anchored) • Calculation timeframe: Compute internals on a chosen TF via request.security() while viewing any chart TF Inputs (key): • Calculation timeframe: Empty = chart TF; set e.g., 60/240 to compute on that TF • BB: Length, StdDev Mult, MA Type • KC: Basis Length, ATR Length, Multiplier, MA Type • Average Diff: Length and MA Type • RSI on Diff: RSI Length, Method (Built-in or Manual RMA), Smoothing Length, OB/OS levels, show/hide • Trend Engine: Fast/Slow lengths & MA type, Signal (kept for completeness), Thrust MA length & type • Display/Visibility: Paint bars only when Diff > 0; show zero line; “true Blue” color toggle; show/hide Diff columns and Average Diff How to use: 1. Regime changes: Watch Diff% or Average Diff crossing 0. Above zero favors momentum/continuation setups; below zero suggests compression and potential breakout conditions. 2. State confirmation: During expansion (Diff > 0), prioritize Green/Red for aligned thrust; treat Yellow/Blue as cautionary/contrarian. 3. RSI on Diff: Use OB/OS and crossovers for timing entries/exits or for confirming/negating expansion strength. Alerts: • Diff crosses above/below 0 • Average Diff crosses above/below 0 • RSI(Diff) crosses above OB / below OS • State changes: GREEN / RED / YELLOW / BLUE Notes & limitations: • VWAP is session-anchored and best on intraday data. If not applicable on the selected calculation TF, the script automatically falls back to EMA. • Defaults (SMA(20) for BB/KC, multipliers 2.0, SMA(5) Average Diff, original trend coloring and bar painting) preserve the original appearance. • RSI on Diff is plotted in the same pane for a compact workflow; you can hide it or split into a separate indicator if desired. Release notes: v6.0 — Upgraded to Pine v6. Added multi-MA options (SMA/EMA/WMA/RMA/HMA/VWMA/VWAP), calculation timeframe, RSI on Diff (Built-in or Manual RMA) with smoothing, safe division guard, optional zero line, and optional true Blue color. Defaults retain the original behavior. License / disclaimer: © waranyu.trkm — MIT License. Educational use only; not financial advice. Pine Script®指标由waranyutrkm提供39
Penguin TrendMeasures the volatility regime by comparing the upper Bollinger Band to the upper Keltner Channel and colors bars with a lightweight trend state. Supports SMA/EMA/WMA/RMA/HMA/VWMA/VWAP and a selectable calculation timeframe. Default settings preserve the original look and behavior. Penguin Trend visualizes expansion vs. compression in price action by comparing two classic volatility envelopes. It computes: Diff% = (UpperBB − UpperKC) / UpperKC × 100 * Diff > 0: Bollinger Bands are wider than Keltner Channels -> expansion / momentum regime. * Diff < 0: BB narrower than KC -> compression / squeeze regime. A white “Average Difference” line smooths Diff% (default: SMA(5)) to help spot regime shifts. Trend coloring (kept from original): Bars are colored only when Diff > 0 to emphasize expansion phases. A lightweight trend engine defines four states using a fast/slow MA bias and a short “thrust” MA applied to ohlc4: * Green: Bullish bias and thrust > fast MA (healthy upside thrust). * Red: Bearish bias and thrust < fast MA (healthy downside thrust). * Yellow: Bullish bias but thrust ≤ fast MA (pullback/weakness). * Blue: Bearish bias but thrust ≥ fast MA (bear rally/short squeeze). Note: By default, Blue renders as Yellow to preserve the original visual style. Enable “Use true BLUE color” if you prefer Aqua for Blue. How it works (under the hood): * Bollinger Bands (BB): Basis = selected MA of src (default SMA(20)). Width = StdDev × Mult (default 2.0). * Keltner Channels (KC): Basis = selected MA of src (default SMA(20)). Width = ATR(kcATR) × Mult (defaults 20 and 2.0). * Diff%: Safe division guards against division-by-zero. * MA engine: You can choose SMA / EMA / WMA / RMA / HMA / VWMA / VWAP for BB/KC bases, Diff smoothing, and the trend components (VWAP is session-anchored). * Calculation timeframe: Set “Calculation timeframe” to compute all internals on a chosen TF via request.security() while viewing any chart TF. Inputs (key ones): * Calculation timeframe: Empty = use chart TF; if set (e.g., 60), all internals compute on that TF. * BB: Length, StdDev Mult, MA Type. * KC: Basis Length, ATR Length, Multiplier, MA Type. * Smoothing: Average Length & MA Type for the “Average Difference” line. * Trend Engine: Fast/Slow lengths & MA type; Signal (kept for completeness); Thrust length & MA type (defaults replicate original behavior). * Display: Paint bars only when Diff > 0; optional Zero line; optional true Blue color. How to use: 1. Regime changes: Watch Diff% or Average Diff crossing 0. Above zero favors momentum/continuation setups; below zero suggests compression and potential breakout conditions. 2. State confirmation: Use bar colors to qualify expansion: Green/Red indicate expansion aligned with trend thrust; Yellow/Blue flag weaker/contrarian thrust during expansion. 3. Multi-timeframe analysis: Run calculations on a higher TF (e.g., H1/H4) while trading a lower TF chart to smooth noise. Alerts: * Diff crosses above/below 0. * Average Diff crosses above/below 0. * State changes: GREEN / RED / YELLOW / BLUE. Notes & limitations: * VWAP is session-anchored and best on intraday data. If not applicable on the selected calculation TF, the script automatically falls back to EMA. * Default parameters (SMA(20) for BB/KC, multipliers 2.0, SMA(5) smoothing, trend logic and bar painting) preserve the original appearance. Release notes: v6.0 — Rewritten in Pine v6 with structured inputs and guards. Multi-MA support (SMA/EMA/WMA/RMA/HMA/VWMA/VWAP). Calculation timeframe via request.security() for multi-TF workflows. Safe division; optional zero line; optional true Blue color. Original visuals and behavior preserved by default. License / disclaimer: © waranyu.trkm — MIT License. Educational use only; not financial advice. Pine Script®指标由waranyutrkm提供29
MACD Quadrant Matrix – 10 US MajorsThis script provides a quadrant matrix visualization of the MACD indicator across 10 major U.S. stocks (AAPL, MSFT, NVDA, AMZN, GOOGL, META, TSLA, BRK.B, UNH, LLY). It is designed as a visual screening tool to quickly analyze the relative MACD conditions of large-cap U.S. equities. # Quadrant Logic Q1 (Green): MACD > 0 and MACD > Signal Q2 (Orange): MACD > 0 and MACD < Signal Q3 (Blue): MACD < 0 and MACD > Signal Q4 (Red): MACD < 0 and MACD < Signal # Features Adjustable timeframe (default: Daily) Quadrant background visualization Optional jitter to reduce overlap of bubbles Tooltip display with MACD, Signal, and Delta values Counts of how many symbols fall into each quadrant # Limitations Symbol list is fixed to 10 large-cap U.S. stocks (modifiable in code). This is a visualization tool only. It does not generate buy/sell signals. Results and quadrant positioning will vary depending on timeframe selection. # Disclaimer This script is for educational and analytical purposes only. It is not financial advice, and should not be relied upon for trading or investment decisions. Trading and investing carry risk, and users should perform their own due diligence. Pine Script®指标由Nungz提供8
SMA+MACD+RSI+Stoch Entry📌 Tools Used: • SMA 21, SMA 50, SMA 200 • MACD (12, 26, 9) • Pivot Point Standard • RSI (length 75) • Stochastic (14, 3, 3) Trading Timeframe: • Usable on all timeframes Chart Preparation: • Analyze the overall market trend and the instrument being traded • Set an appropriate timeframe according to the market • Apply SMA 21, SMA 50, SMA 200 • Apply MACD and Pivot Point Standard • Ensure a proper market trend by checking the position of SMA 21, SMA 50, and SMA 200 relative to each other If there are too many crossings between SMA 21, SMA 50, and SMA 200, do not enter any trades until the market trend stabilizes Conditions for Entering a Long Trade (Bullish Trigger): • Candle closes above the pivot line • Confirm an uptrend by checking that SMA 21 is above SMA 50, and SMA 50 is above SMA 200 • RSI is above the midpoint • Presence of a suitable corrective step with normal slope, considering the strength of the previous step • MACD histogram indicates bullish momentum • Stochastic shows a bullish crossover from below Conditions for Entering a Short Trade (Bearish Trigger): • Candle closes below the pivot line • Confirm a downtrend by checking that SMA 21 is below SMA 50, and SMA 50 is below SMA 200 • RSI is below the midpoint • Presence of a suitable corrective step with normal slope, considering the strength of the previous step • MACD histogram indicates bearish momentum • Stochastic shows a bearish crossover from above Pine Script®指标由Daragolbon提供已更新 2271
Triple EMA with Alert | 21, 50, 200 EMA Strategy + Crossover🚀 Boost your trading edge with the Triple EMA with Alert — a professional-grade indicator designed for traders who want precise, real-time trend confirmation across short, medium, and long-term market movements. 🔹 What Makes This Indicator Powerful? Three Adjustable EMAs — Default: 21, 50, 200 periods (fully customizable 1–200). Toggle Visibility — Show only the EMAs you need for your strategy. Real-Time Alerts — Get notified instantly when: EMA 1 crosses EMA 2 → short-term trend change. EMA 2 crosses EMA 3 → medium-term trend alignment. Works on All Markets & Timeframes — Forex, crypto, stocks, indices, and commodities. 🔹 Why Traders Love It 📊 Multi-Timeframe Trend Confirmation — Filter out noise and trade with market momentum. 🎯 Accurate Crossover Signals — Identify bullish and bearish momentum shifts. 🔔 Hands-Free Monitoring — Alerts keep you informed even when you’re away from the chart. 💡 Versatile for Any Strategy — Perfect for scalping, swing trading, or long-term investing. 🔹 How to Use It Bullish Signal — EMA 1 crossing above EMA 2 or EMA 2 crossing above EMA 3. Bearish Signal — EMA 1 crossing below EMA 2 or EMA 2 crossing below EMA 3. Combine with support/resistance zones, RSI, or volume for higher probability trades. 📌 Pro Tip: Use EMA 21 & EMA 50 for momentum confirmation. Use EMA 200 to spot the overall market direction. If you’re serious about trend trading with precision, the Triple EMA with Alert will keep you one step ahead of market moves — no more missed entries or exits.Pine Script®指标由noufalbinjalal提供28
THE TRINTY - Multi-Timeframe MACD Alignment (Single Alert)Analyzes up to 3 timeframes at the same time waiting for MACD alignment plus determines when it's very bullish, very bearish, or just mixed. Ideal for traders who only want to trade in high probability markets to increase your chances at success. Also, there's only 1 single alert system that you can set for each pair making things much easier instead of setting separate bullish and bearish alerts like most other indicators. Pine Script®指标由R0NiNX提供38
MACD (Panel) with Histogram-Confirmed Signals - Middle LineMacd indicator with buy and sell signals to help spot the macd signal crossover and histogram Pine Script®指标由Az_Tinks提供已更新 40
The Golden TriggerThe Golden Trigger - XAUUSD Unlock your trading potential with The Golden Trigger, a powerful technical analysis strategy designed for XAUUSD. This custom indicator combines the synergy of moving averages and the MACD to provide clear buy and sell signals, optimizing your trading decisions. Key Features: SMA Crossovers: Utilizes the 2-period and 7-period Simple Moving Averages (SMAs) to spot short-term price momentum shifts, triggering buy or sell signals. MACD Confirmation: The strategy only acts when the MACD aligns with the price action, ensuring you’re trading with the market's momentum. Long-Term Trend Filter: The 200-period SMA ensures that your trades align with the overall market trend, helping you avoid counter-trend moves. Real-Time Alerts: Get notified when it's time to act with the built-in alert conditions for both Buy and Sell signals. Customizable and User-Friendly: Tailor the strategy to your preferences and trade with confidence. This indicator is perfect for traders looking to catch short-term trends in gold (XAUUSD), with clear visual buy and sell markers that appear directly on the chart. Why You Need This Indicator: Stay ahead of the market with real-time signals Filter trades to match the prevailing market trend Enhance your trading strategy with a clear, simple-to-follow system Unlock the power of The Golden Trigger today and make smarter, more confident trades! Pine Script®指标由yogesh8rn提供26
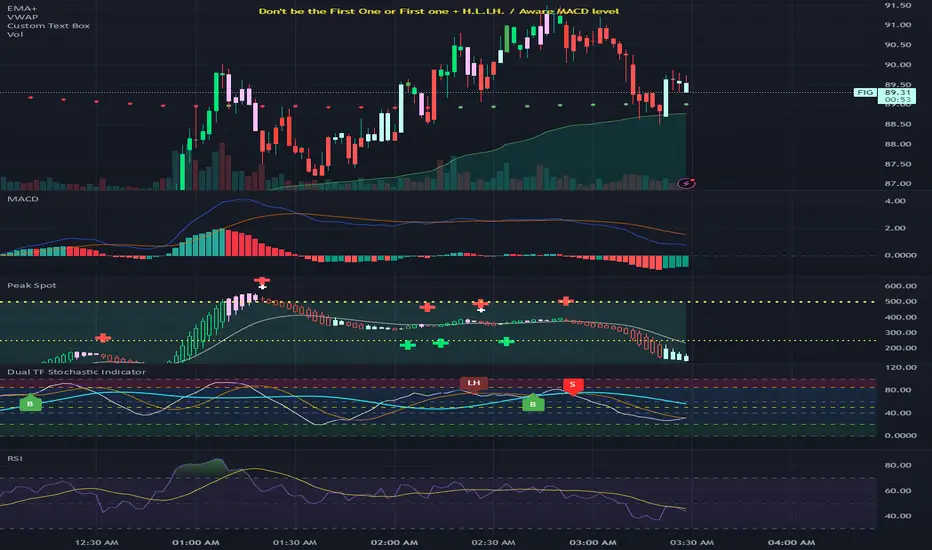
Spot the Peak & BottomCombines Heikin-Ashi candlesticks with MACD histogram analysis to identify potential market reversals and trend continuations. The script provides advanced pattern recognition with visual signals and alerts. Core Components 1. Technical Foundation Heikin-Ashi Candlesticks: Modified candlestick calculation that smooths price action MACD Histogram: Custom STMC (Smooth Trend Momentum Change) oscillator Multiple Price Sources: Support for open, high, low, close, and various averages (hl2, hlc3, ohlc4, hlcc4) 2. Pattern Detection System Bullish Patterns: HA D ↑ → HA ↑: Divergence resolution (Heikin-Ashi bearish but histogram strengthening, then turning bullish) Normal Rise: HA rising + histogram strengthening/maintaining Bottom Reversal: HA falling but histogram strengthening Bearish Patterns: HA U ↓ → HA ↓: Divergence resolution (Heikin-Ashi bullish but histogram weakening, then turning bearish) Top Reversal: HA rising but histogram weakening Strong Downtrend: HA falling + histogram weakening Divergence Patterns: HA D ↓: Heikin-Ashi bullish but momentum weakening HA D ↑: Heikin-Ashi bearish but momentum strengthening 3. Signal Classification System Bullish Signals (▲): Bull Highlight: Higher HA close than previous signal (strongest) Bull Normal: Normal signal within neutral range (-100 to 100) Bull Gray: Normal signal outside neutral range Bearish Signals (▼): Bear Highlight: Lower HA close than previous signal (strongest) Bear Normal: Normal signal within neutral range (-100 to 100) Bear Gray: Normal signal outside neutral range Transition Signals: HA DD: Hollow green to hollow red transition HA UU: Hollow red to hollow green transition 4. Visual Features Color Coding: Green/Lime: Bullish patterns and signals Red/Orange: Bearish patterns and signals Pink/Cyan: Divergence conditions White: Neutral signals Background Zones: Upper Zone (50-500): Overbought/extreme high areas Lower Zone (-50 to -500): Oversold/extreme low areas Reference Lines: Do Not Short (-500), Do Not Long (500), Semi-lines (±250) Display Modes: Hybrid: Shows both MACD and Heikin-Ashi MACD: MACD line and signal only Histogram: Histogram only 5. Alert System The script provides comprehensive alerts for: Bull/Bear signal types (Highlight, Normal, Neutral Area) HA DD/UU transitions Divergence start/end conditions 6. Customization Options MACD Settings: Fast/slow lengths, signal parameters UI Options: Colors, display modes, background fills Pattern Detection: Enable/disable various pattern types Divergence Styling: Custom colors for divergence conditions This indicator is particularly useful for traders who want to combine the smoothing benefits of Heikin-Ashi with the momentum insights of MACD for more accurate entry and exit timing.Pine Script®指标由sickleavetoday提供12
Stochastic MACDStochastic MACD Indicator: Quick Guide This Pine Script indicator, "Stochastic MACD" (SMACD), blends MACD and Stochastic Oscillator principles to help you spot momentum shifts and potential reversals. What it Shows: SMACD Line: Tracks momentum. Signal Line: Averages the SMACD line, creating crossovers. Histogram: Visualizes momentum strength, changing color with direction. Overbought/Oversold Levels: (Default 10 and -10) Help identify stretched market conditions. Adjustable in settings. Visual Signals (Triangles): Red Down Arrow (Overbought Signal): Appears when both SMACD and Signal lines are above the Overbought level (default 10) AND SMACD crosses the Signal line upwards. This suggests strong overbought conditions and a potential reversal down. Green Up Arrow (Oversold Signal): Appears when both SMACD and Signal lines are below the Oversold level (default -10) AND SMACD crosses the Signal line upwards. This suggests potential buying opportunities from oversold conditions and a possible reversal up. How to Use It: Confirm Trends: Use the histogram and line directions. Spot Reversals: Look for the red and green triangles for quick alerts. Combine: Always use with other analysis like price action or support/resistance. Important: This is an analytical tool, not financial advice. Trading involves risk.Pine Script®指标由Claes_J提供已更新 35