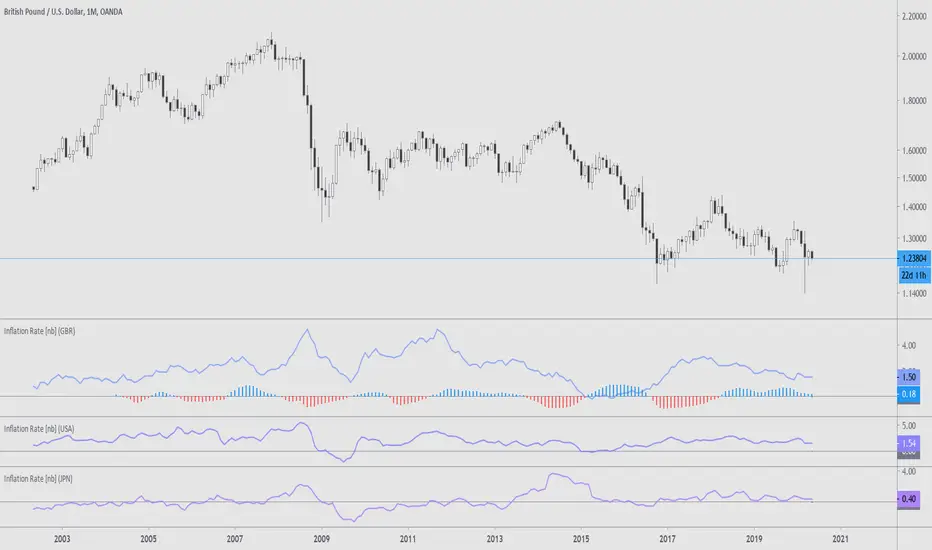
Many Inflation RateThis is a assortment of countries' inflation rates, sourced by Quandl. The countries are represented by their ISO 3166-1 alpha-3 codes in the options, and at the moment include:
ARG, AUS, CAN, CHE, DEU, EUR, FRA, GBR, ITA, JPN, NZL, RUS, USA
Included is a correlation to the current chart and the selected inflation rate. The correlation compares the monthly moving averages of YOY inflation and the chart closes over a period of two years. At the moment this doesn't seem to be the most efficient method of correlation/comparison, should there be one to begin with.
More information:
www.ons.gov.uk
www.bls.gov
voxeu.org
en.wikipedia.org
See here for a different version:
Neobutane
US Inflation Rate [nb]This is the United States inflation rate, based on the total Consumer Price Index published by the U.S. Bureau of Labor Statistics.
Option to toggle:
A line to display the inflation rate in December. It does not change until the next December.
What the color change to red is indicative of:
According to the Federal Open Market Committee (FOMC) regarding inflation rate, "2% is a bae number to be around". This does not imply a strict 2% inflation for success and allows room for federal rate cuts should they be needed.
Although FOMC declared 2% to be "bae" in 2012, James Bullard, of federal banking fame, claims that started to become the norm in 1995. Therefore the inflation rate line will only turn red 1995 onwards, and serves as a friendly reminder that inflation has been over at or over 2% for more than one month.
Sources:
www.bls.gov
www.federalreserve.gov
www.stlouisfed.org

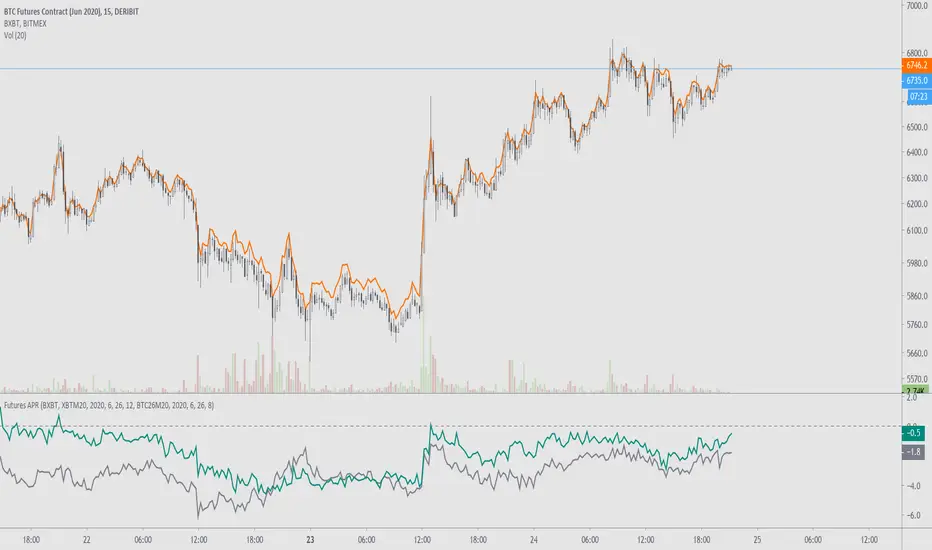
Futures APRFutures basis % for any ticker.
Requires: an index to compare against, the futures ticker, and the expiration year/month/day/hour. Optional second ticker to compare with.
Example explanation using bitcoin futures:
For Deribit, their futures expire at 0800UTC and the ticker will show the date of expiration. For example, BTC27H20's expiration is the 27th of March, 2020, at 0800UTC. For BitMEX, their futures expire at 1200UTC and have the same expiration dates.
www.deribit.com
"3 and 6 months quarterly of the March, June, September, December cycle; Quarterly futures expire the last Friday of each calendar quarter at 08.00 UTC."
www.bitmex.com
Archived page here: archive.is
"This contract settles on the .BXBT30M Index value as of the Jun 26, 5:00 AM (12:00:00 PM UTC)."
Once the June 2020 contract does expire you can always replace "XBTM20" with the currently running contract.
Notes on futures charts that never expire:
For OKEx, their futures charts are continuous, meaning that the indicator's values won't be accurate past prior expirations. This will be the same for other continuous futures charts such as BTC1!. This is because they are displaying previously expired contracts combined together.
CME Equity Futures Price Limits
Breakers for CME's futures contracts. Should work on CST/EST/UTC charts.
CME says it uses the last 30 seconds of the session to grab a reference price, so I took the open of the last session's candle because it's easier.
Out of session breakers: +/-5%
Limit downs: -7%/-13%/-20%
There are some minor nuances for the later part of the NY session but I don't really care to add that in right now.
Options:
- Input a manual reference price to override the selected price for accuracy.
- Show only the current/last session's limits. This breaks the in session limit down lines.
Live prices:
www.cmegroup.com
Month codes:
www.cmegroup.com
Reference:
www.cmegroup.com
It's best to check the last updated reference price to ensure it's correct.

.BXBT IndexThe current .BXBT index weighted as close as possible to BitMEX's with updates as BitMEX refreshes their index.
Difference between this and the script titled '2020 March 27 .BXBT Index': this one will receive updates because it doesn't have a date in its title.
Methodology
www.bitmex.com
"BitMEX Index Weights, assuming no constituent exchanges have been excluded due to Index Protection Rules, last updated 27 December 2019 at 12:00:05 UTC."
Binance: -
Bitstamp: 10.61%
Bittrex: 2.53%
Coinbase: 52.30%
Gemini: 6.89%
Huobi: -
Itbit: 4.21%
Kraken: 23.46%
Poloniex: -
ItBit's weight is combined with Gemini's due to ItBit not being on TradingView as of now. BITTREX:BTCUSD substituted with BITTREX:BTCUSDT*POLONIEX:USDTUSD to backfill because Bittrex only recently (late 2018) started to offer a fiat BTC/USD pair. Not that it matters since the index used in 2018 didn't include Bittrex if I remember correctly.
What is actually used for 27/12/2019 to 27/03/2020:
Binance: -
Bitstamp: 10.61%
Bittrex: 2.53%
Coinbase: 52.30%
Gemini: 11.10%
Huobi: -
Itbit: -
Kraken: 23.46%
Poloniex: -
Options:
Toggle candlesticks or close line
Change price source to be used for indicators
To be added: Change quarter to show indexes for different times, with labels that apply to the appropriate index used
Reasons to use this vs. the index itself: (not many)
It is helpful as a reference for other indicators or creation of an index.

2020 March 27 .BXBT IndexAs described here:
www.bitmex.com
blog.bitmex.com
With itBit's weight given to \Gemini because it currently is not on TradingView and they're both small NY based exchanges.
BITSTAMP: 24.86%
BITTREX: 2.53%
COINBASE: 44.98%
GEMINI: 7.41%
KRAKEN: 20.22%
BITSTAMP:BTCUSD^0.2486*BITTREX:BTCUSD^0.0253*COINBASE:BTCUSD^0.4498*GEMINI:BTCUSD^0.0741*KRAKEN:XBTUSD^0.2022
Intended for use with volume based indicators because BitMEX's indices do not include volume data.

Percent Change MtFThis plots the selected resolution's percent change from open to close. Easy way to check the previous period's range with less noise. Note the latest period is calculating on a bar that hasn't closed so it won't update unless you refresh/change timeframes to prevent incorrect reporting.

Bitcoin CME Gaps [NeoButane]Simple script that checks for gaps in price from CME. tickerid(x, y, sess) doesn't seem to be applying correctly for the ticker specified at the moment so there are a couple of 'gaps' peppered on lower timeframes.
Gaps are legitimate price levels to look as a support or resistance. The theory is that volume needs to be gap filled, but I currently believe it's an easy entry/exit trade for those who can move the market. I don't think there is sound analysis behind the why, but it is real.

FTX Index Advance Decline LineAs of publishing, all the tickers from FTX with the word "index" in it, plus bitcoin.
This is your regular ADL except instead of hundreds in the basket you've got them condensed into 7 (for now) and in open/close candle form instead of a line.
I'm a bit disappointed because I thought I'd lever more utility from indexes. It may just need some tweaking.
Doesn't it look like Renko?
Some notes:
Reason why it expands:
Total number of constituents is a static 7, to fix that use time to change the total variable based on dates of introduction.
Reallly looks like Renko:
Renko with ATR, length 14, hourly chart.

It's Sunday and 2300UTCCME bitcoin trading opens at 5p.m. CT (UTC-6) on Sunday. This translates to 2300 UTC.
www.cmegroup.com
Orange: CME open hour candle's range is smaller than the previous hourly candle
Fuchsia: CME open hour candle's range is larger than the previous hourly candle
If there is a blue highlight after CME open, that means the candle after the open has a larger range. Otherwise there is no highlight.

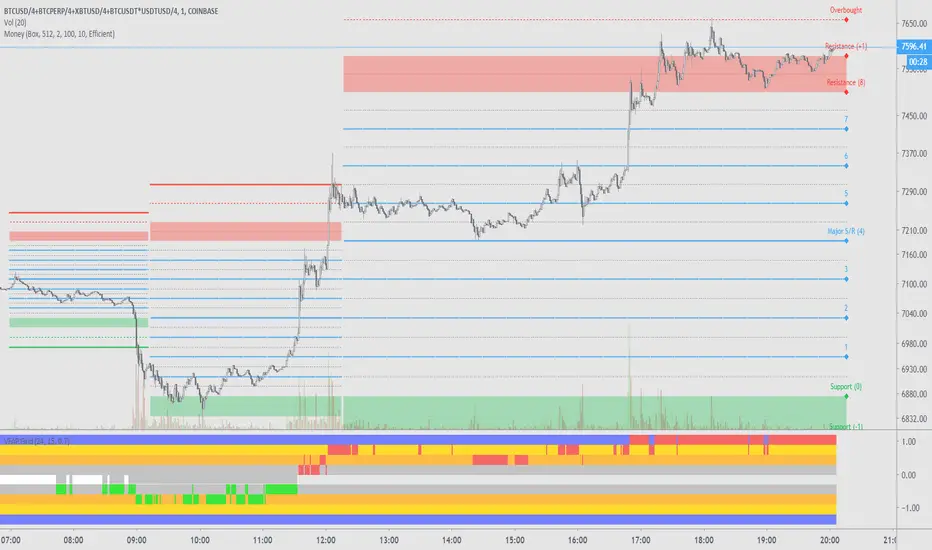
VFAP Grid [NeoButane]The formula is based on volume and second/third derivations of price to create known, reliable zones where a trade may be executed. It is the same formula used in VFAP Bands, but with it as an detached indicator there are minor adjustments and it is much easier to visualize on lower time frames where the outer bands are not visible.
The main focus is reliability, with visibility being second. Best used with Money Box or horizontals.
It's bands...in a box!
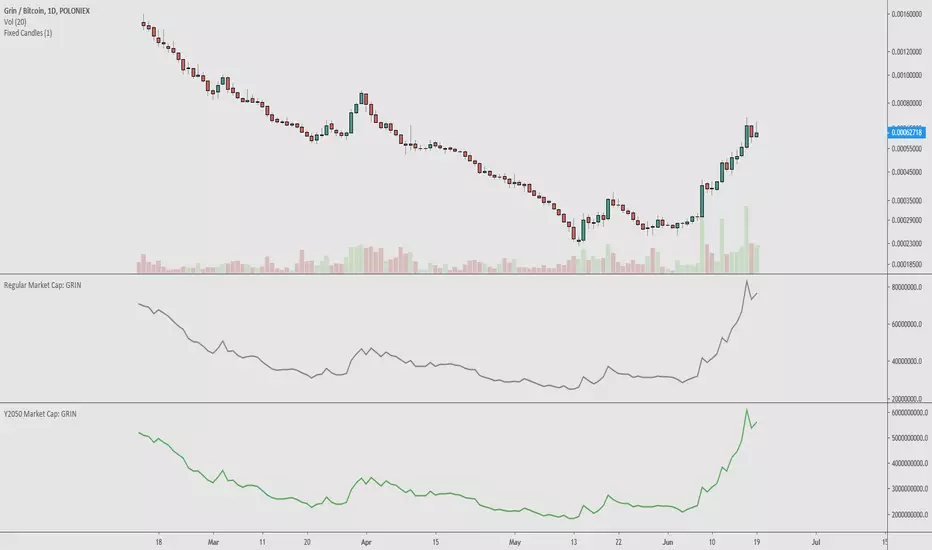
Y2050 Market Cap: GRINMethodology:
Composite of Bittrex and Poloniex to smoothen out the skewed values from lack of liquidity.
To be concise, the main advantage that a Y2050 market cap has over a 'regular' market cap is that it takes into account:
Inflation
What supply should be in the future
What the market cap could be in world of tomorrow
I'm having difficulty publishing the script so bear with me if the professional quality of the description is lacking. As always, I hope you are able to make use of this indicator and find new ways to create a consistent system to test out.
NB

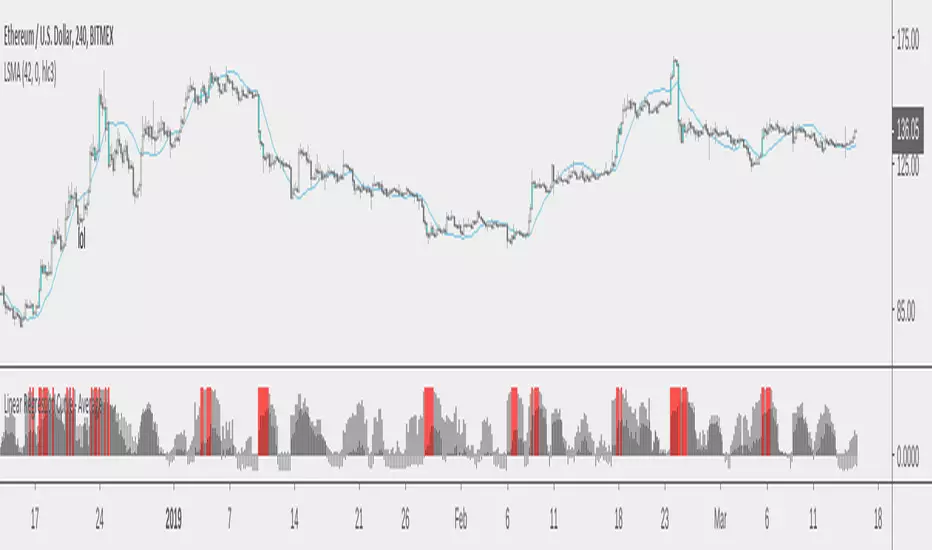
Linear Regression Curve - AverageIdea is that the average of price has something to do with sudden changes in trend. Finding trend shifts in mundane.
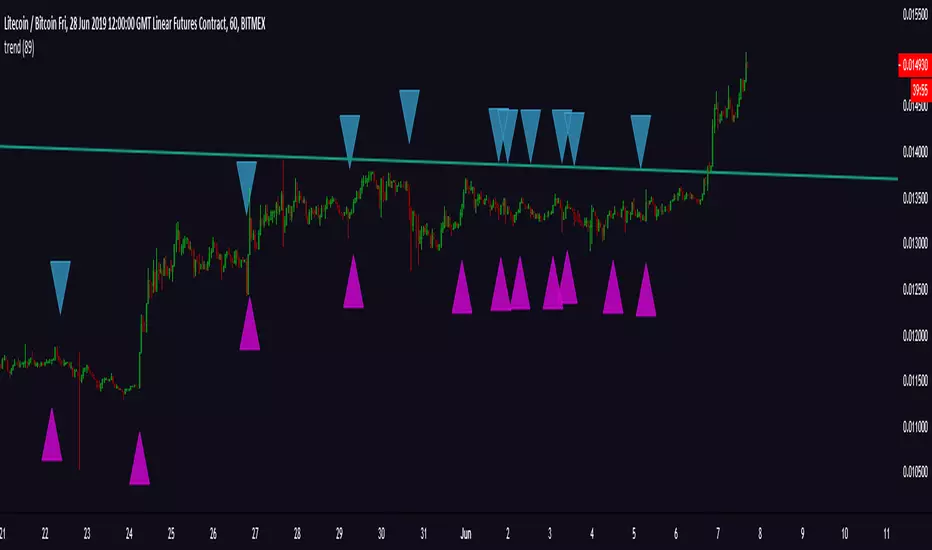
Binance TRX & BTTShows TRX with BTT, subtracted or added to. Subtracting makes it in line with BitMEX futures. The option to add is considered for 'true value'. Airdrops, like new coin forks, can split value: a good example being BCHABC and BCHSV.
Getting TRX futures to match TRX on Binance is likely tied to the monthly airdrop rate as defined here: support.binance.com
I'm guessing it has something to do with (spot price * estimated airdrop rate) trading too far from futures. Maybe even too close. Or because futures are trading above spot near a monthly airdrop snapshot. Much complicate. Such guess. Wow.
Binance is chosen as pricing source for its liquidity and earliest open date.

XBT Fader [NeoButane]Proof of concept indicator. Intended usage: to create confidence in buying a dump, or selling a pump. This is not a trending tool.
It works by monitoring spikes in volume as well as abnormally ATR. Generally speaking, bitcoin reverses every time there's a one candle spike with no following volume. There is a limit in which a signal is triggered in case bitcoin continues running. Other preventive measures include a modified MFI and fairy dust.
In future iterations, take profits and stop losses will be implemented also based upon average candle percentage move rather than ATR.

% Range [NeoButane]A range based on a user chosen top and bottom. With that the:
Middle of range
+/- 0.25% / 0.5% / 1% away from middle of the range
+/- 0.5% / 1% away from range top and range bottom
are given.
A list of my premium indicators: medium.com
Below are some examples of how a range can be chosen:
Another way is choosing a higher timeframe candle that encapsulates most of the trading range.

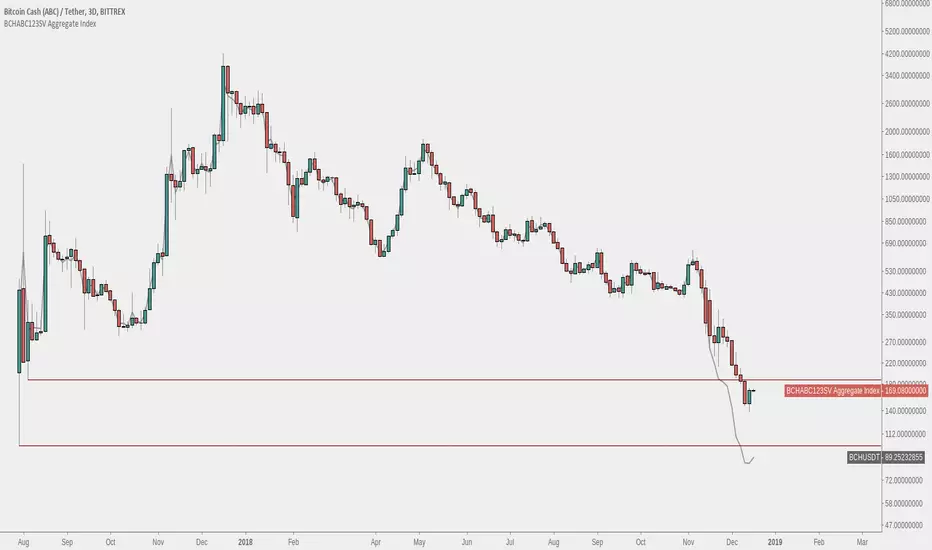
Bitcoin Cash - BCHABCSV Aggregate IndexAn index of both Bitcoin Cash ABC pre-fork and Bitcoin Cash ABC + Bitcoin Cash SV post-fork.
The pre-fork BCH used is from Bittrex, and Binance is used for ABC and SV afterwards.
Option to choose USDT or BTC pairing.
Instructions:
1. Load up a BCH chart from Bittrex, ex. 'BITTREX:BCHABCUSDT' or 'BITTREX:BCHSVBTC' for full chart history
2. Hide original candlesticks
3. Right click the price scale and untick 'Scale Price Chart Only'
Levels Ft. VolumeThese are levels based on volume. The idea is that candles of high volume a higher amount of traders with active long/short positions to either close out, protect, or add to.
A stack of red candles means that area is a point of interest, similar to a VPVR POC.

Price Action Oscillator [NeoButane]An oscillator based on pivots and divergences in the future, with an emphasis on utilizing wicks to find the 'best fit' horizontal levels.
This is a study I am working on to find to find divergences and swings better, and how using an oscillator can enhance the pickings of swings and levels.
A list of my indicators: medium.com

CWAP - Candle Close Weighted Average PriceVariable EMA length based on candle closes.
Current candle is greater/lesser than previous candle close in successive periods = add to the length
In the case of reversals, price tends to spike up, retrace, then reverse. In that event, the EMA resets length to catch up before a full reversal occurs.
When price moves uniformly in one direction, the EMA length increases excessively to prevent chop.
Similar to a McGinley Dynamic, except weight isn't give to a particular direction.
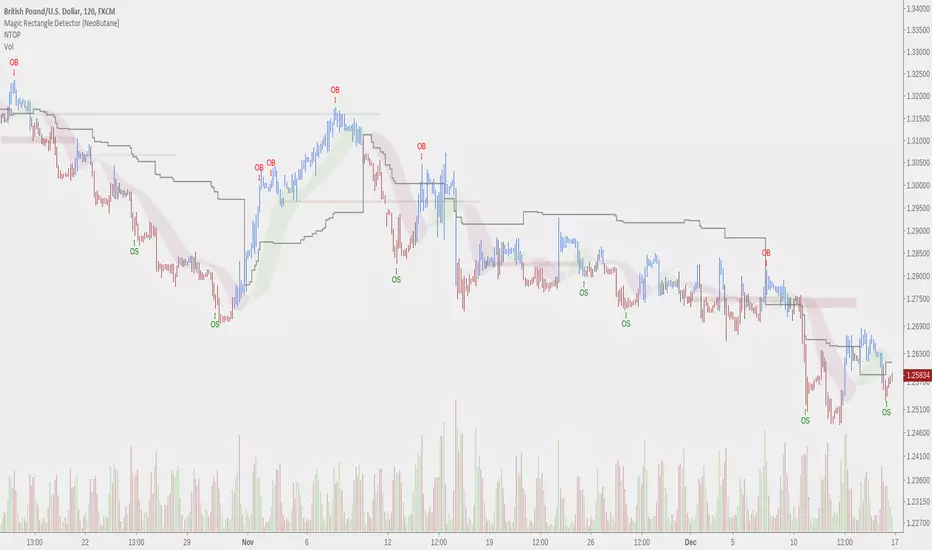
NTOP - Trend OverlayNTOP is a collection of trend-following tools show short and long term trends.
Since NTOP is the antithesis of VFAP, all the components are based on trend and and complement each other to give a full picture. NTOP produces signals that give both entries and exits on any timeframe. Options to configure are showing/hiding which signals you prefer and OB/OS sensitivity; there are no adjustments that need to be made as this indicator is made to be as simple as possible.
Signal Line: long term, good for determining if a winning position should be exited if it's going in the wrong direction
Ribbon: short/medium/long term, great for entering and adding to position
Bull/Bear Signals in the form of text: specific price points where the trend is overextended or confirmed
Bar Coloring: Two main colors, blue and red, to visualize trend, with a dark color to show interim price movements that may retrace
A list of my indicators and pricing: medium.com
1 minute:
30 minute:
Daily:
Monthly: