Vib ORB Range (Free)Vib ORB Range (Free) plots the Opening Range High and Low for the session based on a user-defined start time and duration.
This tool is designed for traders who want a clean, no-noise display of the ORB zone without extra indicators or automation.
Features:
Customizable Opening Range start time
Customizable Opening Range duration
Automatically resets daily
Plots ORB High, ORB Low, and optional ORB Midline
Shaded range zone for improved clarity
Works on all timeframes and markets
How to Use:
Set the ORB start time (default 9:30 New York)
Set the ORB duration (default 15 minutes)
The indicator will draw the ORB zone once the range completes
Use the outlines or shaded zone to visually identify potential breakout areas
This free tool is intended as a simple, reliable ORB visualizer without alerts, filters, or strategy logic.
NQ

John NQ indicator v1NQ traders
puts lines on critical levels
so you have a good view of where to long or short, where price struggles
you can use it in multi timeframe change colors and thicknes of lines in settings.
enjoy ... version 2 will be out soon

Futures Position Size Calculator (NQ/ES)DISCLAIMER:
This indicator is provided solely for informational and educational purposes. It calculates position sizing based on user-defined inputs such as entry and stop-loss levels, but it does not provide trading signals, recommendations, or financial advice . All trading decisions are made at the sole discretion of the user.
By using this indicator, you acknowledge that you are fully responsible for your own trades and risk management . The developer/publisher of this indicator assumes no liability for any losses, damages, or financial consequences that may arise from its use.
Features:
• Position size calculator (based on Entry & Stop Loss)
• Reward ratio calculator (1R, 2R, 3R, etc.)
• Supports: NQ / MNQ / ES / MES
Usage:
When you first add the script to your chart (on any supported futures symbol), you will be prompted to set the Entry Price and Stop Loss Price on the chart using draggable lines .
After setup, you can freely move the price lines, and the indicator will automatically update:
• Position size
• Reward targets
• Direction (long/short is auto-detected)
RISK Settings:
You can calculate position size using either:
1. Account Percent
Select "Percent" in the Risk Method dropdown and enter the percent of your account you want to risk per trade.
2. Fixed Dollar Amount
Select "Fixed Dollar" in the Risk Method dropdown and enter the dollar amount you want to risk.
You may set separate values for: NQ, MNQ, ES, and MES.
Reward Calculator:
Enable the checkbox "Show Reward Targets" in the Reward Ratio section to display projected targets (1R, 2R, etc.).
You can also choose how many R-levels are displayed on the chart.

Micro/Mini P&L [LDT]Overview
Micro/Mini P&L is a risk and P&L visualization tool built primarily for futures traders.
It provides accurate dollar-based calculations for either micros or minis, regardless of which contract type you are currently charting.
The indicator automatically detects your instrument (NQ, MNQ, ES, MES, YM, RTY, CL, GC, etc.) and adjusts point-value data accordingly, allowing you to chart one contract while evaluating risk for another.
This removes the need for manual conversions and keeps your position data consistent at all times.
Although optimized for futures, the tool also works on any other asset for general trade-level visualization.
Features
• Automatic instrument detection for major futures markets including NQ/MNQ, ES/MES, YM/MYM, RTY/M2K, CL/MCL, GC/MGC and others.
Point-value logic adjusts instantly based on the detected symbol ensuring accurate calculations without manual configuration.
• Micro/Mini display toggle, allowing you to calculate dollar values for either contract type regardless of which contract is on your chart.
Useful for traders who prefer charting minis whilst trading micros or the opposite.
• Trade-level visualization, including Entry, Take Profit and Stop Loss levels with automatically drawn lines and optional TP/SL zone shading for clear and structured display on the chart.
• Dynamic P/L calculations, showing both point-based and dollar-based metrics in real time.
This includes TP/SL dollar values, points to target/stop, real-time P/L and an optional risk-reward ratio.
• Adaptive risk table, displaying contract counts from 1 up to your selected maximum, total dollar risk for each row and highlighting your chosen contract size.
This provides a straightforward method for evaluating risk, scaling and position sizing.
• Customizable display options, including color settings, label visibility, extension length, bar offsets and table positioning.
This allows the tool to remain clean, unobtrusive and easy to integrate into any chart layout.
Purpose
This tool is designed to give futures traders a clear, consistent and reliable way to view dollar-accurate risk per contract without performing manual conversions.
Whether you trade micros or minis, the displayed values always align with your selected contract type, even when charting the opposite market.

Pulsar Trading System-LITE📡 Pulsar Trading System
OVERVIEW
Pulsar is a comprehensive breakout trading system that combines dynamic support/resistance detection, trend filtering, and volume confirmation to identify high-probability entry opportunities. Unlike simple breakout indicators, Pulsar uses multi-timeframe analysis and adaptive ATR-based calculations to filter false signals and provide complete trade management from entry to exit.
WHAT MAKES THIS ORIGINAL
This indicator is unique in its integration of multiple complementary systems:
-Adaptive ATR Zones: Support and resistance levels are not static—they dynamically adjust based on current market volatility (ATR), creating entry zones that expand and contract with market conditions rather than using fixed price levels.
-Multi-Timeframe SuperTrend Filter: The trend filter operates on a higher timeframe than the chart (e.g., 5-minute SuperTrend on a 1-minute chart) to prevent counter-trend trades while maintaining granular entry precision. The visual ribbon with humorous warning text ("🚫 Don't Short - Trend is Your Friend! 📈") provides immediate trend awareness.
-Intelligent Cooldown System: After any trade exit (stop loss or take profit), the system enters a configurable cooldown period, preventing overtrading during choppy or consolidating market conditions—a critical feature often missing in breakout systems.
-Dynamic Trailing Stops: The trailing stop uses ATR multipliers to lock in profits while adapting to volatility, moving only in the favorable direction and never loosening.
-Comprehensive Dashboard: Real-time analysis displays trade status, entry prices, distances to targets in both points and ATR multiples, volume confirmation status, and cooldown countdown.
HOW IT WORKS
Core Detection Logic:
Pulsar identifies breakout opportunities by monitoring price interaction with dynamically calculated support and resistance levels:
Support/Resistance Calculation: Uses ta.lowest() and ta.highest() over a configurable lookback period to identify key levels, then adds ATR-based buffers (0.5 × ATR) to create entry zones.
Breakout Conditions:
Long Entry: Price closes above support buffer AND recent low touched support AND volume exceeds threshold
Short Entry: Price closes below resistance buffer AND recent high touched resistance AND volume exceeds threshold
SuperTrend Filter: A separate higher-timeframe SuperTrend calculation determines overall trend direction. Entries only trigger when breakout direction aligns with SuperTrend (bullish breakout + bullish trend, or bearish breakout + bearish trend).
Volume Confirmation: Current volume must exceed a configurable multiple of the 14-period SMA (default 1.0×) to confirm genuine interest in the breakout.
Cooldown Mechanism: After exit, the system tracks bars elapsed and blocks new signals until the cooldown period completes, preventing rapid-fire entries in ranging markets.
Trade Management:
Stop Loss: Calculated as entry zone ± (ATR × SL Multiplier)
Take Profit 1: Entry zone ± (ATR × TP1 Multiplier)
Take Profit 2: Entry zone ± (ATR × TP2 Multiplier)
Trailing Stop (optional): Updates every bar, moving the stop closer by maintaining distance of (ATR × Trailing Multiplier) from current price, but only in favorable direction
SuperTrend Calculation:
The SuperTrend uses standard methodology:
Upper Band = (High + Low) / 2 + (Multiplier × ATR)
Lower Band = (High + Low) / 2 - (Multiplier × ATR)
Direction changes when price crosses opposite band
The ribbon visualization adds a width offset (ATR × Ribbon Width) to create a filled zone rather than a single line.
HOW TO USE
Setup:
Add Pulsar to your chart (works best on liquid instruments like NQ, ES, CL)
Configure timeframe-specific settings (see recommendations below)
Enable SuperTrend Filter for trend-following mode, or disable for pure breakout mode
Set up alerts for Entry, TP1, TP2, and Stop Loss events
Recommended Settings by Timeframe:
1-Minute Charts:
Lookback Period: 10-15
SuperTrend Timeframe: 5 min
ATR Timeframe: 5 min (for stability)
Cooldown: 8-12 bars
Trailing Stop: Enabled with 0.8-1.0 multiplier
5-Minute Charts:
Lookback Period: 15-20
SuperTrend Timeframe: 15 min
ATR Timeframe: current chart
Cooldown: 5-8 bars
Trailing Stop: Optional
15-Minute+ Charts:
Lookback Period: 20-30
SuperTrend Timeframe: 1 hour
ATR Timeframe: current chart
Cooldown: 3-5 bars
Trailing Stop: Optional
Interpreting Signals:
Long/Short Zone Box: Green (long) or red (short) box appears when breakout conditions are met
Blue Entry Line: Shows your entry price
Red/Orange SL Line: Red = fixed stop, Orange = trailing stop (moves in real-time)
Green TP Lines: TP1 (closer) and TP2 (further) targets
SuperTrend Ribbon: Green = bullish trend (favor longs), Red = bearish trend (favor shorts)
Dashboard Status: Monitor trade state, distances, volume confirmation, and cooldown
Best Practices:
Use SuperTrend Filter: Significantly reduces false signals by avoiding counter-trend trades
Enable Cooldown on Fast Timeframes: Prevents overtrading on 1-5 minute charts
Volume Confirmation is Critical: Don't lower volume multiplier below 0.9 on futures
Use Higher Timeframe ATR: On 1-minute charts, use 5-minute ATR for stability
Avoid Major News Events: Disable during FOMC, NFP, CPI releases
Scale Out Strategy: Consider taking partial profits at TP1, letting remainder run to TP2
Parameter Optimization:
Start conservative and adjust based on results:
Too many stop-outs: Increase SL multiplier or SuperTrend multiplier
Missing good trades: Decrease volume multiplier or cooldown period
Too many false signals: Increase volume multiplier, lookback period, or cooldown
Profits not protected: Enable trailing stop or reduce trailing multiplier
KEY FEATURES
✅ Dynamic ATR-Based Zones: Entry, stop loss, and take profit levels automatically adjust to market volatility
✅ Multi-Timeframe Trend Filter: Uses higher timeframe SuperTrend to eliminate counter-trend trades
✅ Volume Confirmation: Filters low-volume false breakouts
✅ Intelligent Cooldown: Prevents overtrading with configurable post-trade waiting period
✅ Trailing Stop System: Optional dynamic stops that lock in profits using ATR distance
✅ Real-Time Dashboard: 13-row analysis showing trade status, targets, distances, volume, and cooldown
✅ Visual Ribbon Warnings: Humorous trend-following reminders on SuperTrend ribbon
✅ Complete Alert System: Notifications for entries, TP1, TP2, fixed stops, and trailing stops
✅ Customizable Visuals: Adjustable colors, dashboard position, text size, and line lengths
✅ Non-Repainting: Uses lookahead = barmerge.lookahead_off for all multi-timeframe calculations
SETTINGS EXPLAINED
SuperTrend Filter:
Enable: Toggle trend filtering on/off
Timeframe: Higher timeframe for trend analysis (recommended 3-5x chart timeframe)
ATR Period: Period for ATR calculation in SuperTrend (10-14 standard)
Multiplier: Distance from center band (2.5-3.5 for most markets)
Ribbon Width: Visual thickness of trend ribbon (0.2-0.5)
Core Parameters:
Lookback Period: Bars used to identify support/resistance (lower = more sensitive)
ATR Period: Bars for Average True Range calculation (14 is standard)
ATR Timeframe: Use higher timeframe ATR for smoother calculations on fast charts
Volume Multiplier: Required volume vs average (1.0 = average, 1.5 = 50% above average)
TP/SL:
SL Multiplier: Stop loss distance in ATR units (1.0-2.0 typical)
TP1 Multiplier: First target in ATR units (1.5-2.5 typical)
TP2 Multiplier: Second target in ATR units (2.0-3.5 typical)
Trailing Stop:
Enable: Activate dynamic trailing stop
Multiplier: Distance from current price in ATR units (0.8-1.5 typical)
Cooldown:
Enable: Prevent new signals after trade exit
Bars: Number of bars to wait before allowing next trade (higher on fast timeframes)
IMPORTANT NOTES
⚠️ Not a Holy Grail: No indicator is perfect. Pulsar is a tool that requires proper risk management, position sizing, and trading discipline.
⚠️ Backtest First: Test settings on historical data before live trading. Results vary by instrument, timeframe, and market conditions.
⚠️ Market Conditions Matter: Breakout systems perform best in trending markets. Consider reducing size or disabling during known choppy periods.
⚠️ Stop Loss is Mandatory: Always use the provided stop loss levels. Markets can move against you rapidly.
⚠️ Volume Data Required: This indicator requires volume data to function properly. It will display a warning if volume is unavailable.
⚠️ No Repainting: All multi-timeframe calls use non-repainting settings. What you see in real-time is what will be plotted historically.
TECHNICAL SPECIFICATIONS
Version: Pine Script v6
Type: Indicator (overlay = true)
Max Boxes: 500 (for zone visualization)
Max Lines: 500 (for TP/SL levels)
Max Labels: Unlimited (for annotations)
Repainting: None (uses lookahead = barmerge.lookahead_off)
COMPATIBLE INSTRUMENTS
Works best on liquid instruments with reliable volume data:
✅ Futures: NQ, MNQ, ES, MES, YM, MYM, RTY, M2K, CL, GC
✅ Forex: Major pairs (EUR/USD, GBP/USD, etc.)
✅ Stocks: Large-cap stocks with high volume
⚠️ Crypto: Works but requires higher ATR multipliers
❌ Low Volume Stocks: May produce unreliable signals
SUPPORT
For questions, suggestions, or to report issues, please comment below. I actively maintain this indicator and appreciate feedback from the community.
Enjoy trading with Pulsar! 🌟

MNQ Hybrid Scalper Pro - Advanced NASDAQ Futures Scalping System🎯 Overview
The MNQ Hybrid Scalper Pro is a comprehensive scalping system engineered specifically for NASDAQ futures traders. This indicator implements a modern hybrid approach that combines institutional-grade VWAP analysis with momentum oscillators optimized for the unique volatility characteristics of the NASDAQ market. Developed through extensive research on MNQ/NQ price action patterns, this indicator provides clear, actionable signals while filtering out market noise during high-volatility periods.
✨ Key Features
1. VWAP Foundation
Session-anchored VWAP with automatic reset
Dynamic standard deviation bands (1σ and 2σ)
Color-coded price bars based on VWAP positioning
VWAP test detection with momentum confirmation
2. Optimized Momentum Suite
Fast RSI (7): Aggressive settings (85/15) for quick scalping signals
Scalping MACD (5,13,6): Optimized parameters with SMA option
Quick Stochastic (9,3,3): Tuned for 1-minute chart responsiveness
Divergence Detection: Automated bullish/bearish divergence alerts
3. Multi-Timeframe Trend Filter
Triple EMA system (9, 21, 50) on current and higher timeframes
Trend strength scoring (-3 to +3) for directional bias
Prevents counter-trend trades in strong trending markets
Visual trend alignment indicators
4. Smart Signal Generation
Long Signals: VWAP pullback + RSI oversold + MACD bullish turn + HTF trend alignment
Short Signals: VWAP rally + RSI overbought + MACD bearish turn + HTF trend alignment
Signal cooldown period to prevent overtrading
Session-based filtering for optimal trading windows
5. Risk Management Visualization
Automatic profit target levels (10 & 20 points)
Dynamic stop loss levels (6 & 8 points)
Risk/reward ratio calculation (minimum 1.5:1)
Breakeven level display after 5 points profit
Visual entry, target, and stop lines on chart
6. Session Intelligence
NY opening range highlight (first 30 minutes)
Optimal scalping window shading (9:30-11:30 AM EST)
Major session markers (Asia, Europe, NY)
Session countdown timer
Contract rollover reminders
7. Real-Time Performance Dashboard
Current trend status across timeframes
Signal statistics and win rate tracking
Position relative to VWAP
Momentum indicator status (OB/OS/Neutral)
Volume analysis (relative to 20-period average)
Volatility monitoring with ATR spike detection
8. Professional Alert System
High-probability entry alerts with specific levels
VWAP test notifications with momentum confirmation
Target and stop loss hit alerts
Trend alignment notifications
Comprehensive alert messages with entry, stop, and target prices
📈 How to Use
Optimal Setup:
Timeframe: Best on 1-minute charts (also works on 3-min and 5-min)
Instrument: Optimized for MNQ (Micro E-mini NASDAQ), works with NQ
Session: Most effective during NY session (9:30-11:30 AM EST)
Chart Type: Standard candlestick or bars
Signal Interpretation:
Green Triangle (▲): Long entry signal - all conditions aligned for upward scalp
Red Triangle (▼): Short entry signal - all conditions aligned for downward scalp
DIV Labels: Momentum divergence detected - potential reversal zones
Colored Bars: Green = above VWAP (bullish bias), Red = below VWAP (bearish bias)
Entry Checklist:
Wait for signal arrow to appear
Confirm trend alignment in dashboard (HTF Trend)
Check momentum status isn't extreme
Verify you're within optimal trading window
Enter at market with predetermined stop and target
⚙️ Customization Options
Display Settings:
Toggle individual components on/off
4 color schemes (Professional, Dark, Light, Classic)
Adjustable transparency and visual elements
Dashboard position selection
Signal Settings:
Adjust momentum indicator parameters
Modify risk/reward levels
Configure session filters
Set signal cooldown periods
Advanced Features:
Multi-timeframe period adjustment
Volatility filter sensitivity
Contract type selection (MNQ/NQ)
Alert configuration options
📊 Best Practices
Start in Simulation: Test the indicator in paper trading first
Respect the Trend: Don't fight the higher timeframe trend
Manage Risk: Use the suggested stop losses consistently
Time Your Trades: Focus on the optimal scalping window
Confirm Signals: Best results when multiple confirmations align
⚠️ Important Notes
Supplementary Tool: This indicator supplements but doesn't replace proper market analysis and order flow reading
No Repainting: All signals are confirmed on bar close
Education Required: Understanding of scalping principles recommended
Risk Management: Always use proper position sizing and risk management
Market Conditions: Performance varies with market volatility and conditions
🎓 Educational Value
This indicator serves as an excellent educational tool for:
Learning VWAP-based trading strategies
Understanding momentum indicator optimization
Practicing multi-timeframe analysis
Developing systematic scalping approaches
Risk management visualization
💻 Technical Specifications
Pine Script Version: v6
Calculation Method: Non-repainting, real-time
Performance: Optimized for minimal lag
Compatibility: All TradingView plan levels
Updates: Regularly maintained and improved
🏆 What Makes This Unique
Unlike generic indicators, the MNQ Hybrid Scalper Pro is specifically engineered for NASDAQ futures volatility patterns. It combines institutional trading concepts (VWAP) with retail-friendly visualization and clear signals, bridging the gap between professional and accessible trading tools.
📬 Support & Feedback
Questions, suggestions, or feedback? Leave a comment below or send a private message. Your input helps improve the indicator for the entire community.
CME_MINI:MNQ1!
Disclaimer: This indicator is for educational and informational purposes only. It does not constitute financial advice. Trading futures involves substantial risk of loss and is not suitable for all investors. Past performance is not indicative of future results. Always conduct your own analysis and consult with a qualified financial advisor.

BOCS Channel Scalper Strategy - Automated Mean Reversion System# BOCS Channel Scalper Strategy - Automated Mean Reversion System
## WHAT THIS STRATEGY DOES:
This is an automated mean reversion trading strategy that identifies consolidation channels through volatility analysis and executes scalp trades when price enters entry zones near channel boundaries. Unlike breakout strategies, this system assumes price will revert to the channel mean, taking profits as price bounces back from extremes. Position sizing is fully customizable with three methods: fixed contracts, percentage of equity, or fixed dollar amount. Stop losses are placed just outside channel boundaries with take profits calculated either as fixed points or as a percentage of channel range.
## KEY DIFFERENCE FROM ORIGINAL BOCS:
**This strategy is designed for traders seeking higher trade frequency.** The original BOCS indicator trades breakouts OUTSIDE channels, waiting for price to escape consolidation before entering. This scalper version trades mean reversion INSIDE channels, entering when price reaches channel extremes and betting on a bounce back to center. The result is significantly more trading opportunities:
- **Original BOCS**: 1-3 signals per channel (only on breakout)
- **Scalper Version**: 5-15+ signals per channel (every touch of entry zones)
- **Trade Style**: Mean reversion vs trend following
- **Hold Time**: Seconds to minutes vs minutes to hours
- **Best Markets**: Ranging/choppy conditions vs trending breakouts
This makes the scalper ideal for active day traders who want continuous opportunities within consolidation zones rather than waiting for breakout confirmation. However, increased trade frequency also means higher commission costs and requires tighter risk management.
## TECHNICAL METHODOLOGY:
### Price Normalization Process:
The strategy normalizes price data to create consistent volatility measurements across different instruments and price levels. It calculates the highest high and lowest low over a user-defined lookback period (default 100 bars). Current close price is normalized using: (close - lowest_low) / (highest_high - lowest_low), producing values between 0 and 1 for standardized volatility analysis.
### Volatility Detection:
A 14-period standard deviation is applied to the normalized price series to measure price deviation from the mean. Higher standard deviation values indicate volatility expansion; lower values indicate consolidation. The strategy uses ta.highestbars() and ta.lowestbars() to identify when volatility peaks and troughs occur over the detection period (default 14 bars).
### Channel Formation Logic:
When volatility crosses from a high level to a low level (ta.crossover(upper, lower)), a consolidation phase begins. The strategy tracks the highest and lowest prices during this period, which become the channel boundaries. Minimum duration of 10+ bars is required to filter out brief volatility spikes. Channels are rendered as box objects with defined upper and lower boundaries, with colored zones indicating entry areas.
### Entry Signal Generation:
The strategy uses immediate touch-based entry logic. Entry zones are defined as a percentage from channel edges (default 20%):
- **Long Entry Zone**: Bottom 20% of channel (bottomBound + channelRange × 0.2)
- **Short Entry Zone**: Top 20% of channel (topBound - channelRange × 0.2)
Long signals trigger when candle low touches or enters the long entry zone. Short signals trigger when candle high touches or enters the short entry zone. This captures mean reversion opportunities as price reaches channel extremes.
### Cooldown Filter:
An optional cooldown period (measured in bars) prevents signal spam by enforcing minimum spacing between consecutive signals. If cooldown is set to 3 bars, no new long signal will fire until 3 bars after the previous long signal. Long and short cooldowns are tracked independently, allowing both directions to signal within the same period.
### ATR Volatility Filter:
The strategy includes a multi-timeframe ATR filter to avoid trading during low-volatility conditions. Using request.security(), it fetches ATR values from a specified timeframe (e.g., 1-minute ATR while trading on 5-minute charts). The filter compares current ATR to a user-defined minimum threshold:
- If ATR ≥ threshold: Trading enabled
- If ATR < threshold: No signals fire
This prevents entries during dead zones where mean reversion is unreliable due to insufficient price movement.
### Take Profit Calculation:
Two TP methods are available:
**Fixed Points Mode**:
- Long TP = Entry + (TP_Ticks × syminfo.mintick)
- Short TP = Entry - (TP_Ticks × syminfo.mintick)
**Channel Percentage Mode**:
- Long TP = Entry + (ChannelRange × TP_Percent)
- Short TP = Entry - (ChannelRange × TP_Percent)
Default 50% targets the channel midline, a natural mean reversion target. Larger percentages aim for opposite channel edge.
### Stop Loss Placement:
Stop losses are placed just outside the channel boundary by a user-defined tick offset:
- Long SL = ChannelBottom - (SL_Offset_Ticks × syminfo.mintick)
- Short SL = ChannelTop + (SL_Offset_Ticks × syminfo.mintick)
This logic assumes channel breaks invalidate the mean reversion thesis. If price breaks through, the range is no longer valid and position exits.
### Trade Execution Logic:
When entry conditions are met (price in zone, cooldown satisfied, ATR filter passed, no existing position):
1. Calculate entry price at zone boundary
2. Calculate TP and SL based on selected method
3. Execute strategy.entry() with calculated position size
4. Place strategy.exit() with TP limit and SL stop orders
5. Update info table with active trade details
The strategy enforces one position at a time by checking strategy.position_size == 0 before entry.
### Channel Breakout Management:
Channels are removed when price closes more than 10 ticks outside boundaries. This tolerance prevents premature channel deletion from minor breaks or wicks, allowing the mean reversion setup to persist through small boundary violations.
### Position Sizing System:
Three methods calculate position size:
**Fixed Contracts**:
- Uses exact contract quantity specified in settings
- Best for futures traders (e.g., "trade 2 NQ contracts")
**Percentage of Equity**:
- position_size = (strategy.equity × equity_pct / 100) / close
- Dynamically scales with account growth
**Cash Amount**:
- position_size = cash_amount / close
- Maintains consistent dollar exposure regardless of price
## INPUT PARAMETERS:
### Position Sizing:
- **Position Size Type**: Choose Fixed Contracts, % of Equity, or Cash Amount
- **Number of Contracts**: Fixed quantity per trade (1-1000)
- **% of Equity**: Percentage of account to allocate (1-100%)
- **Cash Amount**: Dollar value per position ($100+)
### Channel Settings:
- **Nested Channels**: Allow multiple overlapping channels vs single channel
- **Normalization Length**: Lookback for high/low calculation (1-500, default 100)
- **Box Detection Length**: Period for volatility detection (1-100, default 14)
### Scalping Settings:
- **Enable Long Scalps**: Toggle long entries on/off
- **Enable Short Scalps**: Toggle short entries on/off
- **Entry Zone % from Edge**: Size of entry zone (5-50%, default 20%)
- **SL Offset (Ticks)**: Distance beyond channel for stop (1+, default 5)
- **Cooldown Period (Bars)**: Minimum spacing between signals (0 = no cooldown)
### ATR Filter:
- **Enable ATR Filter**: Toggle volatility filter on/off
- **ATR Timeframe**: Source timeframe for ATR (1, 5, 15, 60 min, etc.)
- **ATR Length**: Smoothing period (1-100, default 14)
- **Min ATR Value**: Threshold for trade enablement (0.1+, default 10.0)
### Take Profit Settings:
- **TP Method**: Choose Fixed Points or % of Channel
- **TP Fixed (Ticks)**: Static distance in ticks (1+, default 30)
- **TP % of Channel**: Dynamic target as channel percentage (10-100%, default 50%)
### Appearance:
- **Show Entry Zones**: Toggle zone labels on channels
- **Show Info Table**: Display real-time strategy status
- **Table Position**: Corner placement (Top Left/Right, Bottom Left/Right)
- **Color Settings**: Customize long/short/TP/SL colors
## VISUAL INDICATORS:
- **Channel boxes** with semi-transparent fill showing consolidation zones
- **Colored entry zones** labeled "LONG ZONE ▲" and "SHORT ZONE ▼"
- **Entry signal arrows** below/above bars marking long/short entries
- **Active TP/SL lines** with emoji labels (⊕ Entry, 🎯 TP, 🛑 SL)
- **Info table** showing position status, channel state, last signal, entry/TP/SL prices, and ATR status
## HOW TO USE:
### For 1-3 Minute Scalping (NQ/ES):
- ATR Timeframe: "1" (1-minute)
- ATR Min Value: 10.0 (for NQ), adjust per instrument
- Entry Zone %: 20-25%
- TP Method: Fixed Points, 20-40 ticks
- SL Offset: 5-10 ticks
- Cooldown: 2-3 bars
- Position Size: 1-2 contracts
### For 5-15 Minute Day Trading:
- ATR Timeframe: "5" or match chart
- ATR Min Value: Adjust to instrument (test 8-15 for NQ)
- Entry Zone %: 20-30%
- TP Method: % of Channel, 40-60%
- SL Offset: 5-10 ticks
- Cooldown: 3-5 bars
- Position Size: Fixed contracts or 5-10% equity
### For 30-60 Minute Swing Scalping:
- ATR Timeframe: "15" or "30"
- ATR Min Value: Lower threshold for broader market
- Entry Zone %: 25-35%
- TP Method: % of Channel, 50-70%
- SL Offset: 10-15 ticks
- Cooldown: 5+ bars or disable
- Position Size: % of equity recommended
## BACKTEST CONSIDERATIONS:
- Strategy performs best in ranging, mean-reverting markets
- Strong trending markets produce more stop losses as price breaks channels
- ATR filter significantly reduces trade count but improves quality during low volatility
- Cooldown period trades signal quantity for signal quality
- Commission and slippage materially impact sub-5-minute timeframe performance
- Shorter timeframes require tighter entry zones (15-20%) to catch quick reversions
- % of Channel TP adapts better to varying channel sizes than fixed points
- Fixed contract sizing recommended for consistent risk per trade in futures
**Backtesting Parameters Used**: This strategy was developed and tested using realistic commission and slippage values to provide accurate performance expectations. Recommended settings: Commission of $1.40 per side (typical for NQ futures through discount brokers), slippage of 2 ticks to account for execution delays on fast-moving scalp entries. These values reflect real-world trading costs that active scalpers will encounter. Backtest results without proper cost simulation will significantly overstate profitability.
## COMPATIBLE MARKETS:
Works on any instrument with price data including stock indices (NQ, ES, YM, RTY), individual stocks, forex pairs (EUR/USD, GBP/USD), cryptocurrency (BTC, ETH), and commodities. Volume-based features require data feed with volume information but are optional for core functionality.
## KNOWN LIMITATIONS:
- Immediate touch entry can fire multiple times in choppy zones without adequate cooldown
- Channel deletion at 10-tick breaks may be too aggressive or lenient depending on instrument tick size
- ATR filter from lower timeframes requires higher-tier TradingView subscription (request.security limitation)
- Mean reversion logic fails in strong breakout scenarios leading to stop loss hits
- Position sizing via % of equity or cash amount calculates based on close price, may differ from actual fill price
- No partial closing capability - full position exits at TP or SL only
- Strategy does not account for gap openings or overnight holds
## RISK DISCLOSURE:
Trading involves substantial risk of loss. Past performance does not guarantee future results. This strategy is for educational purposes and backtesting only. Mean reversion strategies can experience extended drawdowns during trending markets. Stop losses may not fill at intended levels during extreme volatility or gaps. Thoroughly test on historical data and paper trade before risking real capital. Use appropriate position sizing and never risk more than you can afford to lose. Consider consulting a licensed financial advisor before making trading decisions. Automated trading systems can malfunction - monitor all live positions actively.
## ACKNOWLEDGMENT & CREDITS:
This strategy is built upon the channel detection methodology created by **AlgoAlpha** in the "Smart Money Breakout Channels" indicator. Full credit and appreciation to AlgoAlpha for pioneering the normalized volatility approach to identifying consolidation patterns. The core channel formation logic using normalized price standard deviation is AlgoAlpha's original contribution to the TradingView community.
Enhancements to the original concept include: mean reversion entry logic (vs breakout), immediate touch-based signals, multi-timeframe ATR volatility filtering, flexible position sizing (fixed/percentage/cash), cooldown period filtering, dual TP methods (fixed points vs channel percentage), automated strategy execution with exit management, and real-time position monitoring table.

NDX Ladder → Adjusted to Active Ticker (5s & 10s)This indicator allows you to a grid of NDX levels directly on the NQ! (E-mini NASDAQ 100 Futures) chart, automatically adjusting for the spread between NDX and NQ1!. This is particularly useful for traders who perform technical analysis on SPX but execute trades on NQ1!.
Features:
Renders every 5 and 10 points steps of the NDX in your current chart.
The script adjusts these levels in real-time based on the current spread between NDX and NQ / MNQ
Plots updated horizontal lines that move with the spread

Killzones SMT + IFVG detectorKillzones SMT + IFVG Detector
Summary
This strategy implements a specific intraday workflow inspired by ICT-style concepts.
It combines:
Killzone session levels (recording untouched highs/lows)
SMT divergence between NQ and ES (exclusive sweep logic)
IFVG confirmation (3-bar imbalance + width filter + inversion guard)
and an optional smart exit engine
The components are not simply mashed together: they interact in sequence.
A setup only confirms if all conditions line up (time window → untouched level sweep → divergence → valid IFVG → confirmation candle → risk filter).
Workflow
Killzones & session levels
Tracks highs/lows inside default killzones (19:00–23:00, 01:00–04:00, 08:30–10:00, 11:00–12:00, 12:30–15:00, chart timezone).
Stores untouched levels forward; sweeps trigger candidate signals.
SMT divergence (exclusive sweep)
Bullish SMT : one index sweeps its low while the other remains above its session low.
Bearish SMT : one index sweeps its high while the other remains below its session high.
Detection supports “Sweep (Cross)” or “Exact Tick.”
Session IDs are tracked so once a side has fired, later re-touches can’t re-trigger .
IFVG confirmation
Locks the first valid 3-bar IFVG after SMT.
Confirmation requires a candle close beyond the IFVG boundary in the direction of the close.
IFVGs must meet a minimum width filter (default 1.0 point).
Inversion guard: ignores IFVGs already inverted before SMT.
Optional “re-lock” keeps tracking the latest IFVG until confirmation/expiry.
Smart exit engine
Initial stop from opposite wick (+ buffer).
Fixed TP (default 40 points).
Dynamic stop escalation at progress thresholds (BE → 50% → 80% of target).
Safety gates
Weekend lockout (Fri 16:40 → Sun 18:00).
Same-bar sweep of high & low cancels setups.
Max initial stop filter skips oversized setups.
Optional cooldown bars.
Alerts
SMT Bullish/Bearish : divergence detected this bar.
Confirm Long/Short : IFVG confirmation triggered.
Default Strategy Properties (used in screenshots/backtests)
Initial capital: $25,000
Order size: 1 contract
Commission: $1.25 per contract per side
Slippage: 2 ticks
Backtest window: Jun 16, 2025 – Sep 14, 2025
These settings are intentionally conservative. If you change them, your results will differ.
How to use
Apply on an NQ or ES futures chart (1–5 min).
Choose your killzones and detection mode.
Select confirmation symbol (NQ, ES, or “Sweeper”).
Enable/disable IFVG re-lock.
Review signals and use alerts for automation if desired.
Limitations
Strict filters reduce trade count; extend backtest window for more samples.
Works best on NQ/ES; not validated elsewhere.
Past performance is not indicative of future results.
This is an educational tool ; not financial advice.

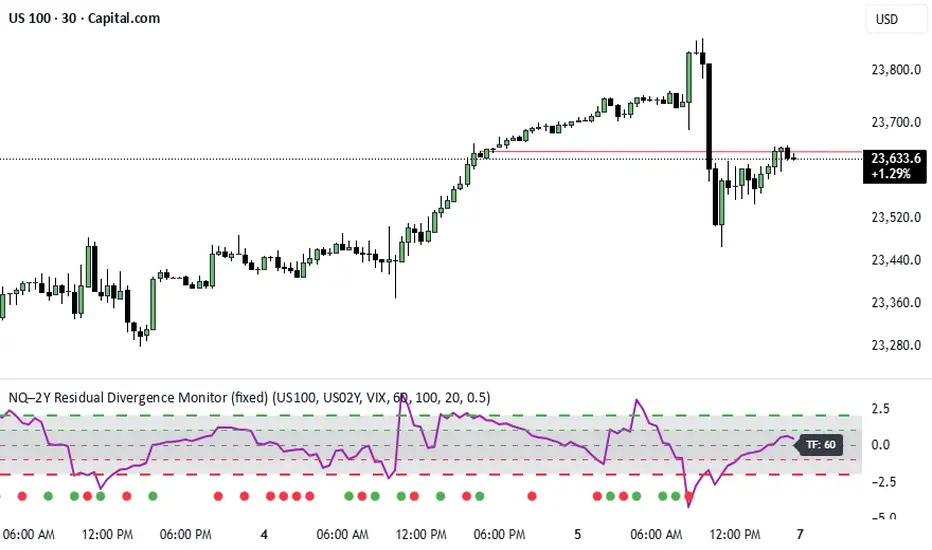
NQ–2Y CorrelationThis indicator tracks the relationship between the Nasdaq futures (NQ) and the US 2-Year Treasury yield (US02Y). The two typically move in opposite directions. This tool highlights when that relationship breaks down, and when moves become stretched to extremes. This can be useful for traders to find inflection points in price representing either overbought or oversold extremes.
Key Features
Residual Z-Score: Shows how far NQ’s returns deviate from what would be expected given moves in the 2Y. Useful for spotting stretched conditions (+/- 2σ bands).
Correlation Tracking: Fast and slow correlations between NQ and inverted 2Y returns. Helps identify regime shifts in the relationship.
Same-Direction Signals: Green dots mark when NQ and 2Y both move strongly in the same direction (rare alignment). Red dots mark strong opposing moves.
Alerts: Triggers available for residual stretches, correlation flips, and significant same-direction or opposite moves.
Usage
Monitor Z-Score to identify when the equity–rates linkage is stretched beyond typical bounds. I typically use this on the H1 or H4 timeframe.
Watch for correlation regime shifts to spot changing market dynamics. Typically price falling into support or moving into resistance as there is a false correlation or a flip.
Same-direction dots help flag unusual synchronized moves between risk assets and yields - these are especially useful for identifying false moves.
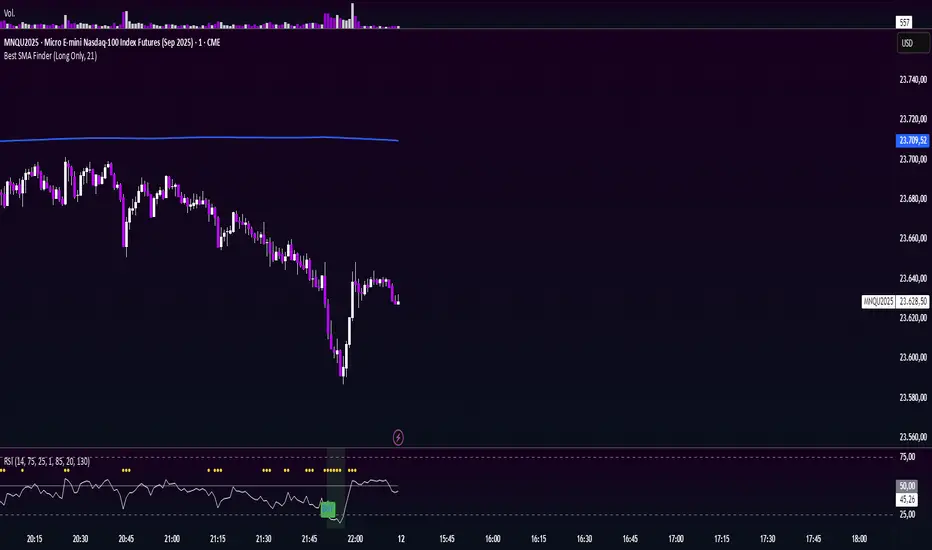
Minimalist RSI - Nasdaq (14) with Volume Filter and AlertsDescription:
This indicator shows the standard RSI (period 14) adapted for Nasdaq, with a clean and minimalist design. It adds visual levels for overbought (75) and oversold (25), plus an optional centerline 50 to better interpret momentum.
It incorporates a high volume visual filter to confirm signals and avoid false entries in low-interest conditions. Buy and sell signals are based on RSI crosses in extreme zones, optionally filtered by volume to improve reliability.
You can enable automatic alerts to receive notifications when important signals occur.
How to use:
Watch the RSI and its position relative to overbought/oversold zones and the 50 line.
Wait for high volume confirmation for greater reliability (you can disable this filter if preferred).
Use buy and sell signals alongside your price action and overall context analysis to make decisions.
Set alerts to not miss opportunities.
Important Notice:
This indicator is a support tool, not a complete strategy. Trading involves risks and no guarantees. Always use risk management and test the indicator on a demo before using it live.
Personal note:
This is my first script and I would love to receive constructive feedback to improve and offer better tools to the community. Thanks for trying it!
Motivational phrase:
“No risk, no reward.”
Parallax Momentum MNQ Strategy# 📈 Parallax Momentum MNQ Strategy
## Overview
The Parallax Momentum MNQ Strategy is a sophisticated support/resistance breakout system specifically designed for Micro Nasdaq futures (MNQ) trading (also works on minis). This strategy combines dynamic level detection with momentum confirmation to identify high-probability entry opportunities while maintaining strict risk management protocols.
## 🎯 Key Features
### Core Strategy Logic
- **Dynamic Support/Resistance Detection**: Automatically identifies key levels using configurable lookback periods
- **Momentum Confirmation**: Volume-based filtering ensures trades align with market momentum
- **ATR-Based Risk Management**: Adaptive stop losses and take profits based on market volatility
- **Dual Entry System**: Both long and short opportunities with limit order execution
### Risk Management
- **ATR-Adaptive Stops**: Stop losses and take profits automatically adjust to market volatility
- **Reward-to-Risk Ratios**: Configurable R:R ratios with default 2:1 minimum
- **Maximum Loss Protection**: Optional daily loss limits to prevent overtrading
- **Session Time Filtering**: Trade only during specified market hours
### Strategy Modes
- **Conservative Mode**: 0.8x risk multiplier for cautious trading
- **Balanced Mode**: Standard 1.0x risk multiplier (default)
- **Aggressive Mode**: 1.2x risk multiplier for active trading
## 📊 Visual Features
### Dashboard Display
- Real-time strategy status and performance metrics
- Current support/resistance levels and ATR values
- Live risk-to-reward ratios for potential trades
- Win rate, profit factor, and drawdown statistics
- Adjustable dashboard size and positioning
### Chart Indicators
- Support and resistance lines with labels
- ATR-based levels (+/-1 ATR and +/-2 ATR)
- Dynamic visual updates as levels change
- Configurable line extensions and styling
## ⚙️ Configuration Options
### Entry Filters
- **Volume Filter**: Optional volume confirmation above SMA
- **Session Time Filter**: 12-hour format time restrictions
- **ATR vs Fixed Stops**: Choose between adaptive or fixed tick-based exits
### Risk Controls
- **ATR Period**: Default 14-period ATR calculation
- **Stop Loss Multiplier**: ATR-based stop distance (default 1.5x)
- **Take Profit Multiplier**: ATR-based target distance (default 1.5x)
- **Secondary Take Profit**: Optional TP2 with position scaling
## 📋 How It Works
### Entry Conditions
**Long Trades**: Triggered when price closes above support buffer but low touches support level, with volume and session confirmation
**Short Trades**: Triggered when price closes below resistance buffer but high touches resistance level, with volume and session confirmation
### Exit Strategy
- **Primary Take Profit**: ATR-based target with 2:1 R:R minimum
- **Stop Loss**: ATR-based protective stop
- **Optional TP2**: Extended target for partial profit taking
- **One Trade at a Time**: No overlapping positions
## 🎛️ Default Settings
- **Lookback Period**: 20 bars for support/resistance detection
- **ATR Period**: 14 bars for volatility calculation
- **Stop Loss**: 1.5x ATR from entry
- **Take Profit**: 1.5x ATR with 2:1 reward-to-risk ratio
- **Session**: 7:30 AM - 2:00 PM (configurable)
## ⚠️ Important Notes
### Risk Disclaimer
- This strategy is for educational and informational purposes only
- Past performance does not guarantee future results
- Always use proper position sizing and risk management
- Test thoroughly on historical data before live trading
- Consider market conditions and volatility when using
### Best Practices
- Backtest on sufficient historical data
- Start with conservative mode for new users
- Monitor performance regularly and adjust parameters as needed
- Use appropriate position sizing for your account
- Consider broker commissions and slippage in live trading
## 🔧 Customization
The strategy offers extensive customization options including:
- Adjustable time sessions with AM/PM format
- Configurable ATR and risk parameters
- Optional maximum daily loss limits
- Dashboard size and position controls
- Visual element toggles and styling
## 📈 Ideal For
- MNQ (Micro Nasdaq) futures traders
- Intraday momentum strategies
- Traders seeking systematic entry/exit rules
- Risk-conscious traders wanting automated stops
- Both beginner and experienced algorithmic traders
---
**Version**: Pine Script v5 Compatible
**Timeframe**: Works on multiple timeframes (test on 1m, 3m, 5m, 15m)
**Market**: Optimized for MNQ but adaptable to other instruments
**Strategy Type**: Trend following with momentum confirmation

NQ Position Size CalculatorNQ Position Size Line Calculator is designed specifically for Nasdaq 100 futures (NQ) and micro futures (MNQ) traders who want to maintain disciplined risk management. This visual tool eliminates the guesswork from position sizing by displaying distance lines and contract calculations directly on your chart.
The indicator creates horizontal lines at 10-tick intervals from your stop loss level, showing you exactly how many contracts to trade at each distance to maintain your predetermined risk amount. Whether you're trading regular NQ contracts or micro MNQ contracts, this calculator ensures you never risk more than intended while providing instant visual feedback for optimal position sizing decisions.
How to Use the Indicator
Step 1: Configure Your Settings
Stop Loss Price: Enter your exact stop loss level (e.g., 20000.00)
Risk Amount ($): Set your maximum dollar risk per trade (e.g., $500)
Contract Type: Choose between:
NQ (Regular): $5 per tick - for larger accounts
MNQ (Micro): $0.50 per tick - for smaller accounts or conservative sizing
Display Options:
Max Lines: Number of distance lines to show (default: 30)
Show Labels: Toggle tick distance and contract count labels
Line Color: Customize the color of distance lines
Label Size: Choose tiny, small, or normal label sizes
Step 2: Read the Visual Display
Once configured, the indicator displays:
Stop Loss Line:
Thick yellow line marking your exact stop loss level
Yellow label showing the stop loss price
Distance Lines:
Dashed red lines at 10-tick intervals above and below your stop loss
Lines appear on both sides for long and short position planning
Labels (if enabled):
Green labels (right side): For long positions above your stop loss
Red labels (left side): For short positions below your stop loss
Format: "20T 5x" means 20 ticks distance, 5 contracts maximum
Step 3: Use the Information Tables
The indicator provides two helpful tables:
Position Size Table (top-right):
Shows common tick distances (10, 20, 40, 80, 160 ticks)
Displays risk per contract at each distance
Contract count for your specified risk amount
Total risk with rounded contract numbers
Settings Table (bottom-right):
Confirms your current risk amount
Shows selected contract type
Displays current settings for quick reference
Step 4: Apply to Your Trading
For Long Positions:
Look at the green labels on the right side of your chart
Find your desired entry level
Read the label to see: distance in ticks and maximum contracts
Example: "30T 8x" = 30 ticks from stop, buy 8 contracts maximum
For Short Positions:
Look at the red labels on the left side of your chart
Find your desired entry level
Read the label for tick distance and contract count
Example: "40T 6x" = 40 ticks from stop, sell 6 contracts maximum
Step 5: Trading Execution
Before Entering a Trade:
Identify your stop loss level and input it into the indicator
Choose your entry point by looking at the distance lines
Note the contract count from the corresponding label
Verify the risk amount matches your trading plan
Execute your trade with the calculated position size
Risk Management Features:
Contract rounding: All position sizes are rounded down (never up) to ensure you don't exceed your risk limit
Zero position filtering: Lines only show where position size is at least 1 contract
Dual-sided display: Plan both long and short opportunities simultaneously

Cumulative Intraday Volume with Long/Short LabelsThis indicator calculates a running total of volume for each trading day, then shows on the price chart when that total crosses levels you choose. Every day at 6:00 PM Eastern Time, the total goes back to zero so it always reflects only the current day’s activity. From that moment on, each time a new candle appears the indicator looks at whether the candle closed higher than it opened or lower. If it closed higher, the candle’s volume is added to the running total; if it closed lower, the same volume amount is subtracted. As a result, the total becomes positive when buyers have dominated so far today and negative when sellers have dominated.
Because futures markets close at 6 PM ET, the running total resets exactly then, mirroring the way most intraday traders think in terms of a single session. Throughout the day, you will see this running total move up or down according to whether more volume is happening on green or red candles. Once the total goes above a number you specify (for example, one hundred thousand contracts), the indicator will place a small “Long” label at that candle on the main price chart to let you know buying pressure has reached that level. Similarly, once the total goes below a negative number you choose (for example, minus one hundred thousand), a “Short” label will appear at that candle to signal that selling pressure has reached your chosen threshold. You can set these threshold numbers to whatever makes sense for your trading style or the market you follow.
Because raw volume alone never turns negative, this design uses candle direction as a sign. Green candles (where the close is higher than the open) add volume, and red candles (where the close is lower than the open) subtract volume. Summing those signed volume values tells you in a single number whether buying or selling has been stronger so far today. That number resets every evening, so it does not carry over any buying or selling from previous sessions.
Once you have this indicator on your chart, you simply watch the “summed volume” line as it moves throughout the day. If it climbs past your long threshold, you know buyers are firmly in control and a long entry might make sense. If it falls past your short threshold, you know sellers are firmly in control and a short entry might make sense. In quieter markets or times of low volume, you might use a smaller threshold so that even modest buying or selling pressure will trigger a label. During very active periods, a larger threshold will prevent too many signals when volume spikes frequently.
This approach is straightforward but can be surprisingly powerful. It does not rely on complex formulas or hidden statistical measures. Instead, it simply adds and subtracts daily volume based on candle color, then alerts you when that total reaches levels you care about. Over several years of historical testing, this formula has shown an ability to highlight moments when intraday sentiment shifts decisively from buyers to sellers or vice versa. Because the indicator resets every day at 6 PM, it always reflects only today’s sentiment and remains easy to interpret without carrying over past data. You can use it on any intraday timeframe, but it works especially well on five-minute or fifteen-minute charts for futures contracts.
If you want a clear gauge of whether buyers or sellers are dominating in real time, and you prefer a rule-based method rather than a complex model, this indicator gives you exactly that. It shows net buying or selling pressure at a glance, resets each session like most intraday traders do, and marks the moments when that pressure crosses the levels you decide are important. By combining a daily reset with signed volume, you get a single number that tells you precisely what the crowd is doing at any given moment, without any of the guesswork or hidden calculations that more complicated indicators often carry.

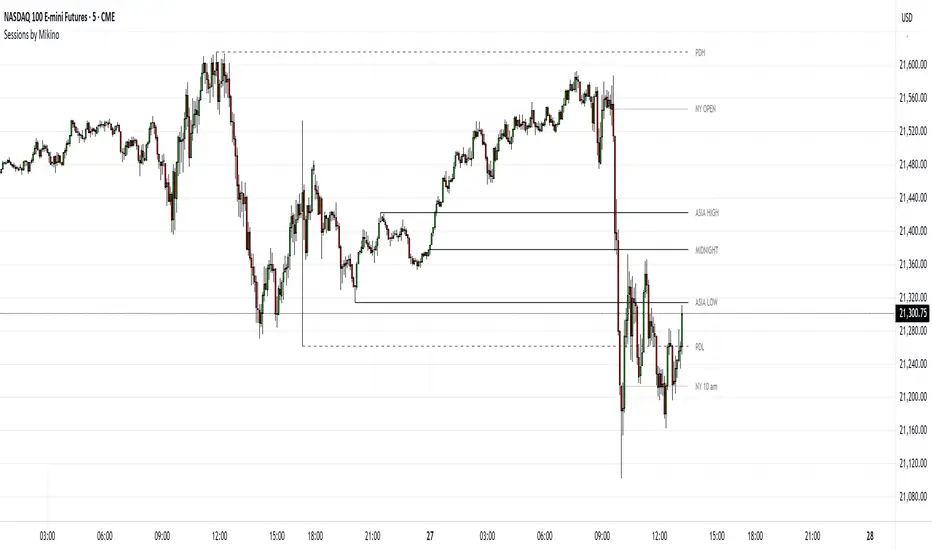
Sessions by MikinoAn indicator that draws lines from major price levels, made especially for NQ, ES and YM futures.
Features
• Show and hide any lines you want and don't need individually
• Customize how far the lines and labels are drawn (in bar length)
• Change label text, color, width and line type of any line drawn
Price levels (in NY time)
• "Show session open" - price at the beginning of the session at 6:00 PM
• "Show Asia open" - price at 8:00 PM
• "Show Asia high" - highest price during Asia session from 8 PM - midnight
• "Show Asia low" - lowest price during Asia session from 8 PM - midnight
• "Show London open" - price at 3:00/4:00 AM (depending on daylight savings time), at the start of London session
• "Show London high" - highest price during London session from 3:00/4:00 AM - 5:00/6:00 AM
• "Show Asia low" - lowest price during London session from 3:00/4:00 AM - 5:00/6:00 AM
• "Show midnight open" - price at midnight
• "Show New York open" - price at 9:30 AM
• "Show New York 10 am" - price at 10:00 AM (10 AM reversal)
• "Show previous day high" - highest price during yesterdays session (from 6:00 PM until 6:00 PM)
• "Show previous day low" - lowest price during yesterdays session (from 6:00 PM until 6:00 PM)
Limitations
All of the lines/labels will be drawn on the chart on up to hourly chart, with the exemption of PDH/PDL that can be drawn on up to 4 hour chart. PDH/PDL tracks each trading day from from 6:00 PM until 6:00 PM, Asia range from 8:00 PM until midnight, London from 3:00 AM until 05:00 AM. The indicator will work on different indices other than NQ, ES and YM, but some of the features might not work correctly due to what is considered a trading day.
MACD & Bollinger Bands Overbought OversoldMACD & Bollinger Bands Reversal Detector
This indicator combines the power of MACD divergence analysis with Bollinger Bands to help traders identify potential reversal points in the market.
Key Features:
MACD Calculation & Divergence:
The script calculates the standard MACD components (MACD line, Signal line, and Histogram) using configurable fast, slow, and signal lengths. It includes a simplified divergence detection mechanism that flags potential bearish divergence—when the price makes a new swing high but the MACD fails to confirm the move. This divergence can serve as an early warning that the bullish momentum is waning.
Bollinger Bands:
A 20-period simple moving average (SMA) is used as the basis, with upper and lower bands drawn at 2 standard deviations. These bands help visualize overbought and oversold conditions. For example, a close at or above the upper band suggests the market may be overextended (overbought), while a close at or below the lower band may indicate oversold conditions.
Visual Alerts:
The indicator plots the Bollinger Bands on the chart along with labels marking overbought and oversold conditions. Additionally, it marks potential bearish divergence with a downward triangle, providing a quick visual cue to traders.
Usage Suggestions:
Confluence with Other Signals:
Use the divergence signals and Bollinger Band conditions as filters. For example, even if another indicator suggests a long entry, you might avoid it if the price is overbought or if MACD divergence warns of weakening momentum.
Customization:
All key parameters, such as the MACD lengths, Bollinger Band period, and multiplier, are fully configurable. This flexibility allows you to adjust the indicator to suit different markets or trading styles.
Disclaimer:
This script is provided for educational purposes only. Always perform your own analysis and backtesting before trading with live capital.

QQQ and SPY Price Levels [MW]Introduction:
Don’t let SPY and QQQ resistance levels hurt your futures trading anymore. The QQQ and SPY Price Levels indicator automagically provides easily accessible QQQ price levels for NASDAQ-related charts such as QQQ, /NQ and /MNQ futures, and leveraged ETFs such as TQQQ and SQQQ as well as for SPY price levels for S&P 500-related charts such as SPY, /ES and /MES futures, SPX, and leveraged ETFs such as UPRO and SPXU. If you’ve ever traded futures, or anything QQQ- or SPY-related and wanted to know at what price would the corresponding asset reach a key whole number level of QQQ or SPY, like 400, 440, 445, or even 447.50, this tool is for you. Key 10x, 5x, and even 2.5x multiples of QQQ and SPY can act as support or resistance for other related-assets. Until now, there hasn’t been an indicator that can serve as an easy visual cue to know exactly when that is about to happen across assets.
This indicator is a fork of the original SPY Price Levels indicator, which only considered SPY-related assets.
Settings:
QQQ/SPY 2.5x: Show closest levels above and below that are multiples of 2.5 on QQQ
QQQ/SPY 5x: Show closest levels above and below that are multiples of 5 on QQQ
QQQ/SPY 10x: Show closest levels above and below that are multiples of 10 on QQQ
Show QQQ/SPY Price Label: Show the current QQQ/SPY price
Extend lines to the left: Extend label lines for each price level to the beginning of the chart
Calculations:
This indicator defines the ratio between the price of QQQ/SPY and another NASDAQ/S&P-related asset and uses that multiplier once the user-defined price increments are defined. For example, if /MNQ is at 19000 and QQQ is at 465, then the ratio would be 40.8.
The incremental QQQ levels that are above and below the QQQ price are calculated using the following equations:
qqqLevelUp = _multiplier * math.ceil(_qqqClose / _multiplier)
qqqLevelDown = _multiplier * math.floor(_qqqClose / _multiplier)
The conversion ratio is then multiplied by that amount to get the final estimated corresponding price using the calculation:
levelUp := _conversion * qqqLevelUp
levelDown := _conversion * qqqLevelDown
For leveraged assets, the conversion must be used on the difference between the current QQQ price and the incremental upper and lower levels.
For example, the calculation for the next level up looks like the following:
levelUpDelta := math.abs(_qqqClose - qqqLevelUp)
levelUp := close + _conversion * (levelUpDelta * _leverage)
This logic is identical for SPY-related assets.
How to Use:
The QQQ and SPY Price Levels indicator aims to be as unobtrusive as possible. The default view shows 3 labels and 2 lines that are all aligned to the right of the main chart, so that it interferes as little as possible with any other indicators. It can be added to any /NQ or /MNQ futures chart, SQQQ, TQQQ, and, of course, QQQ as well as any /ES /MES futures chart, SPXU, UPRO, SPX, and of course SPY. The most immediate price levels for each multiplier appears above and below the current price along with the price of QQQ/SPY.
For example, MNQU2024 is currently at 19594. By looking at the indicator the next QQQ increment below is at 475, or 19556 on the MNQU2024 chart. This potential support is marked with a green label that shows both prices. The next increment above is at QQQ 477.50, or 19659 on the MESU2024 chart. And the QQQ price itself, is also shown (and can be removed) at 475.92.
QQQ and SPY price increments of 2.5, 5, and 10 tend to consistently act at the very least as emotional support and resistance levels. Weak, or weakening volume and/or momentum when these levels are hit can trigger a strong rejection, and can sometimes precipitate lengthy consolidation periods at those levels. Watching an NASDAQ- and S&P 500-related asset come to a halt, fall off a cliff, or react in some other unintuitive way could very well be the result of a QQQ/SPY level being reached. Even though many of us know that this relationship exists, it’s easy to forget. So, this indicator helps to ensure that its users keep that relationship front and center.
By extending the lines into the past on QQQ/SPY and their related assets, you can see what reactions happened at these key levels.
Other Usage Notes and Limitations:
The calculations used only provide an estimated relationship or a close approximation, and are not exact.
It's important for traders to be aware of the limitations of any indicator and to use them as part of a broader, well-rounded trading strategy that includes risk management, fundamental analysis, and other tools that can help with reducing false signals, determining trend direction, and providing additional confirmation for a trade decision. Diversifying strategies and not relying solely on one type of indicator or analysis can help mitigate some of these risks.

Bull Flag DetectionThe FuturesGod bull flag indicator aims to identify the occurrence of bull flags.
Bull flags are a popular trading pattern that allows users to gauge long entries into a given market. Flags consist of a pole that is followed by either a downward or sideways consolidation period.
This script can be used on any market but was intended for futures (NQ, ES) trading on the intraday timeframe.
The script does the following:
1. Identifies the occurrence of a flag pole. This is based on a lookback period and percentage threshold decided by the user.
2. Marks the consolidation area after the pole occurrence using swing highs and swing lows.
3. Visually the above is represented by a shaded green area.
4. When a pole is detected, it is marked by a downward off-white triangle. Note that if the percentage threshold is reached several times on the same upward climb, the script will continue to identify points where the threshold for pole detection is met.
5. Also visualized are the 20, 50 and 200 period exponential moving averages. The area between the 20 and 50 EMAs are shaded to provide traders a visual of a possible support area.

High/Low of week: Stats & Day of Week tendencies// Purpose:
-To show High of Week (HoW) day and Low of week (LoW) day frequencies/percentages for an asset.
-To further analyze Day of Week (DoW) tendencies based on averaged data from all various custom weeks. Giving a more reliable measure of DoW tendencies ('Meta Averages').
-To backtest day-of-week tendencies: across all asset history or across custom user input periods (i.e. consolidation vs trending periods).
-Education: to see how how data from a 'hard-defined-week' may be misleading when seeking statistical evidence of DoW tendencies.
// Notes & Tips:
-Only designed for use on DAILY timeframe.
-Verification table is to make sure HoW / LoW DAY (referencing previous finished week) is printing correctly and therefore the stats table is populating correctly.
-Generally, leaving Timezone input set to "America/New_York" is best, regardless of your asset or your chart timezone. But if misaligned by 1 day =>> tweak this timezone input to correct
-If you want to use manual backtesting period (e.g. for testing consolidation periods vs trending periods): toggle these settings on, then click the indicator display line three dots >> 'Reset Points' to quickly set start & end dates.
// On custom week start days:
-For assets like BTC which trade 7 days a week, this is quite simple. Pick custom start day, use verification table to check all is well. See the start week day & time in said verification table.
-For traditional assets like S&P which trade only 5 days a week and suffer from occasional Holidays, this is a bit more complicated. If the custom start day input is a bank holiday, its custom 'week' will be discounted from the data set. E.g.1: if you choose 'use custom start day' and set it to Monday, then bank holiday Monday weeks will be discounted from the data set. E.g.2: If you choose 'use custom start day' and set it to Thursday, then the Holiday Thursday custom week (e.g Thanksgiving Thursday >> following Weds) would be discounted from the data set.
// On 'Meta Averages':
-The idea is to try and mitigate out the 'continuation bias' that comes from having a fixed week start/end time: i.e. sometimes a market is trending through the week start/end time, so the start/end day stats are over-weighted if one is trying to tease out typical weekly profile tendencies or typical DoW tendencies. You'll notice this if you compare the stats with various custom start days ('bookend' start/end days are always more heavily weighted). I wanted to try to mitigate out this 'bias' by cycling through all the possible new week start/end days and taking an average of the results. i.e. on BTC/USD the 'meta average' for Tuesday would be the average of the Tuesday HoW frequencies from the set of all 7 possible custom weeks(Mon-Sun, Tues-Mon, Weds-Tues, etc etc).
// User Inputs:
~Week Start:
-use custom week start day (default toggled OFF); Choose custom week start day
-show Meta Averages (default toggled ON)
~Verification Table:
-show table, show new week lines, number of new week lines to show
-table formatting options (position, color, size)
-timezone (only for tweaking if printed DoW is misaligned by 1 day)
~Statistics Table:
-show table, table formatting options (position, color, size)
~Manual Backtesting:
-Use start date (default toggled OFF), choose start date, choose vline color
-Use end date (defautl toggled OFF), choose end date, choose vline color
// Demo charts:
NQ1! (Nasdaq), Full History, Traditional week (Mon>>Friday) stats. And Meta Averages. Annotations in purple:
NQ1! (Nasdaq), Full History, Custom week (custom start day = Wednesday). And Meta Averages. Annotations in purple:

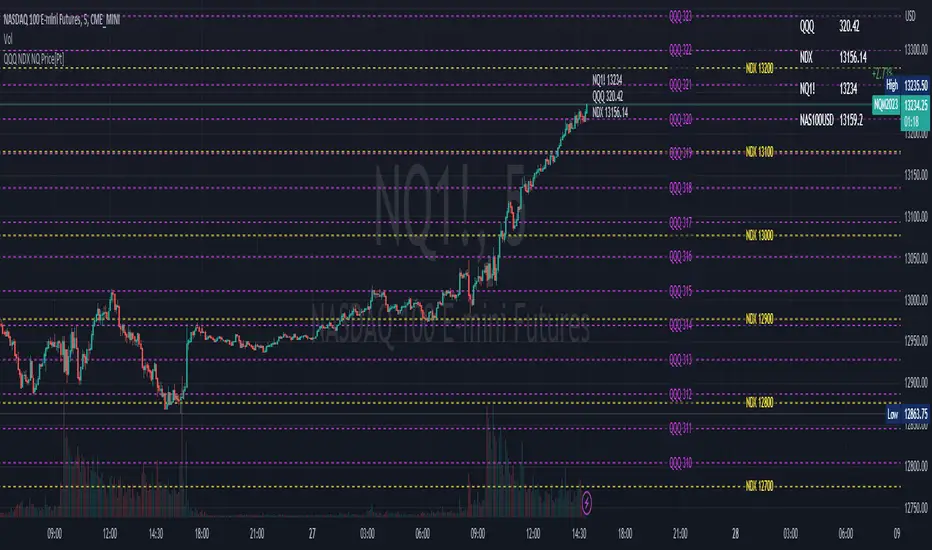
QQQ NDX NQ Price Converter [Pt]A must have tool for QQQ NDX NQ traders~!!!
Description
The QQQ NDX NQ Price Converter is a powerful and easy-to-use tool that allows traders to view corresponding price levels for linked instruments in real-time. This includes QQQ, NDX, NQ, and NAS100USD. Although these instruments often move in sync, differences in price movements, volume, and trading hours can create unique key levels and support/resistance areas for each. By mapping these levels on the same chart, traders can more easily spot trading opportunities and improve their chances of success.
Customizable features
- multiplier from the closest whole number price level
- line color
- line style
- label position / size
- # of levels to display
- toggle current price display table
Convert ETF to Futures/IndexThis indicator is used to automatically map an ETF's VWAP and 10 levels above and below the strike of your choice, to the futures or index instrument currently being viewed/traded. This works very well when using both SPY to ES/MES/SPX or QQQ to NQ/MNQ/NDX to plot the ETF strikes and can lead to some incredible trades, especially when trading level to level. Since SPY, QQQ, IWM, and DIA have the same price action as their futures iteration, there seems to be a direct correlation between their levels and VWAP . This indicator is made to easily map these key levels to the appropriate futures instrument. If you have a way to measure GEX centered around a certain level, I recommend color coding the lines to help indicate whether the level will have strong positive or negative gamma hedging associated with it.

SPY to ES or QQQ to NQThis indicator is used to automatically map SPY VWAP and 10 levels of your choice to ES / MES or map QQQ VWAP and 10 levels of your choice to NQ / MNQ . Since SPY and QQQ have the same price action as their futures iteration, there seems to a direct correlation between their levels and VWAP. This indicator is made to easily map the key levels of your choice to the appropriate futures instrument.

US Indices Cash Initial BalanceThis indicator plots the Cash Initial Balance for the ES, YM, NQ.
The Cash Initial Balance for US indices is the high & low from 9:30-10:30 ET, the first hour after the NYSE open.
