RSI with KAMA and Custom Buy/Sell SignalsUses Kaufman MA on the RSI to generate signals when crossing user thresholdsPine Script®指标由Directlinejet提供8
EMA/SMA Zones 9, 21, 30, 50, 100, 200 + othersMeant for swing trading on the daily chart, feel free to copy and remove/add sections as you wish (Used chatGPT for a lot of it). Pine Script®指标由Drabz7提供49
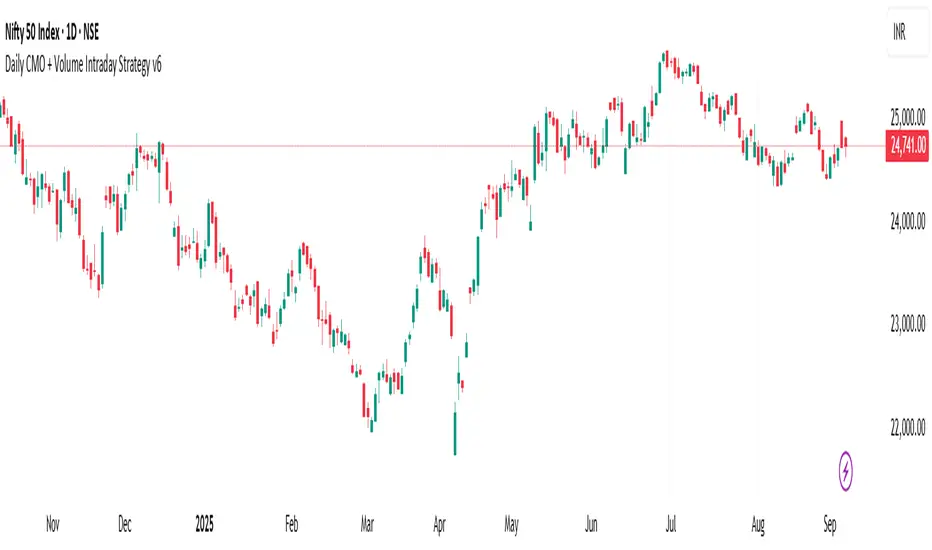
Daily CMO + Volume Intraday Strategy v6 by Subirrmomentum strategy. buy on next hourly candle after signal. target 5%, sl 1% Pine Script®策略由madinamiller628提供4
TRAPPER TRENDLINES — RSIBuilds dynamic RSI trendlines by connecting the two most recent confirmed RSI swing points (highs→highs for resistance, lows→lows for support). Includes optional channel shading for the 30–70 zone, an RSI moving average, clean break alerts, and simple bullish/bearish divergence alerts versus price. How it works RSI pivots: A point on RSI is a swing high/low only if it is the most extreme value compared with a set number of bars on the left and the right (the Pivot Lookback). RSI trendlines: Resistance connects the last two confirmed RSI swing highs. Support connects the last two confirmed RSI swing lows. Lines can be Full Extend (update into the future) or Pivot Only. Channel block: Optional fill of the 30–70 range for fast visual context. Alerts: Breaks of RSI support/resistance trendlines. Basic bullish/bearish RSI divergences versus price pivots. Inputs RSI RSI Length: Default 14 (standard). Pivot Lookback: Bars to the left/right required to confirm an RSI swing. Overbought / Oversold: 70 / 30 by default. Line Extension: Full Extend or Pivot Only. Visuals Show RSI Moving Average / Signal Length: Optional smoothing line on RSI. RSI/Signal colors: Customize plot colors. Show 30–70 Channel Block: Toggle the middle-zone fill. Tint pane background when RSI in channel: Optional subtle background when RSI is between OB/OS. Divergences & Alerts Enable RSI TL Break Alerts: Alert conditions for RSI line breaks. Enable Divergence Alerts: Bullish/Bearish divergence alerts versus price. Pairing with price for confluence/divergence For accurate confluence and clearer divergences, align this RSI tool with your price trendline tool (for example, TRAPPER TRENDLINES — PRICE): Set RSI Pivot Lookback equal to the Pivot Left/Right size used on price. Example: Price uses Pivot Left = 50 and Pivot Right = 50 → set RSI Pivot Lookback = 50. Keep RSI Length = 14 and OB/OS = 70/30 unless you have a specific edge. Interpretation: Confluence: Price reacts at its trendline while RSI reacts at its own line in the same direction. Divergence: Price makes a higher high while RSI makes a lower high (bearish), or price makes a lower low while RSI makes a higher low (bullish), using matched pivot windows. Suggested settings Higher timeframes (4H / 1D / 1W): Pivot Lookback = 50; optional RSI MA length 14; channel block ON. Intraday (15m / 30m / 1H): Pivot Lookback = 30; optional RSI MA length 14. Always mirror your price pivot size to this RSI Pivot Lookback for consistent swings. Reading the signals RSI trendline touch/hold: Momentum reacting at structure; look for confluence with price levels. RSI Trendline Break Up / Down: Momentum shift; consider price structure and retests. Bullish/Bearish Divergence: Confirm only when pivots are matched and the new swing is confirmed. Notes & limitations Pivots require future bars to confirm by design; trendlines update as new swings confirm. Divergence logic compares RSI pivots to price pivots with the same lookback; mismatched windows can produce false positives. No strategy entries/exits or performance claims are provided. This is an analytical tool. Alerts (titles/messages) RSI: Trendline Break Up — “RSI broke falling resistance line.” RSI: Trendline Break Down — “RSI broke rising support line.” RSI: Bullish Divergence — “Bullish RSI divergence confirmed.” RSI: Bearish Divergence — “Bearish RSI divergence confirmed.” Quick start Add the indicator to a separate pane. Set Pivot Lookback to match your price tool’s pivot size (e.g., 50). Optionally toggle the RSI MA and Channel Block for clarity. Enable alerts if you want notifications on RSI line breaks and divergences. Use with TRAPPER TRENDLINES — PRICE or any price-based trendline tool for confluence/divergence analysis. Compliance This script is for educational purposes only and does not constitute financial advice. Trading involves risk. Past performance does not guarantee future results. No performance claims are made.Pine Script®指标由RAMS-offthecharts提供2287
Simplified Market ForecastSimplified Market Forecast Indicator This indicator pairs nicely with the Contrarian 100 MA and can be located here: Overview The "Simplified Market Forecast" (SMF) indicator is a streamlined technical analysis tool designed for traders to identify potential buy and sell opportunities based on a momentum-based oscillator. By analyzing price movements relative to a defined lookback period, SMF generates clear buy and sell signals when the oscillator crosses customizable threshold levels. This indicator is versatile, suitable for various markets (e.g., forex, stocks, cryptocurrencies), and optimized for daily timeframes, though it can be adapted to other timeframes with proper testing. Its intuitive design and visual cues make it accessible for both novice and experienced traders. How It Works The SMF indicator calculates a momentum oscillator based on the price’s position within a specified range over a user-defined lookback period. It then smooths this value to reduce noise and plots the result as a line in a separate lower pane. Buy and sell signals are generated when the smoothed oscillator crosses above a user-defined buy level or below a user-defined sell level, respectively. These signals are visualized as triangles either on the main chart or in the lower pane, with a table displaying the current ticker and oscillator value for quick reference. Key Components Momentum Oscillator: The indicator measures the price’s position relative to the highest high and lowest low over a specified period, normalized to a 0–100 scale. Signal Generation: Buy signals occur when the oscillator crosses above the buy level (default: 15), indicating potential oversold conditions. Sell signals occur when the oscillator crosses below the sell level (default: 85), suggesting potential overbought conditions. Visual Aids: The indicator includes customizable horizontal lines for buy and sell levels, shaded zones for clarity, and a table showing the ticker and current oscillator value. Mathematical Concepts Oscillator Calculation: The indicator uses the following formula to compute the raw oscillator value: c1I = close - lowest(low, medLen) c2I = highest(high, medLen) - lowest(low, medLen) fastK_I = (c1I / c2I) * 100 The result is smoothed using a 5-period Simple Moving Average (SMA) to produce the final oscillator value (inter). Signal Logic: A buy signal is triggered when the smoothed oscillator crosses above the buy level (ta.crossover(inter, buyLevel)). A sell signal is triggered when the smoothed oscillator crosses below the sell level (ta.crossunder(inter, sellLevel)). Entry and Exit Rules Buy Signal (Blue Triangle): Triggered when the oscillator crosses above the buy level (default: 15), indicating a potential oversold condition and a buying opportunity. The signal appears as a blue triangle either below the price bar (if plotted on the main chart) or at the bottom of the lower pane. Sell Signal (White Triangle): Triggered when the oscillator crosses below the sell level (default: 85), indicating a potential overbought condition and a selling opportunity. The signal appears as a white triangle either above the price bar (if plotted on the main chart) or at the top of the lower pane. Exit Rules: Traders can exit positions when an opposite signal occurs (e.g., exit a buy on a sell signal) or based on additional technical analysis tools (e.g., support/resistance, trendlines). Always apply proper risk management. Recommended Usage The SMF indicator is optimized for the daily timeframe but can be adapted to other timeframes (e.g., 1H, 4H) with careful testing. It performs best in markets with clear momentum shifts, such as trending or range-bound conditions. Traders should: Backtest the indicator on their chosen asset and timeframe to validate signal reliability. Combine with other indicators (e.g., moving averages, support/resistance) or price action for confirmation. Adjust the lookback period and buy/sell levels to suit market volatility and trading style. Customization Options Intermediate Length: Adjust the lookback period for the oscillator calculation (default: 31 bars). Buy/Sell Levels: Customize the threshold levels for buy (default: 15) and sell (default: 85) signals. Colors: Modify the colors of the oscillator line, buy/sell signals, and threshold lines. Signal Display: Toggle whether signals appear on the main chart or in the lower pane. Visual Aids: The indicator includes dotted horizontal lines at the buy (green) and sell (red) levels, with shaded zones between 0–buy level (green) and sell level–100 (red) for clarity. Ticker Table: A table in the top-right corner displays the current ticker and oscillator value (in percentage), with customizable colors. Why Use This Indicator? The "Simplified Market Forecast" indicator provides a straightforward, momentum-based approach to identifying potential reversals in overbought or oversold markets. Its clear signals, customizable settings, and visual aids make it easy to integrate into various trading strategies. Whether you’re a swing trader or a day trader, SMF offers a reliable tool to enhance decision-making and improve market timing. Tips for Users Test the indicator thoroughly on your chosen asset and timeframe to optimize settings. Use in conjunction with other technical tools for stronger trade confirmation. Adjust the buy and sell levels based on market conditions (e.g., lower levels for less volatile markets). Monitor the ticker table for real-time oscillator values to gauge market momentum. Happy trading with the Simplified Market Forecast indicator!Pine Script®指标由chuckaschultz提供49
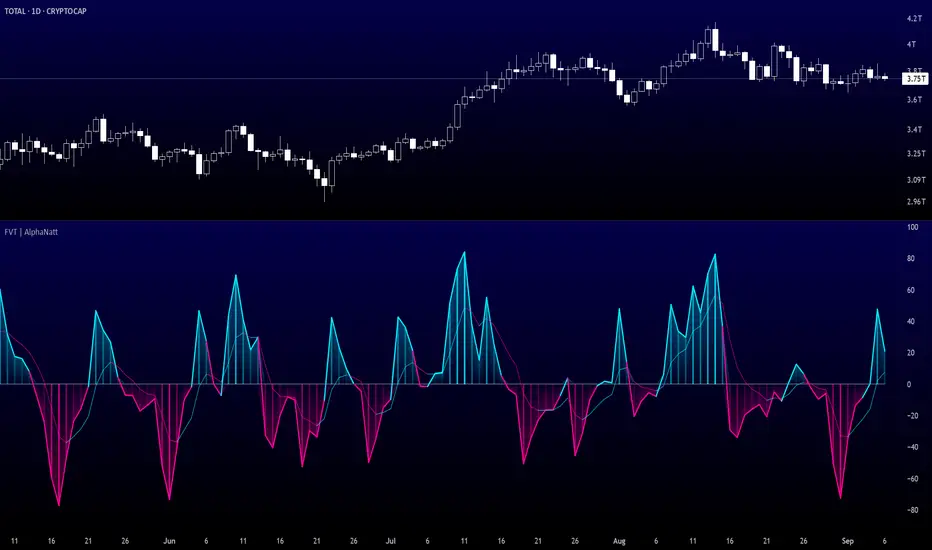
Fisher Volume Transform | AlphaNattFisher Volume Transform | AlphaNatt A powerful oscillator that applies the Fisher Transform - converting price into a Gaussian normal distribution - while incorporating volume weighting to identify high-probability reversal points with institutional participation. "The Fisher Transform reveals what statistics professors have known for decades: when you transform market data into a normal distribution, turning points become crystal clear." ━━━━━━━━━━━━━━━━━━━━━━━━━━━━━━━━━━━━━━━━ 🎲 THE MATHEMATICS Fisher Transform Formula: The Fisher Transform converts any bounded dataset into a Gaussian distribution: y = 0.5 × ln((1 + x) / (1 - x)) Where x is normalized price (-1 to 1 range) Why This Matters: Market extremes become statistically identifiable Turning points are amplified and clarified Removes the skew from price distributions Creates nearly instantaneous signals at reversals Volume Integration: Unlike standard Fisher Transform, this version weights price by relative volume: High volume moves get more weight Low volume moves get filtered out Identifies institutional participation Reduces false signals from retail chop ━━━━━━━━━━━━━━━━━━━━━━━━━━━━━━━━━━━━━━━━ 💎 KEY ADVANTAGES Statistical Edge: Transforms price into normal distribution where extremes are mathematically defined Volume Confirmation: Only signals with volume support Early Reversal Detection: Fisher Transform amplifies turning points Clean Signals: Gaussian distribution reduces noise No Lag: Mathematical transformation, not averaging ━━━━━━━━━━━━━━━━━━━━━━━━━━━━━━━━━━━━━━━━ ⚙️ SETTINGS OPTIMIZATION Fisher Period (5-30): 5-9: Very sensitive, many signals 10: Default - balanced sensitivity 15-20: Moderate smoothing 25-30: Major reversals only Volume Weight (0.1-1.0): 0.1-0.3: Minimal volume influence 0.5-0.7: Balanced price/volume 0.7: Default - strong volume weight 0.8-1.0: Volume dominant ━━━━━━━━━━━━━━━━━━━━━━━━━━━━━━━━━━━━━━━━ 📊 TRADING SIGNALS Primary Signals: Zero Cross Up: Bullish momentum shift Zero Cross Down: Bearish momentum shift Signal Line Cross: Early reversal warning Extreme Readings (±75): Potential reversal zones Visual Interpretation: Cyan zones: Bullish momentum Magenta zones: Bearish momentum Gradient intensity: Strength of move Histogram: Raw momentum power ━━━━━━━━━━━━━━━━━━━━━━━━━━━━━━━━━━━━━━━━ 🎯 OPTIMAL USAGE Best Market Conditions: Range-bound markets (reversals clear) High volume periods Major support/resistance levels Divergence hunting Trading Strategies: 1. Extreme Reversal: Enter when oscillator exceeds ±75 and reverses 2. Zero Line Momentum: Trade crosses of zero line with volume confirmation 3. Signal Line Strategy: Early entry on signal line crosses 4. Divergence Trading: Price makes new high/low but Fisher doesn't ━━━━━━━━━━━━━━━━━━━━━━━━━━━━━━━━━━━━━━━━ Developed by AlphaNatt | Quantitative Trading Systems Version: 1.0 Classification: Statistical Transform Oscillator Not financial advice. Always DYOR.Pine Script®指标由AlphaNatt提供199
Supertrend [TradingConToto]Supertrend — ADX/DI + EMA Gap + Breakout (with Mobile UI) What makes it original Supertrend combines trend strength (ADX/DI), multi-timeframe bias (EMA63 and EMA 200D equivalent), a structural filter based on the distance between EMA2400 and EMA4800 expressed in ATR units, and a momentum confirmation through a previous high breakout. This is not a random mashup — it’s a sequence of filters designed to reduce trades in ranging markets and prioritize mature trends: Direction: +DI > -DI (trend led by buyers). Strength: ADX > mean(ADX) (avoids weak, choppy phases). Short-term bias: Close > EMA63. Long-term bias: Close > EMA4800 ≈ EMA200 daily on H1. Momentum: Close > High (immediate breakout). Structure: (EMA2400 − EMA4800) > k·ATR (ensures separation in ATR units, filters out flat phases). Entries & exits Entry: when all six conditions are met and no open position exists. Exit: if +DI < -DI or Close < EMA63. Visuals: EMA63 is painted green while in position and red otherwise, with a supertrend-style band; “BUY” labels appear below the green band and “SELL” labels above the red band. UI: includes a compact table (mobile-friendly) showing the state of each condition. Default parameters used in this publication Initial capital: 10,000 Position size: 10% of equity (≤10% per trade is considered sustainable). Commission: 0.01% per side (adjust to your broker/market). Slippage: 1 tick Pyramiding: 0 (only one position at a time) Adjust commission/slippage to match your market. For US equities, commissions are often per share; for spot crypto, 0.10–0.20% total is common. I publish with 0.01% per side as a conservative example to avoid overestimating results. Recommended backtest dataset Timeframe: H1 Multi-cycle window (e.g. 2015–today) Symbols with high liquidity (e.g. NASDAQ-100 large caps, or BTC/ETH spot) to generate 100+ trades. Avoid cherry-picked short windows. Why each filter matters +DI > -DI + ADX > mean: reduce counter-trend trades and weak signals. Close > EMA63 + Close > EMA4800: enforce trend alignment in short and long horizons. Breakout High : requires immediate momentum, avoids early entries. EMA gap in ATR units: blocks flat or compressed structures where EMA200D aligns with price. Limitations The breakout filter may skip healthy pullbacks; the design prioritizes continuation over perfect entry price. No fixed trailing stop/TP; exits depend on trend degradation via DI/EMA63. Results vary with real costs (commissions, slippage, funding). Adjust defaults to your broker. How to use Apply it on a clean chart (no other indicators when publishing). Keep in mind the default parameters above; if you change them, mention it in your notes and use the same values in the Strategy Tester. Ensure your dataset produces 100+ trades for statistical validity.Pine Script®策略由toto_scalper_23提供11266
Savitzky-Golay Hampel Filter | AlphaNattSavitzky-Golay Hampel Filter | AlphaNatt A revolutionary indicator combining NASA's satellite data processing algorithms with robust statistical outlier detection to create the most scientifically advanced trend filter available on TradingView. "This is the same mathematics that processes signals from the Hubble Space Telescope and analyzes data from the Large Hadron Collider - now applied to financial markets." ━━━━━━━━━━━━━━━━━━━━━━━━━━━━━━━━━━━━━━━━ 🚀 SCIENTIFIC PEDIGREE Savitzky-Golay Filter Applications: NASA: Satellite telemetry and space probe data processing CERN: Particle physics data analysis at the LHC Pharmaceutical: Chromatography and spectroscopy analysis Astronomy: Processing signals from radio telescopes Medical: ECG and EEG signal processing Hampel Filter Usage: Aerospace: Cleaning sensor data from aircraft and spacecraft Manufacturing: Quality control in precision engineering Seismology: Earthquake detection and analysis Robotics: Sensor fusion and noise reduction ━━━━━━━━━━━━━━━━━━━━━━━━━━━━━━━━━━━━━━━━ 🧬 THE MATHEMATICS 1. Savitzky-Golay Filter The SG filter performs local polynomial regression on data points: Fits a polynomial of degree n to a sliding window of data Evaluates the polynomial at the center point Preserves higher moments (peaks, valleys) unlike moving averages Maintains derivative information for true momentum analysis Originally published in Analytical Chemistry (1964) Mathematical Properties: Optimal smoothing in the least-squares sense Preserves statistical moments up to polynomial order Exact derivative calculation without additional lag Superior frequency response vs traditional filters 2. Hampel Filter A robust outlier detector based on Median Absolute Deviation (MAD): Identifies outliers using robust statistics Replaces spurious values with polynomial-fitted estimates Resistant to up to 50% contaminated data MAD is 1.4826 times more robust than standard deviation Outlier Detection Formula: |x - median| > k × 1.4826 × MAD Where k is the threshold parameter (typically 3 for 99.7% confidence) ━━━━━━━━━━━━━━━━━━━━━━━━━━━━━━━━━━━━━━━━ 💎 WHY THIS IS SUPERIOR vs Moving Averages: Preserves peaks and valleys (critical for catching tops/bottoms) No lag penalty for smoothness Maintains derivative information Polynomial fitting > simple averaging vs Other Filters: Outlier immunity (Hampel component) Scientifically optimal smoothing Preserves higher-order features Used in billion-dollar research projects Unique Advantages: Feature Preservation: Maintains market structure while smoothing Spike Immunity: Ignores false breakouts and stop hunts Derivative Accuracy: True momentum without additional indicators Scientific Validation: 60+ years of academic research ━━━━━━━━━━━━━━━━━━━━━━━━━━━━━━━━━━━━━━━━ ⚙️ PARAMETER OPTIMIZATION 1. Polynomial Order (2-5) 2 (Quadratic): Maximum smoothing, gentle curves 3 (Cubic): Balanced smoothing and responsiveness (recommended) 4-5 (Higher): More responsive, preserves more features 2. Window Size (7-51) Must be odd number Larger = smoother but more lag Formula: 2×(desired smoothing period) + 1 Default 21 = analyzes 10 bars each side 3. Hampel Threshold (1.0-5.0) 1.0: Aggressive outlier removal (68% confidence) 2.0: Moderate outlier removal (95% confidence) 3.0: Conservative outlier removal (99.7% confidence) (default) 4.0+: Only extreme outliers removed 4. Final Smoothing (1-7) Additional WMA smoothing after filtering 1 = No additional smoothing 3-5 = Recommended for most timeframes 7 = Ultra-smooth for position trading ━━━━━━━━━━━━━━━━━━━━━━━━━━━━━━━━━━━━━━━━ 📊 TRADING STRATEGIES Signal Recognition: Cyan Line: Bullish trend with positive derivative Pink Line: Bearish trend with negative derivative Color Change: Trend reversal with polynomial confirmation 1. Trend Following Strategy Enter when price crosses above cyan filter Exit when filter turns pink Use filter as dynamic stop loss Best in trending markets 2. Mean Reversion Strategy Enter long when price touches filter from below in uptrend Enter short when price touches filter from above in downtrend Exit at opposite band or filter color change Excellent for range-bound markets 3. Derivative Strategy (Advanced) The SG filter preserves derivative information Acceleration = second derivative > 0 Enter on positive first derivative + positive acceleration Exit on negative second derivative (momentum slowing) ━━━━━━━━━━━━━━━━━━━━━━━━━━━━━━━━━━━━━━━━ 📈 PERFORMANCE CHARACTERISTICS Strengths: Outlier Immunity: Ignores stop hunts and flash crashes Feature Preservation: Catches tops/bottoms better than MAs Smooth Output: Reduces whipsaws significantly Scientific Basis: Not curve-fitted or optimized to markets Considerations: Slight lag in extreme volatility (all filters have this) Requires odd window sizes (mathematical requirement) More complex than simple moving averages Best with liquid instruments ━━━━━━━━━━━━━━━━━━━━━━━━━━━━━━━━━━━━━━━━ 🔬 SCIENTIFIC BACKGROUND Savitzky-Golay Publication: "Smoothing and Differentiation of Data by Simplified Least Squares Procedures" - Abraham Savitzky & Marcel Golay - Analytical Chemistry, Vol. 36, No. 8, 1964 Hampel Filter Origin: "Robust Statistics: The Approach Based on Influence Functions" - Frank Hampel et al., 1986 - Princeton University Press These techniques have been validated in thousands of scientific papers and are standard tools in: NASA's Jet Propulsion Laboratory European Space Agency CERN (Large Hadron Collider) MIT Lincoln Laboratory Max Planck Institutes ━━━━━━━━━━━━━━━━━━━━━━━━━━━━━━━━━━━━━━━━ 💡 ADVANCED TIPS News Trading: Lower Hampel threshold before major events to catch spikes Scalping: Use Order=2 for maximum smoothness, Window=11 for responsiveness Position Trading: Increase Window to 31+ for long-term trends Combine with Volume: Strong trends need volume confirmation Multiple Timeframes: Use daily for trend, hourly for entry Watch the Derivative: Filter color changes when first derivative changes sign ━━━━━━━━━━━━━━━━━━━━━━━━━━━━━━━━━━━━━━━━ ⚠️ IMPORTANT NOTICES Not financial advice - educational purposes only Past performance does not guarantee future results Always use proper risk management Test settings on your specific instrument and timeframe No indicator is perfect - part of complete trading system ━━━━━━━━━━━━━━━━━━━━━━━━━━━━━━━━━━━━━━━━ 🏆 CONCLUSION The Savitzky-Golay Hampel Filter represents the pinnacle of scientific signal processing applied to financial markets. By combining polynomial regression with robust outlier detection, traders gain access to the same mathematical tools that: Guide spacecraft to other planets Detect gravitational waves from black holes Analyze particle collisions at near light-speed Process signals from deep space This isn't just another indicator - it's rocket science for trading . "When NASA needs to separate signal from noise in billion-dollar missions, they use these exact algorithms. Now you can too." ━━━━━━━━━━━━━━━━━━━━━━━━━━━━━━━━━━━━━━━━ Developed by AlphaNatt Version: 1.0 Release: 2025 Pine Script: v6 "Where Space Technology Meets Market Analysis" Not financial advice. Always DYORPine Script®指标由AlphaNatt提供33191
Swing Oracle Stock// (\_/) // ( •.•) // (")_(") 📌 Swing Oracle Stock – Professional Cycle & Trend Detection Indicator The Swing Oracle Stock is an advanced market analysis tool designed to highlight price cycles, trend shifts, and key trading zones with precision. It combines trendline dynamics, normalized oscillators, and multi-timeframe confirmation into a single comprehensive indicator. 🔑 Key Features NDOS (Normalized Dynamic Oscillator System): Measures price strength relative to recent highs and lows to detect overbought, neutral, and oversold zones. Dynamic Trendline (EMA8 or SMA231): Flexible source selection for adapting to different trading styles (scalping vs. swing). Multi-Timeframe H1 Confirmation: Adds higher-timeframe validation to improve signal reliability. Automated Buy & Sell Signals: Triggered only on significant crossovers above/below defined levels. Weekly Cycles (7-day M5 projection): Tracks recurring time-based market cycles to anticipate reversal points. Intuitive Visualization: Colored zones (high, low, neutral) for quick market context. Optional background and candlestick coloring for better clarity. Multi-Timeframe Cross Table: Automatically compares SMA50 vs. EMA200 across multiple timeframes (1m → 4h), showing clear status: ⭐️⬆️ UP = bullish trend confirmation 💀⬇️ Drop = bearish trend confirmation 📊 Built-in Statistical Tools Normalized difference between short and long EMA. Projected normalized mean levels plotted directly on the main chart. Dynamic analysis of price distance from SMA50 to capture market “waves.” 🎯 Use Cases Spot trend reversals with multi-timeframe confirmation. Identify powerful breakout and breakdown zones. Time entries and exits based on trend + cycle confluence. Enhance market timing for swing trades, scalps, or long-term positions. ⚡ Swing Oracle Stock brings together cycle detection, oscillator normalization, and multi-timeframe confirmation into one streamlined indicator for traders who want a professional edge.Pine Script®指标由FollowtheWhiteRabbitz提供53
Momentum Index [BigBeluga]The Momentum Index is an innovative indicator designed to measure the momentum of price action by analyzing the distribution of positive and negative momentum values over a defined period. By incorporating delta-based calculations and smoothing techniques, it provides traders with a clear and actionable representation of market momentum dynamics. 🔵 Key Features: Delta-Based Momentum Analysis: Calculates the momentum of price by comparing its current state to its value from a defined number of bars back. Inside a loop, it evaluates whether momentum values are above or below zero, producing a delta value that reflects the net momentum direction and intensity. Double EMA Smoothing: Smooths the raw delta-based momentum values with a double EMA filter, reducing noise and providing a clearer trend signal. tmi(len) => sum = 0.0 sum1 = 0.0 above = 0.0 below = 0.0 src_ = src - src for i = 0 to len sum := sum + (src_ > nz(src_ ) ? 1 : -1) sum1 := sum1 + (sum > 0 ? 1 : -1) sum1 := emaEma(sum1, 10) for i = 1 to len above := above + (sum1 > 0 ? 1 : 0) below := below + (sum1 > 0 ? 0 : 1) Directional Momentum Signals: Generates momentum shift signals and displays them on both the oscillator and the main chart: - △ Aqua Triangles: Represent upward momentum shifts. - ▽ Red Triangles: Represent downward momentum shifts. Dynamic Gradient Display: Highlights momentum zones with gradient fills: - Aqua shades for positive momentum (above zero). - Red shades for negative momentum (below zero). Dashboard Display: A dashboard summarizing the count of momentum values above and below zero for the defined period (Sentiment Length e.g. 100), helping traders assess market sentiment at a glance. 🔵 How It Works: The indicator takes price momentum as its source and evaluates the number of momentum values above and below zero within a defined period. The delta calculation aggregates this information, providing a net representation of the prevailing market momentum. A double EMA filter is applied to the delta values, smoothing the momentum line and enhancing signal clarity. Momentum shifts are highlighted with visual signals on the oscillator and price chart, while the gradient display provides a visual representation of intensity. 🔵 Use Cases: Momentum Tracking: Identify whether market momentum is predominantly bullish or bearish. Signal Confirmation: Use chart-based signals to confirm potential trend reversals or continuation. Analyze Market Strength: Leverage the dashboard to quickly assess the distribution of momentum over the chosen period. Overbought/Oversold Conditions: Utilize gradient zones to detect areas of momentum extremes and possible price exhaustion. Momentum Index offers a refined approach to analyzing momentum dynamics, combining delta-based calculations with smoothing techniques and intuitive visuals, making it an essential tool for traders looking to anticipate market movements effectively.Pine Script®指标由BigBeluga提供已更新 44 1.6 K
Artharjan ADXArtharjan ADX (AADX) by Rrahul Desai @Artharjan 📌 Overview The Artharjan ADX (AADX) is an advanced implementation of the Average Directional Index (ADX) with customizable moving averages, momentum thresholds, and visually intuitive grading of bullish and bearish strength. Unlike the standard ADX indicator that only shows trend strength, AADX adds graded bullish/bearish conditions, alerts, smoothed DI signals, histogram visualizations, and background color fills to help traders quickly interpret market conditions. It is designed for traders who want early detection of trend strength, clean visual cues, and automated alert triggers for both bullish and bearish momentum setups. ⚙️ Key Features 🔹 Customizable Calculations DI Length (default 13) – controls sensitivity of directional indicators. +/- DI Smoothing – smooths DI signals with user-selected MA. Multiple Moving Average Types – SMA, EMA, WMA, RMA, VWMA, ALMA, Hull, SWMA, SMMA, TMA. ADX Smoothing – define how smooth/fast the ADX reacts. 🔹 Flexible Display Toggle between line plots or histogram view. Adjustable plot thickness. Option to plot averages of ADX, +DI, -DI for confirmation. Configurable background fills: ADX above/below momentum threshold. ADX rising/falling color shading. Trend-grade based color intensity. 🔹 Momentum & Thresholds Momentum Level (default 25) → defines “strong trend” zone. Crossover Threshold (default 15) → helps detect early DI crossovers. Color-coded histogram bars for +DI vs -DI difference: Above/below zero. Rising/falling momentum. 🔹 Bullish & Bearish Grading System The indicator assigns grades from 1 to 5 for both bullish and bearish setups, based on DI and ADX conditions: Bullish Grades Grade 1 → Very Weak Bullish Grade 2 → Weak Bullish Grade 3 → Moderate Bullish Grade 4 → Strong Bullish Grade 5 → Very Strong Bullish Bearish Grades Grade 1 → Very Weak Bearish Grade 2 → Weak Bearish Grade 3 → Moderate Bearish Grade 4 → Strong Bearish Grade 5 → Very Strong Bearish Labels are automatically plotted above bars to indicate the active grade. 🔹 Alerts Bullish Alert → when +DI crosses above its average below the threshold OR bullish conditions are met. Bearish Alert → when -DI crosses above its average below the threshold OR bearish conditions are met. These alerts make it possible to automate trading signals for scalping, intraday, and swing trading. 📊 Use Cases Trend Strength Measurement Spot when markets shift from range-bound to trending. Confirm the reliability of breakouts with strong ADX readings. Bullish vs Bearish Control Compare +DI vs -DI strength to gauge trend direction. Identify trend reversals early with DI slope changes. Momentum Confirmation Use ADX rising + DI grades to validate trade entries. Filter false breakouts with weak ADX. Trade Grading System Enter aggressively on Grade 4–5 signals. Stay cautious on Grade 1–2 signals. Automated Alerts & Screening Combine AADX alerts with strategy rules. Build scanners to highlight strong ADX setups across multiple stocks. 🎯 Trader’s Advantage More powerful than standard ADX → Adds slope, grading, alerts, and visualization. Adaptable to any style → Works for intraday scalping, swing trading, and positional analysis. Visual clarity → Color fills, histograms, and labels simplify decision-making. Customizable smoothing → Adjusts to fast or slow markets. ✅ Closing Note The Artharjan ADX (AADX) transforms the traditional ADX into a complete trend and momentum analyzer. It helps traders detect, confirm, and act on directional strength with clarity and confidence. With Thanks, Rrahul Desai @ArtharjanPine Script®指标由rsdesai005提供16
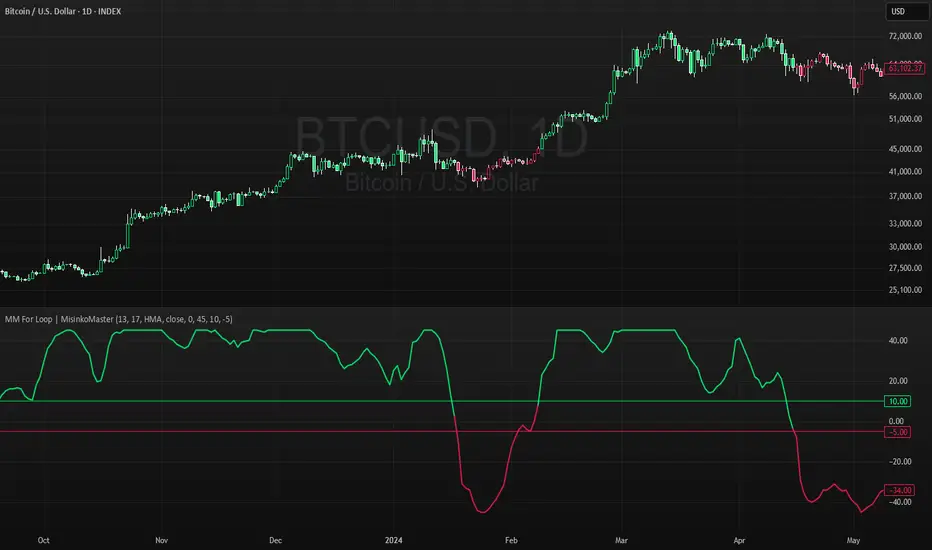
High For Loop | MisinkoMasterThe High For Loop is a new Trend Following tool designed to give traders smooth and fast signals without being too complex, overfit or repainting. It works by finding how many bars have a higher high than the current high, how many have a lower high, and scores it based on that. This provides users with easy and accurate signals, allowing for gaining a large edge in the market. It is pretty simple but you can still play around with it pretty well and improve uppon your strategies. For any backtests using strategies, I left many comments and tried to make it as easy as possible to backtest. Enjoy G´sPine Script®指标由MisinkoMaster提供56
MA-Median For Loop | MisinkoMasterThe MA-Median For Loop is a new Trend Following tool that gives the user smooth yet responsive trend signals, allowing you to see clear and accurate trends by combining the Moving Average & Median in a For Loop concept. How does it work? 1. Select user defined inputs => Adjust it to your liking, everyone can set it to their liking. 2. Calculate the MA and the Median => Simple, but important 3. Calculate the For Loop => For every bar back where the median or ma of that bar is higher than the current median or ma subtract 0.5 from the trend score, and for every bar back where the current median/ma is higher than the previous one add 0.5 to the trend score. This simple yet effective approach enhances speed, decreases noise, and produces accurate signals everyone can utilize to get an edge in the market Enjoy G´sPine Script®指标由MisinkoMaster提供已更新 52
Cardwell RSI by TQ📌 Cardwell RSI – Enhanced Relative Strength Index This indicator is based on Andrew Cardwell’s RSI methodology , extending the classic RSI with tools to better identify bullish/bearish ranges and trend dynamics. In uptrends, RSI tends to hold between 40–80 (Cardwell bullish range). In downtrends, RSI tends to stay between 20–60 (Cardwell bearish range). Key Features : Standard RSI with configurable length & source Fast (9) & Slow (45) RSI Moving Averages (toggleable) Cardwell Core Levels (80 / 60 / 40 / 20) – enabled by default Base Bands (70 / 50 / 30) in dotted style Optional custom levels (up to 3) Alerts for MA crosses and level crosses Data Window metrics: RSI vs Fast/Slow MA differences How to Use : Monitor RSI behavior inside Cardwell’s bullish (40–80) and bearish (20–60) ranges Watch RSI crossovers with Fast (9) and Slow (45) MAs to confirm momentum or trend shifts Use levels and alerts as confluence with your trading strategy Default Settings : RSI Length: 14 MA Type: WMA Fast MA: 9 (hidden by default) Slow MA: 45 (hidden by default) Cardwell Levels (80/60/40/20): ON Base Bands (70/50/30): ON Pine Script®指标由TradeQUO提供已更新 3366
Sequential Pattern Strength [QuantAlgo]🟢 Overview The Sequential Pattern Strength indicator measures the power and sustainability of consecutive price movements by tracking unbroken sequences of up or down closes. It incorporates sequence quality assessment, price extension analysis, and automatic exhaustion detection to help traders identify when strong trends are losing momentum and approaching potential reversal or continuation points. 🟢 How It Works The indicator's key insight lies in its sequential pattern tracking system, where pattern strength is measured by analyzing consecutive price movements and their sustainability: if close > close upSequence := upSequence + 1 downSequence := 0 else if close < close downSequence := downSequence + 1 upSequence := 0 The system calculates sequence quality by measuring how "perfect" the consecutive moves are: perfectMoves = math.max(upSequence, downSequence) totalMoves = math.abs(bar_index - ta.valuewhen(upSequence == 1 or downSequence == 1, bar_index, 0)) sequenceQuality = totalMoves > 0 ? perfectMoves / totalMoves : 1.0 First, it tracks price extension from the sequence starting point: priceExtension = (close - sequenceStartPrice) / sequenceStartPrice * 100 Then, pattern exhaustion is identified when sequences become overextended: isExhausted = math.abs(currentSequence) >= maxSequence or math.abs(priceExtension) > resetThreshold * math.abs(currentSequence) Finally, the pattern strength combines sequence length, quality, and price movement with momentum enhancement: patternStrength = currentSequence * sequenceQuality * (1 + math.abs(priceExtension) / 10) enhancedSignal = patternStrength + momentum * 10 signal = ta.ema(enhancedSignal, smooth) This creates a sequence-based momentum indicator that combines consecutive movement analysis with pattern sustainability assessment, providing traders with both directional signals and exhaustion insights for entry/exit timing. 🟢 Signal Interpretation Positive Values (Above Zero): Sequential pattern strength indicating bullish momentum with consecutive upward price movements and sustained buying pressure = Long/Buy opportunities Negative Values (Below Zero): Sequential pattern strength indicating bearish momentum with consecutive downward price movements and sustained selling pressure = Short/Sell opportunities Zero Line Crosses: Pattern transitions between bullish and bearish regimes, indicating potential trend changes or momentum shifts when sequences break Upper Threshold Zone: Area above maximum sequence threshold (2x maxSequence) indicating extremely strong bullish patterns approaching exhaustion levels Lower Threshold Zone: Area below negative threshold (-2x maxSequence) indicating extremely strong bearish patterns approaching exhaustion levels Pine Script®指标由QuantAlgo提供22404
ADX MTF mura visionOverview ADX MTF — mura vision measures trend strength and visualizes a higher-timeframe (HTF) ADX on any chart. The current-TF ADX is drawn as a line; the HTF ADX is rendered as “step” segments to reflect closed HTF bars without repainting. Optional soft fills highlight the 20–25 (trend forming) and 40–50 (strong trend) zones. How it works ADX (current TF) : Classic Wilder formulation using DI components and RMA smoothing. HTF ADX : Requested via request.security(..., lookahead_off, gaps_off). When a new HTF bar opens, the previous value is frozen as a horizontal segment. The current HTF bar is shown as a live moving segment. This staircase look is expected on lower timeframes. Auto timeframe mapping If “Auto” is selected, the HTF is derived from the chart TF: <30m → 60m, 30–<240m → 240m, 240m–<1D → 1D, 1D → 1W, 1W/2W → 1M, ≥1M → same. Inputs DI Length and ADX Smoothing — core ADX parameters. Higher Time Frame — Auto or a fixed TF. Line colors/widths for current ADX and HTF ADX. Fill zone 20–25 and Fill zone 40–50 — optional light background fills. Number of HTF ADX Bars — limits stored HTF segments to control chart load. Reading the indicator ADX < 20: typically range-bound conditions; trend setups require extra caution. 20–25: trend emergence; breakouts and continuation structures gain validity. 40–50: strong trend; favor continuation and manage with trailing stops. >60 and turning down: possible trend exhaustion or transition toward range. Note: ADX measures strength, not direction. Combine with your directional filter (e.g., price vs. MA, +DI/−DI, structure/levels). Non-repainting behavior HTF values use lookahead_off; closed HTF bars are never revised. The only moving piece is the live segment for the current HTF bar. Best practices Use HTF ADX as a regime filter; time entries with the current-TF ADX rising through your threshold. Pair with ATR-based stops and a MA/structure filter for direction. Consider higher thresholds on highly volatile altcoins. Performance notes The script draws line segments for HTF bars. If your chart becomes heavy, reduce “Number of HTF ADX Bars.” Disclaimer This script is for educational purposes only and does not constitute financial advice. Trading involves risk.Pine Script®指标由charyyevn提供17