EMA & Stochastic SignalsEma 200 and ema 500 + stochastic crossover. Buys when price is above emas and sells when price is below emas.
指标和策略

[ASFX] Free Automatic VWAPsAutomatic VWAP & Key Levels
Overview
This indicator is designed to help traders evaluate VWAP interactions in context, rather than treating every VWAP touch as a trade opportunity. It combines VWAP with a momentum-based directional filter to highlight situations where price interaction with VWAP is supported by broader intraday momentum. This indicator also shows you the initial balance and opening range each day.
Concept and Originality
VWAP is commonly used as an institutional reference level, but VWAP alone does not distinguish between meaningful acceptance/rejection and random intraday chop. This script addresses that limitation by conditioning VWAP interactions with a momentum filter. Signals are only displayed when price location and momentum alignment occur together, allowing traders to focus on higher-quality VWAP reactions instead of monitoring multiple indicators separately.
How It Works
• VWAP is used as the primary price reference level.
• A momentum filter evaluates directional bias and participation.
• Visual signals appear only when price is interacting with VWAP and momentum confirms acceptance or rejection in the same direction.
• No signals are shown during low-momentum or sideways conditions around VWAP.
How to Use
This indicator is best used as a confirmation tool, not as a standalone trading system. It is intended to assist traders in filtering VWAP-based trade ideas by highlighting when conditions are aligned versus when price is simply chopping around VWAP.
Markets and Timeframes
• Designed for index futures such as ES and NQ
• Optimized for intraday trading
• Works best on lower timeframes (1–5 minute charts)
Limitations
• Not predictive
• Not a complete trading strategy
• Does not replace price action analysis, trade management, or risk control
• Signals should be evaluated alongside market structure and context

Pre-Market + Daily + Weekly REGULAR HOURS 📦 Pre-Market + Daily + Weekly RTH Range Boxes
This indicator automatically plots Pre-Market, Daily, and Weekly range boxes based strictly on US Regular Trading Hours (RTH).
What it does:
Pre-Market Box (04:00–09:30)
Captures the full pre-market high and low, then projects the range forward from the RTH open.
Daily RTH Box (09:30–16:00)
Tracks the previous day’s regular session high and low and plots the range starting at 04:00 AM the next day.
Weekly RTH Box (Mon–Fri, 09:30–16:00)
Accumulates the full weekly RTH range and plots it at 04:00 AM on Monday.

VOLD RatioThis indicator calculates the ratio between NYSE Up Volume and Down Volume (USI:UVOL / USI:DVOL).
It helps assess market participation and short-term buying vs. selling pressure.
Higher values indicate dominant buying volume, while lower values suggest increasing selling pressure.
Useful as a breadth and confirmation tool alongside index price action.

New York Sessions High/Low with Liquidity Purge CriteriaDisplays horizontal lines at the highest high and lowest low of the NY AM (09:30–12:00) and NY PM (13:30–16:00) sessions in New York time.
Lines extend forward until price strongly breaks them by a user-defined threshold (N points), at which point they cease extending - liquidity purged.
Option to show only active lines (unpurged liquidity) - toggle to hide old liquidity pools for a cleaner chart.
Customizable colors, line styles, width, lookback days and purge threshold.

TradingSystems_AlphaLib_v6//@version=6
// @description Master Library for Institutional Grade Analysis v1
// @author jmcanovelles
library("TradingSystems_AlphaLib_v6")
// @function Calculates standardized EMA
// @param len Period for the average
export calc_ema(int len) =>
ta.ema(close, len)
// @function Calculates precise ADX and DI
// @param len Calculation period
export calc_adx(int len) =>
= ta.dmi(len, len)

Intraday Sessions Ranges with Time SegmentationSession Ranges indicator overlays customizable range boxes on major trading sessions (e.g. London, Premarket, NY AM and NY PM) using New York time.
Toggle visibility, add evenly spaced vertical segment lines, and highlight key time zones. Perfect for traders marking price action and levels across multiple historical days.

bayaraa first 1221//@version=5
indicator("7-LA White Candle Session", overlay=true)
// ----- Session тохиргоо -----
sess = input.session("0930-1600", "Session") // Хүссэн session цаг
inSession = not na(time(sess)) // Лаа session-д байгаа эсэх
// ----- Лааны өнгө тоолох -----
var int candle_count = 0
if inSession
candle_count += 1
else
candle_count := 0
// ----- Өнгө тохиргоо -----
candle_color = (candle_count <= 7 and inSession) ? color.white : na
// ----- Лааг график дээр зурна -----
plotcandle(open, high, low, close, color=candle_color)

ORB 2R Retest Volume Entry (1m) - v6gJdsfjs kdfg s jdslzi gdsjzg SJFds SJKdls dsjzgfjdkzl GDMKls gndsmzgSfgndmsKF fdnsioGLfs

EMA 21/50/200 Trend Support & EntryIndicator plots EMA 21, EMA 50, and EMA 200 to define trend structure and dynamic support/resistance.
EMA 200: overall trend bias
EMA 21 and EMA 50: pullback support for high probability trend entries.
EMA 21/50 crosses highlight momentum shifts but are not intended as standalone entry signals.

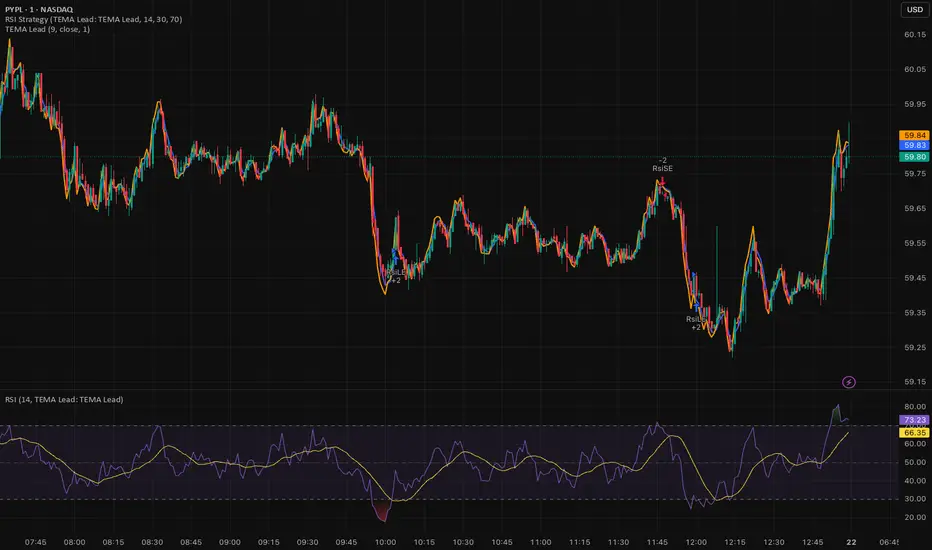
Triple EMA (TEMA) + Slope LeadThis indicator plots a standard Triple EMA (TEMA) and an optional slope-lead version. TEMA is a low-lag moving average built from three EMAs, allowing it to track price more closely than a single EMA. The Lead Strength (k) adds a small forward “push” based on the recent TEMA slope:
TEMA_lead = TEMA + k × (TEMA − TEMA ). Higher k values make the line react earlier but increase sensitivity in chop.
Used as a source for other indicators (RSI, MACD, stochastic, regime filters, etc.), TEMA or TEMA-Lead may improve signal quality by reducing noise, aligning momentum readings with trend direction, and producing earlier, cleaner transitions at turns, often without the excessive lag introduced by heavier smoothing.
CAHOLD / CBLOHDCAHOLD (Close Above Highest Low Day) and CBLOHD (Close Below Lowest High Day)
The logic is based on identifying pullbacks followed by strength in the direction of the trend, making it useful as a trend-continuation entry signal rather than a reversal tool.
⸻
How CAHOLD Works (Bullish)
1. A sequence of red candles forms (a pullback).
2. The first green candle appears.
3. The script identifies the highest high of the prior red-candle sequence (HOLD).
4. A CAHOLD signal triggers when a green candle closes above that HOLD level.
5. A small green arrow is plotted below the candle.
⸻
How CBLOHD Works (Bearish)
1. A sequence of green candles forms (a bounce).
2. The first red candle appears.
3. The script identifies the lowest low of the prior green-candle sequence (LOHD).
4. A CBLOHD signal triggers when a red candle closes below that LOHD level.
5. A small red arrow is plotted above the candle.
⸻
Optional Filters
• EMA / SMA Trend Filter
Only shows CAHOLDs in uptrends and CBLOHDs in downtrends.
• Minimum Pullback Depth
Requires a minimum number of red/green candles before a signal can trigger.
• ATR Breakout Filter
Requires price to break the level by a volatility-adjusted amount.

ATR + Moving AverageThis indicator shows a manually calculated Average True Range (ATR) along with a moving average of the ATR.
The ATR measures current candle volatility.
The ATR Moving Average shows the average candle size over the selected period.
Both can use different smoothing types (RMA, SMA, EMA, WMA) for flexibility.
It’s useful for seeing when price is stretched, volatility is expanding or contracting, and for higher-timeframe mean-reversion analysis.

Hardwaybets Strat Market Checklist Trading## **Hardwaybets TheStrat Market Checklist Engine**
**A Checklist-Driven TheStrat Trading**
---
### **Overview**
This script is an **informational market context and permission framework** designed to help users **organize structural and liquidity information** in a clear, checklist-based format.
It evaluates **price context only** and displays the results in a table.
It does **not** generate trade signals or trading instructions.
---
### **What This Script Does**
The indicator evaluates and displays:
* Nearest prior **Area of Interest (AOI)**
(Previous Day High/Low or Previous Week High/Low)
* Higher-timeframe structural bias (Daily & Weekly)
* Proximity to liquidity
* Liquidity behavior (acceptance vs rejection)
* **Strat pattern classification only** (12 canonical patterns)
* A final **permission state** based on the above conditions
All information is presented as **contextual reference data**, not execution guidance.
---
### **What This Script Does NOT Do**
* ❌ No buy or sell signals
* ❌ No arrows, markers, or execution prompts
* ❌ No entries, exits, stops, or targets
* ❌ No performance metrics or profitability claims
* ❌ No strategy or backtesting logic
The word **“TRADE”** in the dashboard refers to **permission status only**, not a recommendation to trade.
---
### **Dashboard Modes**
* **Full Mode**: displays AOI price and distance (points & ticks)
* **Compact Mode**: minimal checklist view for reduced screen usage
Both modes are **informational only**.
---
### **Pattern Classification**
The script identifies and labels Strat candle pattern **types only**, including:
* Reversal patterns
* Continuation patterns
* Compression patterns
* Expansion patterns
Pattern labels are **descriptive classifications**, not signals or instructions.
---
### **Intended Use**
This script is intended to be used as a **contextual reference tool** alongside a user’s own analysis, rules, or education.
It may be useful for:
* Market structure study
* Liquidity behavior observation
* Pattern classification review
* Educational purposes
---
### **Technical Notes**
* Pine Script® v6
* Uses completed candles only
* No repainting logic
* No future data access
* Table-based UI only
---
### **Disclaimer**
This indicator is provided **for educational and informational purposes only**.
The author does not provide financial advice, trading recommendations, or execution guidance.
All trading decisions remain the sole responsibility of the user.
---
### **Conceptual Attribution**
This script is inspired by publicly available market structure concepts commonly referred to as “The Strat” methodology.
No proprietary or paid content is included.
---
### **Feedback**
Constructive feedback and suggestions are welcome.
Please note that this script is intentionally **non-signaling by design**.


Premarket & PD H/L scannerpremarket scanner for top stock picks
Uses a stock selection of your own choosing that can be adjusted in the script as need be.
Both the premarket low or high is compared and also previous day high or low in order to determine trend and pinpoint which tickers are best suited to trade on a particular day

Replay CountdownDisplays countdown for current bar in Replay mode.
Optionally also displays the current replay time in the exchange timezone.

3 VCT + SMA200//@version=5
indicator("3 VCT + SMA200", overlay=true)
// SMA200
smaLength = 200
sma200 = ta.sma(close, smaLength)
plot(sma200, "SMA200", color=color.orange, linewidth=2)
// Condiciones de velas
isBullish = close > open
isBearish = close < open
// Contador de velas consecutivas
var contraCount = 0
if (close > sma200) // Tendencia alcista → buscamos 3 velas bajistas
if isBearish
contraCount += 1
else
contraCount := 0
else if (close < sma200) // Tendencia bajista → buscamos 3 velas alcistas
if isBullish
contraCount += 1
else
contraCount := 0
// Señal cuando se cumplan 3 consecutivas en contra
signal = (contraCount == 3)
// Mostrar en gráfico
plotshape(signal, title="Señal 3 velas", style=shape.labeldown,
text="", location=location.abovebar,
color=color.red, size=size.tiny, textcolor=color.white)
// Crear condición de alerta
alertcondition(signal, title="3 Velas Contra Tendencia",
message="Se han formado 3 velas en contratendencia respecto a la SMA200.")

Daily SMA 10/20/50/200 (Timeframe Agnostic)This indicator plots the 10, 20, 50, and 200-period Simple Moving Averages calculated on a user-selected base timeframe (default: Daily), then displays them on any chart timeframe (intraday, daily, weekly, monthly). Each SMA has independent controls for visibility, color, and line thickness.

SMA 20/50/100/200Simple Moving Averages indicator plotting the 20, 50, 100, and 200 SMAs based on the **active chart timeframe**. Designed to adapt dynamically as you change timeframes, it helps visualize short-, medium-, and long-term trend structure, momentum shifts, and dynamic support and resistance. Color-coded for clarity with consistent line thickness for clean, readable trend analysis.

MarketMind LITEM🜁rketMind LITE ────────────────────
Essential Market Awareness, Reduced to Its Core
M🜁rketMind LITE is a lightweight market awareness tool designed to display essential situational context .
It provides basic orientation and movement awareness without interpretation, risk framing, diagnostics, or decision guidance.
This script is designed as a standalone awareness layer. It does not evaluate trade quality, issue signals, or influence decision-making.
WHAT IT DOES ────────────────────
M🜁rketMind LITE presents a minimal, static view of current market conditions focused entirely on awareness rather than analysis.
The system displays only essential context, allowing traders to stay oriented without introducing judgment, noise, or implied direction.
The script provides visibility into:
Time-of-day session context
Basic market regime classification (trending, range-bound, mixed)
Short-term momentum direction only (up, down, neutral)
A clean, static HUD display
M🜁rketMind LITE also includes a minimal visual state indicator that reflects recent price responsiveness, intended to be observed over time alongside the trader’s own experience.
The goal is to support awareness without influence .
HOW TO USE IT ────────────────────
M🜁rketMind LITE is not a signal generator.
It is designed to remain visible in the background of any chart, offering quiet orientation while traders rely entirely on their own process for analysis and execution.
Common use cases include:
Maintaining session awareness
Preserving context during focused trading periods
Reducing cognitive load while monitoring markets
M🜁rketMind LITE does not evaluate risk, alignment, or opportunity.
It simply shows what is happening.
DESIGN PHILOSOPHY ────────────────────
M🜁rketMind LITE is intentionally minimal.
It includes only essential awareness elements and excludes all interpretive or evaluative logic:
Situational context only
Directional momentum (up / down / neutral)
No diagnostics, confidence, or conviction framing
No process, risk, or quality assessment
Presentation controls only (HUD on/off, size, position)
Nothing is inferred.
Nothing is suggested.
This script shows market state without interpretation.
WHO IT IS FOR ────────────────────
M🜁rketMind LITE is suited for traders who:
Want passive situational awareness
Prefer minimal on-chart information
Already operate with a defined decision process
It is not designed for:
Analytical or diagnostic use
Risk evaluation or context synthesis
Traders seeking guidance or confirmation
IMPORTANT NOTES ────────────────────
M🜁rketMind LITE does not provide financial advice
No system can predict future price behavior
This tool is designed for awareness only
Used appropriately, M🜁rketMind LITE helps traders stay oriented without interference.

REM Algo - Earnings AlertsNot everyone wants to hold positions through earnings announcements — and if you’re evaluating a strategy, earnings-related gaps can distort performance metrics and make results harder to interpret.
This script helps you manage earnings risk by triggering alerts during an Earnings Blackout window. You can:
get an alert to close positions the day before earnings, and/or
receive a reminder not to open new positions on blackout days prior to the earnings announcement.
Add alerts to the stocks you trade. When a blackout day occurs, the script triggers at the hour and minute you choose in the settings. The Earnings Blackout period covers the day before and the day of the earnings announcement, adjusted for weekends and market holidays.
Use it as a standalone risk-control tool — or alongside your existing strategy — so earnings gaps don’t interfere with your trading rules or your backtest results.

Flux Portfolio Visualizer | GL0WDASHFlux Portfolio Visualizer | GL0WDASH
Flux Portfolio Visualizer lets you simulate and track the performance of a multi-asset portfolio directly on the chart.
Choose up to 10 assets, assign custom allocation weights, and set a start date to generate a real-time equity curve based on historical price data.
The script performs one-time proportional allocation at the start date and then tracks equity forward without rebalancing, giving you a realistic view of how your portfolio would have evolved over time. It also includes a maximum equity drawdown tracker and an optional level line for reference.
Features:
• Allocate to up to 10 assets with custom weight percentages
• Specify initial capital and simulation start date
• Real-time equity curve based on confirmed bars
• Maximum equity drawdown tracking + table display
• Optional horizontal reference line
• Designed for long-horizon allocation experiments
Great for:
• Passive portfolio stress-testing
• Comparing allocation strategies
• Evaluating long-term crypto/asset mixes
• Visualizing risk via max drawdowns
This tool does not execute trades or rebalance—its purpose is pure visualization, giving traders clarity about how portfolios behave under different allocation assumptions.
If you expand or modify the indicator, please credit the original author.
