Custom Horizontal Lines | Trade Symmetry📊 Custom Horizontal Lines
🔍 Overview
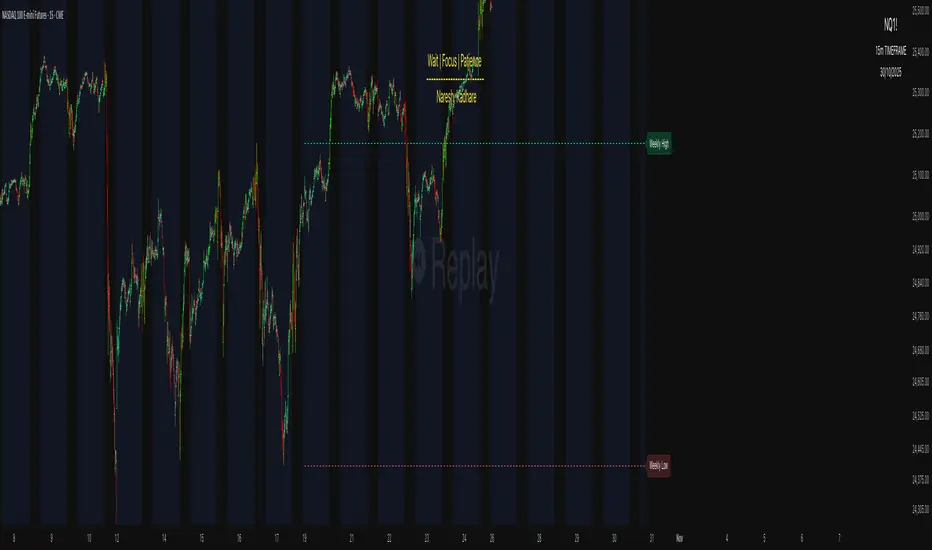
The Custom Horizontal Lines is a precision utility designed for traders who perform manual higher-timeframe analysis and want to preserve their marked price levels directly on the chart.
It doesn’t calculate or detect anything automatically — instead, it acts as your personal level memory, preserving your analyzed zones and reference prices throughout the session.
Ideal for traders who manually mark the High, Low, Open, Close, Mean Thresholds, and Quarter Levels of Order Blocks, Fair Value Gaps, Inversion Fair Value Gaps and Wicks before the trading day begins.
⚙️ Key Features
✅ Manual Level Entry — Input your analyzed price levels (OB, FVG, WICK,etc) directly into the indicator settings.
✅ Preserved Levels — Once entered, your lines stay visible and consistent — even after switching symbols, timeframes, or reloading the chart.
✅ Supports All Level Types — Store any kind of manually defined level: OB highs/lows, FVG boundaries, Wicks, Mean Thresholds, Quarter levels, or custom reference prices.
✅ Clean Visualization — Customize line color, style, and labels for easy visual organization.
✅ Session-Ready Workflow — Built for pre-market preparation — enter your HTF levels once, and trade around them all day.
✅ No Auto Calculations — 100% manual by design — ensuring only your analyzed levels are shown, exactly as you defined them.
💡 How to Use
Open the indicator’s settings and manually enter those price values.
The indicator will plot and preserve those exact levels on your chart.
Switch to your lower timeframe and observe how price reacts around them — without ever needing to redraw.
🎯 Why It’s Useful
Keeps your HTF levels organized and persistent across sessions.
Saves time by avoiding redrawing.
Fits perfectly into ICT / Smart Money trading workflows.
Ensures full manual control and precision over what’s displayed on your chart.
🧩 Ideal For
ICT and Smart Money traders
Institutional-style manual analysts
Traders marking Mean Thresholds, or Quarter Levels of OBs, FVGs, Wicks etc
Anyone who wants a clean, reliable way to preserve their manual analysis
指标和策略

Addikro_V1📌 Description – Trend+Entry+Risk Indicator
This indicator combines statistically proven trading concepts into a complete trading framework:
✅ Trend Filter (EMA200)
All trades follow the higher-timeframe trend. Trend direction is clearly visualized.
✅ Entry Signals (you can choose):
EMA Crossover (EMA50 crossing EMA200) — classic trend-following entry
Breakout of recent highs/lows (20-bar range) — optionally only valid after a pullback to EMA50
✅ ATR-Based Risk Management:
Dynamic Stop Loss (SL) and Take Profit (TP1/TP2) levels using ATR
The last entry is saved — SL/TP lines stay visible on the chart
Optional position size suggestion based on % risk of account
✅ Smart Filters for Higher Accuracy:
RSI filter: e.g., only long if RSI > 50
Volume filter: signal only if volume is above SMA × multiplier
✅ Fixed Chart HUD (Table Overlay):
Displays live information anchored to the chart (does not move with candles)
Shows: Trend direction, entry mode, RSI, ATR, SL/TP multiplier, position size suggestion
Position can be set: top-left / top-right / bottom-left / bottom-right
✅ Signals & Alerts:
Visual arrows on the chart for long/short signals
Custom alert conditions included (works with mobile, email, webhook, bots)
🎯 Why this indicator works
It follows the same logic used by many successful systematic and hedge fund strategies:
Trend direction + statistically solid entries + strict risk management → no repainting, no guessing, no emotion.

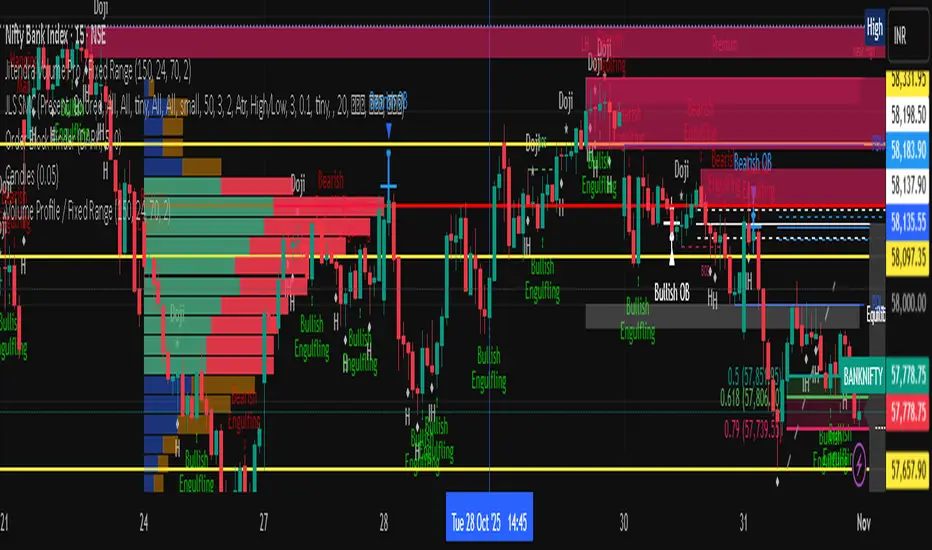
Lord Mathew ATSThe Smart Money Structure & Pattern Analyzer is a complete, all-in-one visual trading system that brings together every essential element of Smart Money Concepts (SMC), ICT methodology, and candlestick psychology into one powerful indicator.
It is designed to help traders instantly understand the market’s structure, liquidity flow, and potential turning points without switching tools or manually marking charts. Whether you trade forex, indices, crypto, or commodities, this indicator automatically identifies where institutional activity, imbalances, and price inefficiencies occur in real time.
With its advanced algorithm, it plots market structure shifts, equal highs and lows, liquidity zones, order blocks, fair value gaps (FVGs), and previous week and day levels (PWO, PWH, PWL, PWC, PDO, PDH, PDL, PDO). It also integrates a deep candlestick recognition engine that detects over ten classic and advanced candle formations including engulfing patterns, dojis, hammers, shooting stars, morning/evening stars, and spinning tops to provide precise confirmation at critical points of interest.
This indicator isn’t just a tool it’s a complete market map that helps traders visualize how institutional order flow and candlestick sentiment interact.
Core Features
📊 Market Structure Detection:
Automatically marks swing highs/lows, Break of Structure (BOS), and Change of Character (CHOCH) in real time.
💧 Liquidity Mapping:
Highlights equal highs/lows and liquidity grabs, showing where price is likely to target before a reversal or continuation.
🧱 Order Block Visualization:
Displays the last bullish or bearish candle before an impulsive displacement, acting as a potential institutional entry zone.
⚡ Fair Value Gap (FVG) Scanner:
Detects and highlights imbalances where price moved too fast, helping you identify high-probability retracement areas.
🕯️ Candlestick Pattern Recognition:
Recognizes key reversal and continuation patterns (engulfing, hammer, shooting star, doji, morning/evening star, etc.) in real time.
📅 Institutional Reference Points:
Plots previous week & day open (PWO, PDO), previous week & day high (PWH, PWH), previous week & day low (PWL, PDL), previous week & day close (PWC, PDC) and optionally previous day levels to help frame bias.
🎨 Customizable Design:
Toggle any feature, change colors, and set alerts when multiple Smart Money signals align for cleaner, faster decision-making.
How It Works
Add the indicator to your chart on any timeframe or market.
The algorithm automatically detects structure, liquidity, and imbalance zones.
Candlestick patterns are highlighted when they form near high-probability areas (like OBs or FVGs).
When confluence occurs such as a liquidity grab, FVG fill, and bullish engulfing candle—the indicator provides a visual signal zone for your confirmation-based entries.
You can refine your trades using higher-timeframe bias (HTF order flow) and lower-timeframe execution (LTF confirmation).
Best For
Traders using ICT, Smart Money Concepts, or price-action systems.
Intraday and swing traders looking for clear, data-driven chart structure.
Traders who want to simplify confluence analysis and focus on precision execution.
Why It Stands Out
Unlike standard candlestick or pattern scanners, this indicator merges institutional market logic with technical candle behavior, allowing traders to see where smart money might be entering or exiting positions.
It’s not about random signals it’s about context, structure, and confirmation.
Every feature in this indicator is built around the principle of liquidity engineering:
price creates liquidity, grabs it, and moves toward imbalance or order flow efficiency.
By merging that institutional logic with candlestick patterns, this tool gives traders an edge in recognizing not only where to trade but why price is reacting in that exact area.
Disclaimer
This indicator is intended for educational and analytical use. It does not provide financial advice or guaranteed trading results. Always backtest and manage your risk responsibly.

ICT Sweep + CHoCH + FVG Alerts
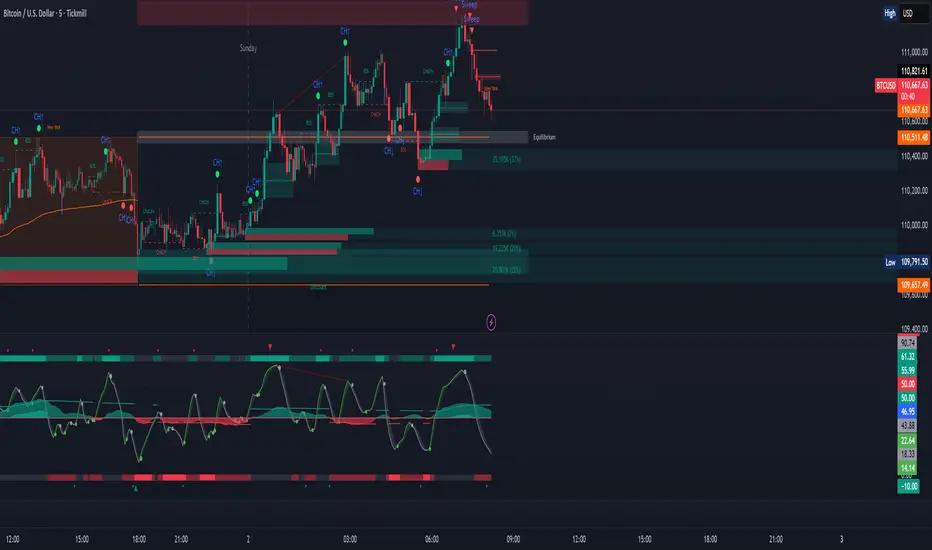
### 🔥 ICT Sweep + CHoCH + FVG Alerts
Script designed to automate ICT entry confirmations using:
• Liquidity Sweep (Buy/Sell Stops taken)
• Change of Character (CHoCH)
• Fair Value Gap (FVG) confirmation
### ✅ Conditions
**Long signal when:**
1. Bearish liquidity sweep
2. Bullish CHoCH
3. Bullish FVG forms and gets respected
**Short signal when:**
1. Bullish liquidity sweep
2. Bearish CHoCH
3. Bearish FVG forms and gets respected
### 🎯 Purpose
This script helps traders detect smart-money setup entries based on ICT logic and receive alerts in real time.
### 📡 Alerts
Supports webhook automation for bots, signal servers, or trading platforms.
*This script does not place trades automatically, alerts only.*
### ⚠️ Disclaimer
This tool is for educational purposes.
Always backtest and use proper risk management.
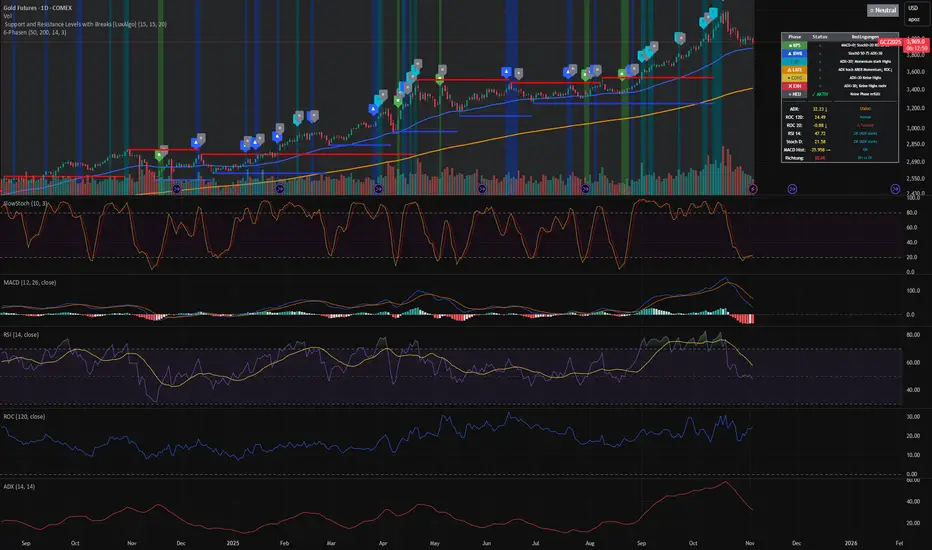
3-Phasen-Scanner (BPS / BWB / Neutral) – exakt wie TV-EMA3-Phasen-Scanner (BPS / BWB / Neutral) – exakt wie TV-EMA
DRACO Tomas Delta (Custom/Monthly)🐉 DRACO Delta SessionBox (Custom / Monthly)
Overview
The DRACO Delta SessionBox is an advanced visual and analytical tool designed to measure and display cumulative buying and selling pressure (Δ — delta) within a user-defined time window, such as a specific custom date range, a recurring monthly period, or the entire current month.
It visually represents market accumulation or distribution phases by calculating an approximate delta — the imbalance between bullish and bearish volume — and then aggregates it inside a dynamic “box” that spans only the selected time window.
Core Concept
Delta in this context is an approximation of the real order-flow delta (buy vs sell volume difference).
Since TradingView doesn’t provide raw tick-by-tick trade direction data, this indicator uses a proxy formula based on OHLC and volume data:
Δ per bar
=
Volume
×
(
Close
−
Open
)
max
(
High
−
Low
,
Tick Size
)
Δ per bar=Volume×
max(High−Low,Tick Size)
(Close−Open)
This gives a very effective approximation of intrabar directional pressure — whether volume was dominated by buyers (Δ > 0) or sellers (Δ < 0).
Modes
The indicator can operate in three distinct modes:
🕒 Custom DateTime
The user manually sets an exact date & time range (From – To).
The box only measures delta and volume accumulation within this window.
Ideal for analyzing specific events, like FOMC weeks, quarterly earnings, or macro periods.
📆 Monthly Window
The user selects start and end days of the month (e.g. 5–20).
The same window repeats automatically every month.
Useful for identifying recurring accumulation or distribution cycles within months.
🧭 Whole Month
Automatically measures and visualizes delta for the entire current calendar month.
The box resets when a new month begins.
Provides a macro-level view of monthly directional bias.


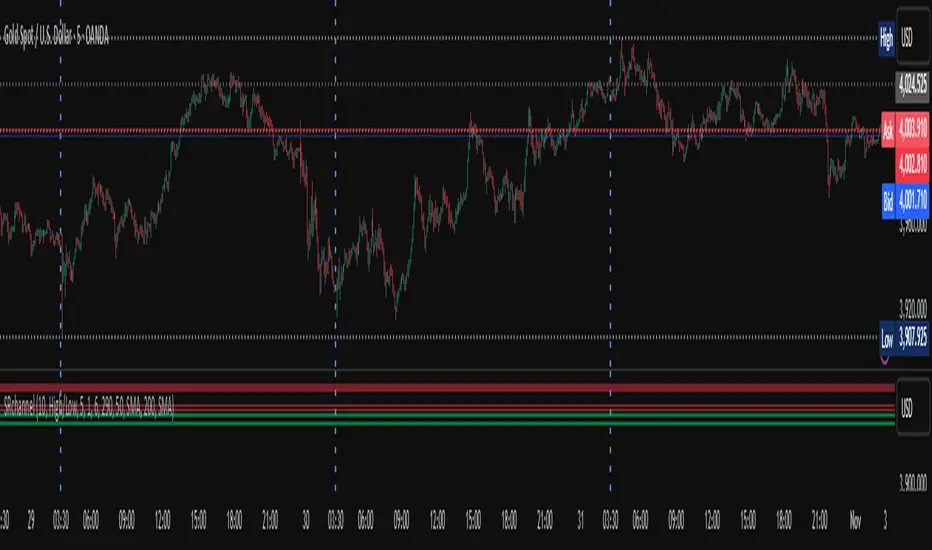
[FGL] Stochastic ATR Trend IndicatorThis indicator:
Detects trend direction using ATR-based dynamic bands around SMA.
Generates buy/sell signals using Stochastic crossover conditions filtered by trend.
Colors candles to show trend direction.
Plots a visual “trend zone” band on the chart.
INPUT PARAMETERS:
Stochastic Length → Period for the stochastic oscillator.
Smooth K and Smooth D → Smoothing parameters for %K and %D lines.
ATR Length → Period used for SMA-based trend detection.
LOGIC FLOW
Determine trend using long ATR-based SMA channel.
Detect momentum change with Stochastic cross.
Confirm both momentum and price align with trend.
Generate buy/sell signal + change candle color.
STRATEGIC INTERPRETATION
Best use: Trend-following momentum entries.
Avoids: Countertrend false signals by filtering with trend value.
Signals:
Buy: In uptrend + bullish stochastic crossover.
Sell: In downtrend + bearish stochastic crossover.

Trading Session Analyzer - Best Trading Hours📊 OVERALL DESIGN & PURPOSE
This indicator identifies optimal trading hours based on:
Market session overlaps (when multiple markets are open)
Volume and volatility conditions
Trend strength (ADX)
Range-bound vs trending market detection
Target Use Case: Intraday traders looking to trade during high-liquidity periods with clear directional moves.

No FOMO! Trade only during ICT Macros**🚫 Crush FOMO. Trade ONLY during ICT's macro windows**
Tired of jumping into impulsive trades the moment price twitches? **No FOMO** paints your chart **blood-red** and slams a **giant 🚫 countdown** the instant you drift outside the **42-15 minute sweet spot** (or any custom intrahour rule you set).
- **Instant visual lockdown** – entire chart turns crimson between 16–41 min.
- **Loud alert on open/close** – push + sound so you never miss the gate.
- **One-click timezone picker** – EST, GMT, Tokyo… works globally.
- **Zero lag, lightweight** – runs on 1-min charts without slowing you down.
**Proven to kill revenge trades & over-trading in <7 days.**
Add to chart → watch discipline skyrocket.
*Free | Open-source | Works on every plan*
👉 **Tag a friend who needs this.**

RTH Gap Counter (H4) jjha sajifbas bidfiugqfo sjshasdh ghbdsn xjve , yfv ty ggtht,hfnbcm nelf s vb. , pfyjddj yt [fqykzbcm xtrcjv

Buy&Hold Profitcalculator in EuroTitle: Buy & Hold Strategy in Euro
Description:
This Pine Script implements a simple yet flexible Buy & Hold strategy denominated in Euros, suitable for a wide range of assets including cryptocurrencies, forex pairs, and stocks.
Key Features:
Custom Investment Amount: Define your invested capital in Euros.
Flexible Start & End Dates: Specify exact entry and exit dates for the strategy.
Automatic Currency Conversion: Supports assets priced in USD or USDT, converting the invested capital to chart currency using the EUR/USD exchange rate.
Single Entry and Exit: Executes a one-time Buy & Hold position based on the defined timeframe.
Profit and Performance Tracking: Calculates total profit/loss in Euros and percentage returns.
Smart Exit Label: Displays a dynamic label at the exit showing final position value, net profit/loss, and return percentage. The label automatically adjusts its position above or below the price bar for optimal visibility.
Visual Enhancements:
Position value and profit/loss plotted on the chart.
Background color highlights the active investment period.
Buy and Sell markers clearly indicate entry and exit points.
This strategy is ideal for traders and investors looking to simulate long-term positions and evaluate performance in Euro terms, even when trading USD-denominated assets.
Usage Notes:
Best used on daily charts for medium- to long-term analysis.
Adjust start and end dates, as well as invested capital, to simulate different scenarios.
Works with any asset, but currency conversion is optimized for USD or USDT-pegged instruments.

Rita Swings •Impulses and Setbacks (Banana Trader)🚀 I just created an indicator that automatically shows market impulses and pullbacks 📊
With this indicator, you'll be able to see where the price is really moving and where the market pauses before the next move 💪
A simple yet powerful tool to improve your chart reading 🔥

Liquidity Sweeps [Raja Saien]Liquidity Sweeps - Smart Money Concepts Indicator
Automatically detects institutional liquidity grabs at swing highs/lows through wick analysis and outbreak/retest patterns.
FEATURES:
- Three detection modes: Wicks only, Outbreaks & Retest, or Combined
- Visual sweep zone highlighting
- Real-time alerts
- Customizable colors and extension
- Works on all markets and timeframes
Helps identify potential reversal points where smart money clears liquidity before price moves in the intended direction.
Perfect for traders looking to follow institutional order flow and improve entry timing.

Trend Entry_0 [TS_Indie]Trend Entry_0 — Mechanism Overview
The core structure of this strategy is based on a price action reversal pattern, as detailed below:
In the case of a Bullish Trend Reversal:
The price initially moves in a bearish direction. When candle A forms a low lower than the previous low, the high of candle A becomes a key reference point.
If the next candle closes above the high of candle A , it confirms a Bullish Trend Reversal.
* Upon a Bullish signal, a Long position is opened at the opening price of the next candle (candle B).
* When a subsequent Bearish signal occurs, the Long position is closed at the opening price of the next candle (candle C).
In the case of a Bearish Trend Reversal:
The price initially moves in a bullish direction. When candle A forms a high higher than the previous high, the low of candle A becomes a key reference point.
If the next candle closes below the low of candle A , it confirms a Bearish Trend Reversal.
* Upon a Bearish signal, a Short position is opened at the opening price of the next candle (candle B).
* When a subsequent Bullish signal occurs, the Short position is closed at the opening price of the next candle (candle C).
Options
* The start and end dates of the backtest can be customized.
* The swing lines of the trend can be displayed as an optional visual aid.
* The user can choose whether to open only Long or Short positions.
Backtest Results and Observations
Based on the backtesting results of this strategy across various assets and timeframes, it has been observed that this approach works best on trending assets such as Gold, BTC, and stocks.
It also performs well on higher timeframes, starting from the Daily timeframe and above, especially when taking Long positions only.
However, when applied to currency pairs such as EUR/USD, the results tend to be less impressive.
I encourage everyone to try backtesting and further developing this strategy — adding new conditions or filters may potentially lead to improved performance.
Disclaimer
This script is intended solely for backtesting purposes, based on a particular price action pattern.
It does not constitute financial or investment advice.
Backtest results do not guarantee future performance.

Jitendra Volume Pro / Fixed RangeHello All,
This script calculates and shows Volume Profile for the fixed range. Recently we have box.new() feature in Pine Language and it's used in this script as an example. Thanks to Pine Team and Tradingview!..
Sell/Buy volumes are calculated approximately!.
Options:
"Number of Bars" : Number of the bars that volume profile will be calculated/shown
"Row Size" : Number of the Rows
"Value Area Volume %" : the percent for Value Area
and there are other options for coloring and POC line style
Enjoy!
Jitendra Sankpal
Bull Run Galaxy
2.11.2025
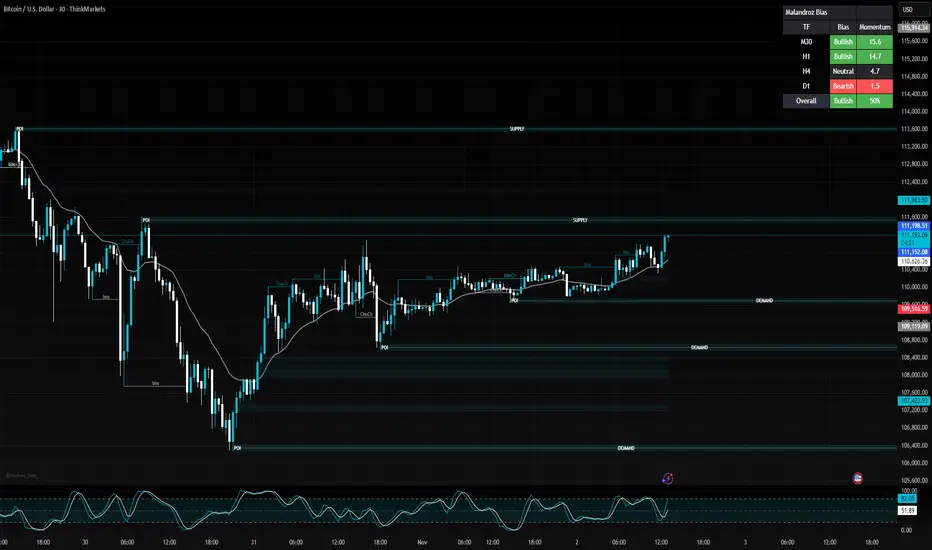
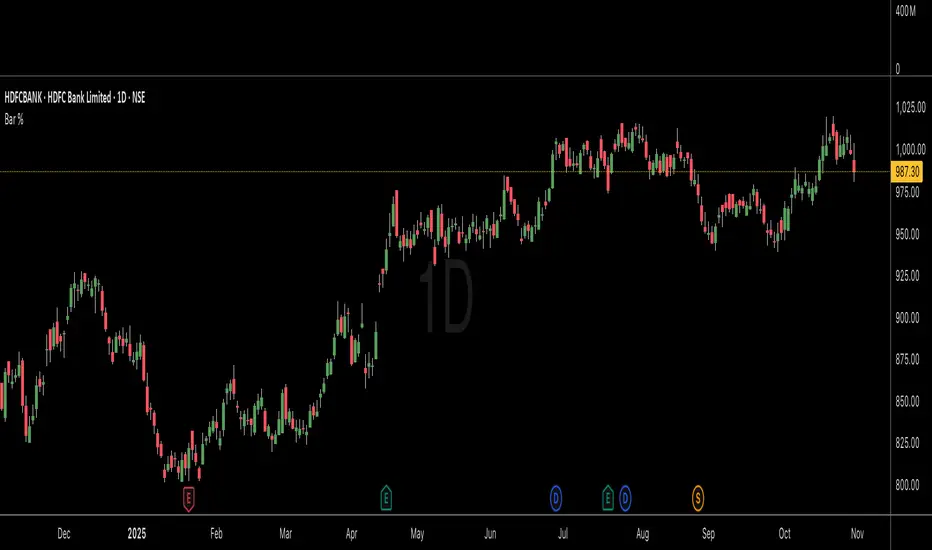
SMC INDICATORMoney Concepts (SMC) toolkit and issues buy / sell signals. It includes:
Structure (market structure shifts via pivots)
Order Blocks (last bearish/bullish candle before a structure shift)
Fair Value Gaps (3-bar gap detection)
Simple liquidity sweep detection
Buy / Sell signal generation & alert conditions
Rectangle drawings and on-chart arrows
This is a practical, best-effort SMC indicator suitable for 15m/30m/1H/etc. — feel free to tweak lookbacks and filters in inputs.
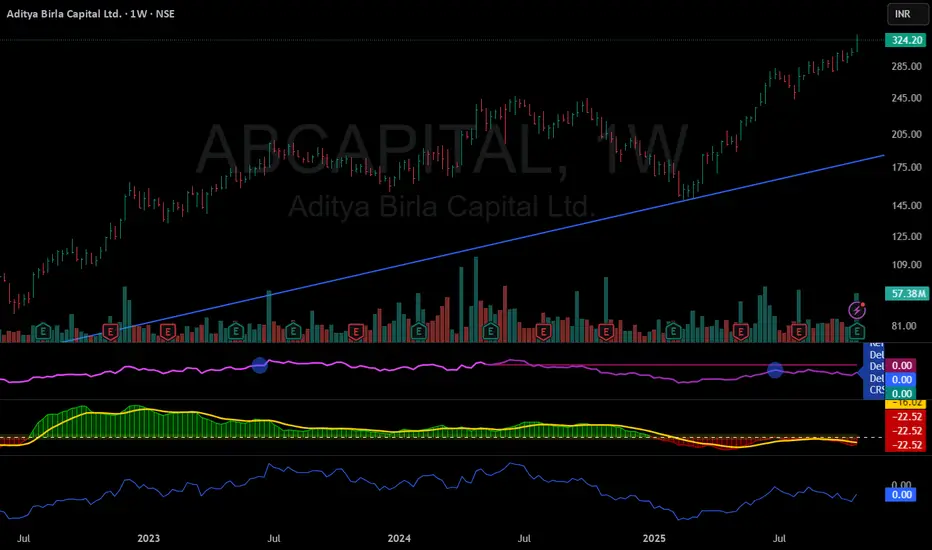
Relative Strength vs XAUIts a simple relative strength chart, right now i have set it with Gold, as it is outperforming most of indices globally.
Days of the week// This indicator is an alternative version of the popular "Days of Week" script originally created by @BALine.
//This version preserves the core functionality while introducing some slight changes:
//Optimized Code Structure: The original seven repetitive plotchar calls for day labels have been replaced with a single, efficient call utilizing a switch statement, resulting in cleaner and more performant Pine Script code.
//Flexible Day Separation: A vertical line is drawn on the chart to clearly mark the beginning of a new trading day, defaulting to the critical 17:00 (5 PM) New York time session rollover (standard for FX and futures).
//Customizable Label Time: The hour at which the day-of-week labels ("Monday," "Tuesday," etc.) appear on the chart is now controlled by a user input, allowing traders to align the label with their local time zone, a specific market open (e.g., 9:00 AM), or any other relevant hourly mark.
//This tool is essential for traders who incorporate time and daily structure into their analysis. It provides an immediate visual reference for daily trading ranges, market session breaks, and identifying day-of-week biases.
//Attribution: A huge thank you to @BALine for the original concept and foundation of the "Days of Week" indicator.

Element Squared RSI Divergence IndicatorRSI Divergence indicator developed by the team at Element Squared Private Wealth.

Previous Week High & Low Flat Trendlines + Labels on Current weeks lower time frames which display Previous Week High & Low