Triple EMA (TEMA) + Slope LeadThis indicator plots a standard Triple EMA (TEMA) and an optional slope-lead version. TEMA is a low-lag moving average built from three EMAs, allowing it to track price more closely than a single EMA. The Lead Strength (k) adds a small forward “push” based on the recent TEMA slope:
TEMA_lead = TEMA + k × (TEMA − TEMA ). Higher k values make the line react earlier but increase sensitivity in chop.
Used as a source for other indicators (RSI, MACD, stochastic, regime filters, etc.), TEMA or TEMA-Lead may improve signal quality by reducing noise, aligning momentum readings with trend direction, and producing earlier, cleaner transitions at turns, often without the excessive lag introduced by heavier smoothing.
指标和策略
Hardwaybets Strat Market Checklist Trading## **Hardwaybets TheStrat Market Checklist Engine**
**A Checklist-Driven TheStrat Trading**
---
### **Overview**
This script is an **informational market context and permission framework** designed to help users **organize structural and liquidity information** in a clear, checklist-based format.
It evaluates **price context only** and displays the results in a table.
It does **not** generate trade signals or trading instructions.
---
### **What This Script Does**
The indicator evaluates and displays:
* Nearest prior **Area of Interest (AOI)**
(Previous Day High/Low or Previous Week High/Low)
* Higher-timeframe structural bias (Daily & Weekly)
* Proximity to liquidity
* Liquidity behavior (acceptance vs rejection)
* **Strat pattern classification only** (12 canonical patterns)
* A final **permission state** based on the above conditions
All information is presented as **contextual reference data**, not execution guidance.
---
### **What This Script Does NOT Do**
* ❌ No buy or sell signals
* ❌ No arrows, markers, or execution prompts
* ❌ No entries, exits, stops, or targets
* ❌ No performance metrics or profitability claims
* ❌ No strategy or backtesting logic
The word **“TRADE”** in the dashboard refers to **permission status only**, not a recommendation to trade.
---
### **Dashboard Modes**
* **Full Mode**: displays AOI price and distance (points & ticks)
* **Compact Mode**: minimal checklist view for reduced screen usage
Both modes are **informational only**.
---
### **Pattern Classification**
The script identifies and labels Strat candle pattern **types only**, including:
* Reversal patterns
* Continuation patterns
* Compression patterns
* Expansion patterns
Pattern labels are **descriptive classifications**, not signals or instructions.
---
### **Intended Use**
This script is intended to be used as a **contextual reference tool** alongside a user’s own analysis, rules, or education.
It may be useful for:
* Market structure study
* Liquidity behavior observation
* Pattern classification review
* Educational purposes
---
### **Technical Notes**
* Pine Script® v6
* Uses completed candles only
* No repainting logic
* No future data access
* Table-based UI only
---
### **Disclaimer**
This indicator is provided **for educational and informational purposes only**.
The author does not provide financial advice, trading recommendations, or execution guidance.
All trading decisions remain the sole responsibility of the user.
---
### **Conceptual Attribution**
This script is inspired by publicly available market structure concepts commonly referred to as “The Strat” methodology.
No proprietary or paid content is included.
---
### **Feedback**
Constructive feedback and suggestions are welcome.
Please note that this script is intentionally **non-signaling by design**.

My Price Curtain by @magasineMy Price Curtain by @magasine
Functional Description
My Price Curtain is a high-performance visual analysis tool designed to provide traders with immediate context regarding price positioning relative to institutional benchmarks. Unlike standard moving averages, this indicator creates a "curtain" of data that dynamically colors the chart background and provides real-time performance metrics to identify trend dominance at a glance.
Key Features & Differential Value
Multi-Method Dynamic Benchmarking: Choose between five different calculation methods: SMA, EMA, WMA, RMA, or a manual Fixed Price. This allows you to switch from a standard technical trend (MA) to a "break-even" or "entry point" analysis (Fixed Price) instantly.
Intelligent Visual Feedback: The "Curtain" logic automatically colors the chart background—Green for Bullish dominance and Red for Bearish dominance—reducing cognitive load during fast-paced sessions.
Advanced Statistical Tracking: The indicator includes a built-in Performance Table that tracks the percentage of bars closing above or below the selected benchmark. This helps traders quantify the strength of a trend over the entire visible dataset.
Precision Labeling & Distance Analysis: A dynamic, color-coded label tracks the price on the Y-axis. It calculates and displays the exact percentage distance from the price to the benchmark in real-time, helping to identify overextended moves.
Optional Deviation Zones: Enable visual "Safety Zones" (boxes) that project a user-defined percentage deviation from the average, assisting in identifying potential volatility expansion or exhaustion areas.
Trading Utilities
Trend Confirmation: Use the background color and "Bars Above" percentage to confirm if you are trading with the path of least resistance.
Scalping & Intraday Support: The "Distance" metric is essential for scalpers to avoid entering trades too far from the average (mean reversion risk).
Custom Strategy Benchmark: Use the "Fixed Price" mode to set your specific entry price and see your real-time performance and "curtain" status relative to your position.

High/Low Tracker ARDR/ADR V4High and lows in 2 timeframes
16:00 -> 03:55
19:30 -> 02:55
Toggle on/off of
- Auto extending untill 09:25
- Live updating during price action
Configure linestyles, box styles
It is now displaying correctly for both CL and ES

3 Session ORB (Opening Range Breakout) [TickDaddy]The ORB, or Opening Range Breakout indicator. will show all 3 sessions and you can adjust the times.

PSP 4H USD Divergence Highlighter (EURUSD + GBPUSD vs DXY)PSP indicator for the 4H chart. This compares the divergence between the EURUSD, GBPUSD, & DXY

Absolute VWAP and EMA9 Difference indicator - TF Pascal
The Absolute VWAP–EMA9 Difference indicator measures the absolute distance between the session’s VWAP and the EMA 9, highlighting the magnitude of separation regardless of direction. A 100-period moving average of this difference shows the typical distance. Low values indicate price near fair value and low momentum, while high values suggest strong momentum or overextension.
built for the M1 chart

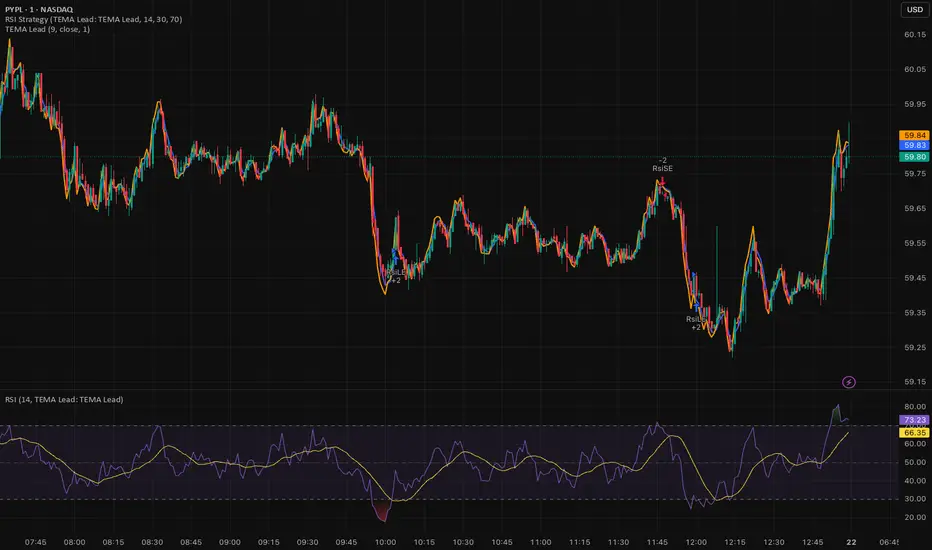
RSI Strategy with Auto Tuner (PF)# RSI Auto‑Tuner Strategy — How To Use
This document explains **how to use** the RSI Auto‑Tuner strategy. It intentionally avoids math and implementation details. Follow this as an operating guide.
---
## 1. What This Tool Is For
This strategy helps you:
* Discover **which RSI length works best** on a given ticker and timeframe
* Measure performance using **Profit Factor (PF)**
* Improve RSI performance on noisy markets by **transforming price first**
The auto‑tuner is a **research tool**, not a live trading signal generator.
---
## 2. Two Modes You Must Treat Differently
### Research Mode
Used to explore and discover parameters.
* Auto‑Tune: **ON**
* Parameters are allowed to change
* Results may look very good
* Overfitting risk is real
### Trading Mode
Used for forward testing or live trading.
* Auto‑Tune: **OFF**
* Parameters are fixed
* Behavior is stable and repeatable
* This is the only acceptable mode for live use
**Never trade live with Auto‑Tune enabled.**
---
## 3. Manual Mode (Trading Mode)
Use this after parameters are finalized.
Steps:
1. Set **Auto‑Tune = OFF**
2. Choose:
* Source (raw price or transformed price)
* RSI Length (manual, default 14)
* Oversold / Overbought levels
3. The strategy will:
* Enter long when RSI crosses up through Oversold
* Enter short when RSI crosses down through Overbought
* Flip positions on opposite signals
This mode is predictable and safe for forward testing.
---
## 4. Auto‑Tune Mode (Research Mode)
Use this to find optimal RSI lengths.
Steps:
1. Set **Auto‑Tune = ON**
2. Configure the search range:
* Minimum Length (default 5)
* Maximum Length (default 14)
* Step Size (default 1)
3. The strategy will:
* Internally simulate trades for each RSI length
* Track gross profit, gross loss, and trades
* Select the length with the highest Profit Factor
4. The best length is applied automatically
Auto‑Tune evaluates historical data only.
---
## 5. Using a Transform on Price (Critical)
RSI does **not** have to run on raw price.
You can significantly improve results by:
* Applying a **price transform** first
* Feeding the transformed series into the RSI Source input
Examples of transforms:
* Moving averages
* Low‑pass filters
* Butterworth filters
* Any smoother or denoiser
Why this works:
* Busy, wicky markets cause RSI to whipsaw
* Transforms remove micro‑noise
* RSI responds to structure instead of chaos
* Profit Factor often increases dramatically
Best practice:
* Auto‑tune on raw price
* Auto‑tune on transformed price
* Compare PF, trade count, and stability
---
## 6. Reading the Status Label
At the last bar, the on‑chart label shows:
* Whether Auto‑Tune is ON or OFF
* Whether candidates were built successfully
* Number of RSI lengths tested
* Best RSI length found
* Profit Factor and trade count
If Auto‑Tune is OFF, the label shows the manual length.
---
## 7. Recommended Workflow
1. Choose ticker and timeframe
2. Enable Auto‑Tune on **raw price**
3. Record best RSI length and PF
4. Enable Auto‑Tune on **transformed price**
5. Compare results
6. Lock parameters
7. Disable Auto‑Tune
8. Forward test
---
## 8. Warnings and Discipline
* High PF with few trades is unreliable
* Transforms can hide execution costs
* Always validate on a different period
* Auto‑Tune is a **lens**, not an edge
Treat this tool as a research microscope, not an autopilot.

EMA & Stochastic SignalsEma 200 and ema 500 + stochastic crossover. Buys when price is above emas and sells when price is below emas.

VOLD RatioThis indicator calculates the ratio between NYSE Up Volume and Down Volume (USI:UVOL / USI:DVOL).
It helps assess market participation and short-term buying vs. selling pressure.
Higher values indicate dominant buying volume, while lower values suggest increasing selling pressure.
Useful as a breadth and confirmation tool alongside index price action.

New York Sessions High/Low with Liquidity Purge CriteriaDisplays horizontal lines at the highest high and lowest low of the NY AM (09:30–12:00) and NY PM (13:30–16:00) sessions in New York time.
Lines extend forward until price strongly breaks them by a user-defined threshold (N points), at which point they cease extending - liquidity purged.
Option to show only active lines (unpurged liquidity) - toggle to hide old liquidity pools for a cleaner chart.
Customizable colors, line styles, width, lookback days and purge threshold.

Michael Mor - ATRMichael Mor -ATR is a clean, lightweight chart watermark that gives you key stock context at a glance — without cluttering your chart or covering price action.
It’s designed for traders who want essential fundamentals + recent performance visible directly on the chart, in a subtle, professional style.
What it shows
You can toggle each line on or off:
Company name (optional market cap: M / B / T)
Symbol & timeframe
Sector & industry
ATR (14) with percentage of price and a quick volatility indicator
🟢 low volatility
🟡 medium volatility
🔴 high volatility


PM/PW/PD/OVN/CD Highs & Lows with prices+ EMAsPM/PW/PD/OVN/CD Highs & Lows with prices
+
3 customizable EMAs (def 12/34/55)

Day-Week-Month-Hour Separator [TickDaddy]As the title shows.
Separator lines for Hours/Days/Weeks/Months. customize as you please :)

Multiple Time Frame Stoch-RSIThis indicator is designed to show users the values for default stochastic RSI and default RSI settings across multiple time frames.
I have made many bad trades focusing too closely on one particular time frame and indicators that suggest the price will move one way, to be superseded by a higher timeframe pushing price in another direction.
The timeframes are customisable so you can select your own timeframes, but the default timeframes chosen here are part of the BareNaked Crypto or Naked Nation strategy, looking at timeframes in multiples of 3 for lower timeframes.
The idea in its simplest form is that when timeframes like the 3/6/9m are all over sold or over bought (coloured red or green) then it could be a suitable time to place an order. Or at least be more favourable for your trade.
This indicator as with all indicators is designed as a tool to add to whatever arsenal of strategy or tools you are already using and does not constitute financial advice, just be cause 3/6/9m is in red or green does not guarantee that the trade will go your way.
The orange on the timeframes are generally designed to show users where price can reverse so for example if the stochastic 3m is at 10 and in green, but the 9m is at 65 in orange, it could be that a push up is not finished and the 9m drop from oversold to 65 could be reversed due to a low 3m stochastic number and then 9m goes from 65 back up to 100, and vice versa.
The arrows for direction also allow you to quickly deduce the direction of the stochastic RSI, ^ up, V down, and stable -. this should allow you to see if the stochastic has been rising and is beginning to turn around or not.

MA150 RespectRatio NoamzThis indicator measures how reliably price respects the 150-day moving average as support.
It computes an empirical probability (Respect Ratio) based on historical interactions with MA150:
– Dynamic touch tolerance based on ATR
– Optional shallow breaks allowed (user-defined)
– Trend filter (MA150 rising + price above)
– Minimum event count for statistical reliability
The output is a probability score (0–1) indicating how often MA150 held as support when tested.
This tool is intended for research and decision support, not as a standalone trading signal.

PrimeFib_constants_v1Library "PrimeFib_constants_v1"
PrimeFib / GoldenWhirl constants (Pine Library). Versioning is handled via TradingView publish versions.
GOLDEN_RATIO()
GOLDEN_RATIO_INV()
PI()
INV_PI()
PHI_SPIRAL()
PHI7()
PHI7_INV()
PSI_PF()
PSI_PF_INV()
LAMBDA_PF()
RHO_PF_THEO()
RHO_BTC_EMP()
RHO_CME_EMP()
RHO_PF_EMP()
RHOT()

ZNOX Spot Trading Signalsthis is build for znox to give the user batter view not correct 100% and following it under your risk

Monday Range - User Defined LookbackEnglish Description
Monday Range Expansion & Multi-Week Projections
This indicator identifies the Monday Range (the price action from Monday's open at 00:00) and projects symmetric expansion levels across the entire trading week. It is designed for traders who use the weekly open and Monday's volatility as a benchmark for the week's price action.
Key Features:
Exact Monday 00:00 Start: Using advanced logic, the indicator pins the starting point precisely to the weekly open (Monday 00:00), ensuring no lag or offset regardless of your timeframe.
Symmetric Expansion Levels: It calculates the Monday High-Low range and projects a +100%, +50%, -50%, and -100% expansion, providing clear support and resistance targets.
User-Defined Lookback: You can choose exactly how many past weeks to display on your chart, keeping your workspace clean and focused.
Force Overlay Technology: All lines and labels use force_overlay, ensuring they always stay on the top layer, above candles and other indicators.
Weekly Freeze: Historical weeks stay "frozen" at their Friday closing points, allowing for clear backtesting of previous weekly levels.

Trend Consensus Engine [TCE]The Trend Consensus Engine (TCE) is a comprehensive market analysis system designed to filter out noise and provide a quantifiable "Trend Score" (0-100). Instead of relying on a single indicator, this script aggregates data from multiple market factors—volatility, momentum, and trend structure—to generate high-probability entry signals based on a consensus logic.
This tool is particularly optimized for Crypto (with specific time-gated logic) and BIST (Borsa Istanbul) markets, allowing traders to see the overall health of the trend at a glance via a dashboard.
How It Works
The engine calculates a composite "Total Score" (0-100) derived from four weighted components:
Trend Structure (AlphaTrend & Guppy):
Analyzes the slope and position relative to the AlphaTrend (Credit to @KivancOzbilgic) and Guppy Multiple Moving Averages (GMMA).
Positive slopes and price action above key levels add points to the score.
Volatility & Momentum (Squeeze & ADX):
Incorporates the Squeeze Momentum logic (Credit to @LazyBear) to detect explosive moves.
ADX Filter: Filters out chopping/ranging markets. If the ADX is too low, the score is penalized or the signal is blocked.
Dynamic Resistance (MA Channels):
Uses a combination of Donchian Mid-Lines and SMAs to determine if the price is in a "safe zone" or hitting resistance.
Price Action Filters (Pinbar Veto):
Automatically detects bearish "Shooting Star" or weak candles at highs. If a bearish pinbar is detected, the entry signal is vetoed regardless of the trend score.
Features & Settings
Smart Scoring Dashboard: Displays the realtime Score, Instant Decision, and confirmed Close Decision on the chart.
Market Profiles:
Crypto Mode: Includes a "Time Gate" feature (07:00 UTC+3 check) to prevent fakeouts during low-liquidity hours.
BIST Mode: Optimized parameters for the Turkish stock market logic (14:00 session checks).
Score Threshold: Users can adjust the minimum score required (Default: 70) to trigger a "BUY" signal.
Visual Guidance: The background of the dashboard changes color (Green/Red/Yellow) based on the consensus.
How to Use
Check the Dashboard: Look at the "SONUÇ" (Result) row.
GİRİŞ ✅ (ENTRY): The Score is above 70, Momentum is positive, and no Bearish Pinbars are present.
BEKLE ⏳ (WAIT): The trend is weak, or a filter (like ADX or Squeeze) is blocking the trade.
Confirm with Price Action: Use the AlphaTrend lines (Blue/Red) as dynamic support/stop-loss levels.
Credits:
AlphaTrend by KivancOzbilgic
Squeeze Momentum Indicator by LazyBear
VuManChu Cipher concepts for inspiration.
Custom Logic: Scoring algorithm and Time-Gating mechanisms are original custom developments.
Disclaimer: This tool is for educational purposes only and does not constitute financial advice.

Liquidity Void and Repair EngineLiquidity Void & Repair Engine
OVERVIEW
The Liquidity Void & Repair Engine is a high-fidelity institutional order flow tool designed to identify and track "Market Imbalances" or "Fair Value Gaps" (FVG). Unlike standard gap indicators that clutter the chart with every minor price jump, this engine uses Volatility-Adjusted Range Mapping to isolate high-conviction voids where price moved so rapidly that liquidity was left "unfilled."
The standout feature of this tool is its Active Repair Logic. The engine doesn't just draw static boxes; it monitors price action in real-time to determine when an imbalance has been "healed" by subsequent trading volume, providing a dynamic look at where the market has "unfinished business."
TECHNICAL LOGIC & ORIGINALITY
This script is published Open Source to contribute to the Pine Script community’s understanding of dynamic object management and order flow visualization.
ATR-Relative Filtering: To ensure only significant voids are plotted, the script uses a user-defined ATR (Average True Range) multiplier. This filters out market noise and focuses on institutional "impulse" moves.
Dynamic Box Management: Utilizing the Pine Script box array system, the script manages memory efficiently by updating existing objects rather than creating redundant ones.
The "Repair" Algorithm: The script tracks the high and low of every active void. When price action fully traverses the coordinates of a void, the script "seals" the box, visually marking the moment of liquidity equilibrium.
HOW TO USE
1. Identifying the "Magnet" (The Void)
When price moves aggressively, it leaves a "hole" in the auction.
Bullish Voids (Green): These represent areas where price surged so fast that buyers may still have unfilled orders sitting below. These act as Magnets for pullbacks.
Bearish Voids (Red): These represent areas where price plummeted, leaving a vacuum of selling pressure. These act as Magnets for relief rallies.
2. Trading the "Repair" Process
The Engine tracks how the market "repairs" these holes:
Partial Fill: If price enters a box but doesn't cross it, the "Magnet" is still active.
Full Repair: When a box is "sealed" (stops extending right), it indicates the imbalance is gone. If price "Seals" a green box and then bounces, it confirms the zone as Valid Institutional Support.
3. Confluence with the Trend
Continuation: In a strong uptrend, look for price to drop into a Green Bullish Void and find support. This is often the "Golden Entry" for trend followers.
Reversal Confirmation: If price ignores a Red Bearish Void and blasts right through it (sealing it instantly), it signals a massive shift in market regime and extreme bullish conviction.
USER SETTINGS
Lookback Period: How far back the engine searches for un-repaired gaps.
Min Gap Size (ATR %): Increase this to see only the "Major" institutional gaps; decrease it for a more granular intraday look.
Visual Styles: Fully customizable colors and transparency to match any chart theme (Dark/Light).
NOTES & DISCLAIMER
This script is a visualization of historical price imbalances and is intended for educational purposes only. It does not provide trade signals, entry/exit points, or financial advice. All trading involves risk.

CAHOLD / CBLOHDCAHOLD (Close Above Highest Low Day) and CBLOHD (Close Below Lowest High Day)
The logic is based on identifying pullbacks followed by strength in the direction of the trend, making it useful as a trend-continuation entry signal rather than a reversal tool.
⸻
How CAHOLD Works (Bullish)
1. A sequence of red candles forms (a pullback).
2. The first green candle appears.
3. The script identifies the highest high of the prior red-candle sequence (HOLD).
4. A CAHOLD signal triggers when a green candle closes above that HOLD level.
5. A small green arrow is plotted below the candle.
⸻
How CBLOHD Works (Bearish)
1. A sequence of green candles forms (a bounce).
2. The first red candle appears.
3. The script identifies the lowest low of the prior green-candle sequence (LOHD).
4. A CBLOHD signal triggers when a red candle closes below that LOHD level.
5. A small red arrow is plotted above the candle.
⸻
Optional Filters
• EMA / SMA Trend Filter
Only shows CAHOLDs in uptrends and CBLOHDs in downtrends.
• Minimum Pullback Depth
Requires a minimum number of red/green candles before a signal can trigger.
• ATR Breakout Filter
Requires price to break the level by a volatility-adjusted amount.
