Parabolic SAR MTF LinesThe indicator shows the Parabolic SAR sign (price above or below the indicator) for several timeframes at once. You can see at a glance how the price is trending across higher and lower timeframes.
Note that, for lower timeframes, the line becomes yellow to the left because history is limited and there are not enough bars to calculate.
Other features (can be enabled in settings):
* each line can be enabled or disabled individually, so that unused ones can be hidden.
* simple trend detection based on the number of bullish and bearish timeframes; threshold can be changed in Settings.
* "Score" output: counting the net number of bullish and bearish timeframes
* "Trend" output: changes to bullish or bearish as the score goes over or under the threshold
* background color (green or red according to trend).
* alert for trend change.
* another alert with a separate threshold score for flexibility.
* score weights for further customization of trend detection and alerts. Input parameters are set in terms of score values instead of number of lines.
* input options to choose alert modes for trend and extra alerts. The options are "once per bar close" (default), "once per bar", "every time".
This indicator was based on MACD MTF Lines where all the logic and features came from.
抛物线转向指标(PSAR)

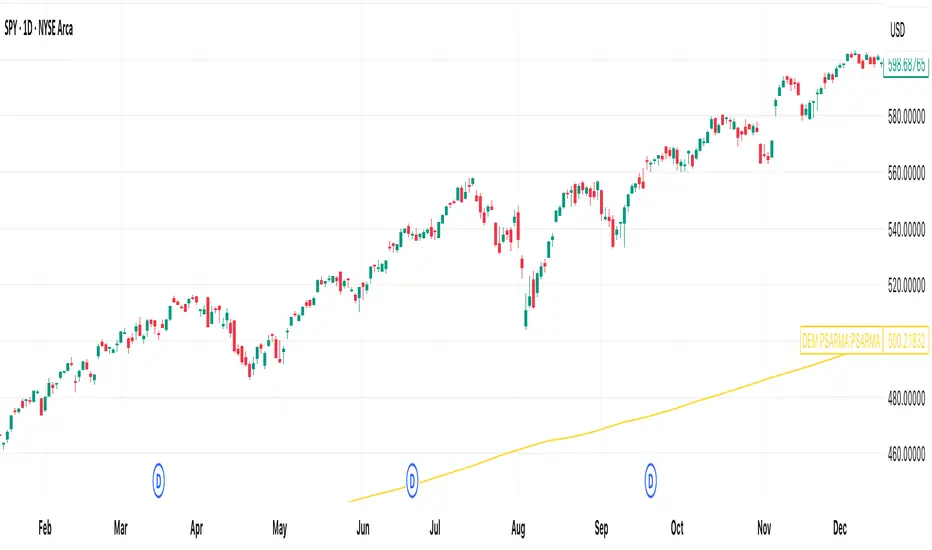
[DEM] Parabolic SAR Moving Average (PSARMA) Parabolic SAR Moving Average is a smoothed trend-following indicator that applies a moving average filter to traditional Parabolic SAR values to create a more stable directional signal with reduced whipsaws. The indicator calculates standard Parabolic SAR using customizable acceleration parameters (start, increment, and maximum values), then applies a 200-period RMA smoothing to eliminate the frequent reversals that can occur with raw SAR signals in sideways or volatile markets. This smoothed approach transforms the typically jagged SAR plot into a flowing yellow line that better represents the underlying trend direction while maintaining the SAR's inherent ability to accelerate during strong trending moves. The result is a hybrid indicator that combines the trend-following characteristics of moving averages with the acceleration-based logic of Parabolic SAR, making it particularly useful for identifying major trend changes and providing cleaner entry and exit signals in trending markets.
[DEM] Parabolic SAR Bars (PSAR Bars) Parabolic SAR Bars is a visual enhancement of the traditional Parabolic SAR indicator that uses dynamic color coding to represent the relative position and momentum of price versus the SAR levels. The indicator calculates the percentage difference between the closing price and the Parabolic SAR value, then applies either a gradient color scheme that transitions from red to blue based on the relative strength within a 20-period range, or a momentum-based coloring system using purple, blue, and red to indicate directional changes. Both the SAR plot points and the price bars themselves are colored according to this system, creating an intuitive visual representation where traders can quickly assess not just whether price is above or below the SAR, but also the strength and momentum of that relationship. This approach transforms the binary nature of traditional Parabolic SAR signals into a more nuanced visual tool that helps identify the intensity of trending conditions and potential momentum shifts before actual SAR reversals occur.

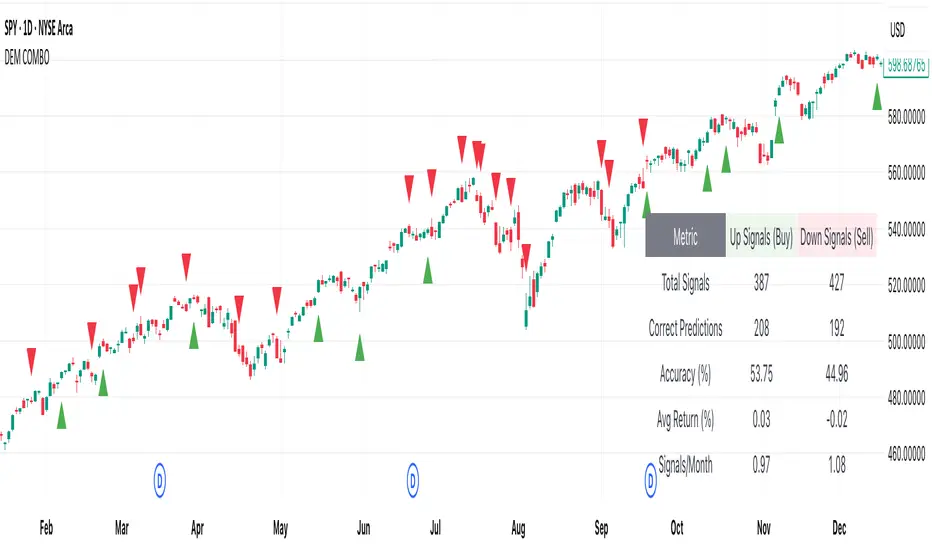
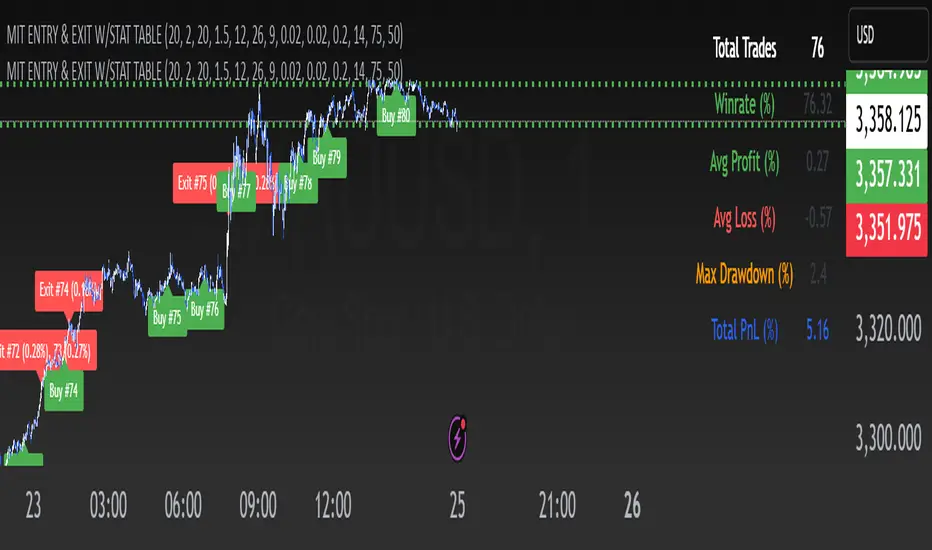
[DEM] Combo Signal (With Backtesting) Combo Signal (With Backtesting) is designed to generate buy and sell signals by combining seven different trading strategies that incorporate multiple technical indicators including SuperTrend, Parabolic SAR, MACD, and RSI. It also includes a comprehensive backtesting framework to evaluate the historical performance of these signals. The indicator overlays directly on the price chart, plotting signals and displaying performance statistics in a table. The strategy triggers buy signals when any of seven long conditions are met (including ATR-based reversal patterns, SuperTrend confirmations, RSI oversold crossovers, MACD bullish crossovers, and SuperTrend line breaks), while sell signals are generated when any of the corresponding seven short conditions occur, creating a multi-faceted approach that aims to capture various market conditions and trading opportunities while tracking signal accuracy, average returns, and signal frequency through its integrated backtesting system.
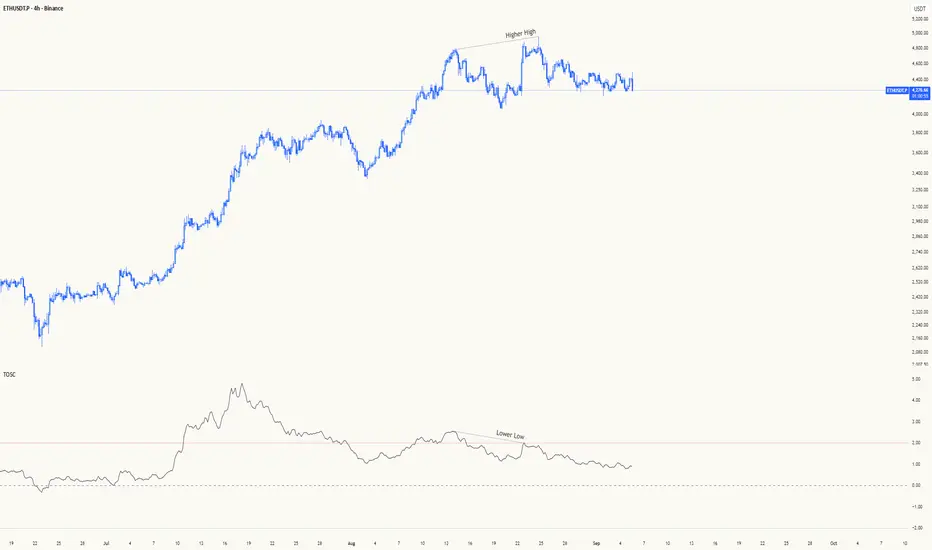
TWAP OscillatorTWAP Oscillator (TOSC)
A powerful mean reversion oscillator that measures price deviation from Time-Weighted Average Price (TWAP) in standard deviations, automatically adapting to your chart timeframe.
How It Works:
The TWAP Oscillator calculates the distance between current price and TWAP, expressed in standard deviations. Unlike VWAP which weights by volume, TWAP gives equal weight to each time period, making it ideal for:
• Mean Reversion Trading - Identifies when price is statistically overextended from its time-weighted average
• Trend Strength Analysis - Shows how far price has deviated from the TWAP baseline
• Entry/Exit Timing - Provides objective levels for trade entries and exits
Automatic Timeframe Adaptation:
The indicator intelligently selects the appropriate TWAP period based on your chart timeframe:
1m Charts → 1D TWAP (intraday mean reversion)
3m-5m Charts → 7D TWAP (weekly perspective)
15m-1h Charts → 30D TWAP (monthly context)
4h-8h Charts → 90D TWAP (quarterly view)
Daily Charts → 365D TWAP (yearly reference)
Trading Days vs Calendar Days:
Toggle between trading days (5D, 22D, 66D, 252D) or calendar days (7D, 30D, 90D, 365D) to match your analysis style.
Divergence Analysis - High Probability Reversals:
The most powerful signals occur when price and oscillator diverge at extreme levels:
Bullish Divergence (Oversold):
• Price makes lower lows
• Oscillator makes higher lows
• Both at oversold levels (-2 or lower)
• Strong buy signal - price weakness not confirmed by TWAP
Bearish Divergence (Overbought):
• Price makes higher highs
• Oscillator makes lower highs
• Both at overbought levels (+2 or higher)
• Strong sell signal - price strength not confirmed by TWAP
Hidden Bullish Divergence:
• Price makes higher lows
• Oscillator makes lower lows
• At oversold levels
• Trend continuation signal - pullback in uptrend
Hidden Bearish Divergence:
• Price makes lower highs
• Oscillator makes higher highs
• At overbought levels
• Trend continuation signal - rally in downtrend
Divergence Confluence Zones:
Maximum Confluence Setup:
• Divergence at extreme levels (±2+ std dev)
• Multiple timeframe confirmation
• Key support/resistance levels
• Volume confirmation
• Highest probability reversal
Divergence Trading Rules:
• Wait for clear divergence formation
• Confirm at extreme oscillator levels
• Enter on divergence confirmation
• Stop loss beyond recent swing
• Target return to zero line or opposite extreme
Key Features:
• Zero Line - Neutral position where price equals TWAP
• Overbought/Oversold Levels - Default ±2 standard deviations (customizable)
• Smoothing - SMA filter to reduce noise
• Info Table - Shows current values and timeframe mapping
• Alerts - Zero line crosses and overbought/oversold conditions
Trading Applications:
Mean Reversion Strategy:
• Enter long when oscillator crosses above oversold level (-2)
• Enter short when oscillator crosses below overbought level (+2)
• Exit when returning to zero line
Trend Following:
• Stay long while oscillator remains above zero
• Stay short while oscillator remains below zero
• Use extreme readings as potential reversal signals
Risk Management:
• Use overbought/oversold levels as stop-loss references
• Scale position size based on oscillator magnitude
• Combine with other indicators for confirmation
Mathematical Foundation:
Oscillator = (Current Price - TWAP) / Standard Deviation
Where:
• TWAP = Time-weighted average price over selected period
• Standard Deviation = Statistical measure of price dispersion
• Result = Number of standard deviations from mean
Best Practices:
• Use on higher timeframes for trend analysis
• Use on lower timeframes for entry timing
• Combine with volume analysis for confirmation
• Adjust overbought/oversold levels based on market volatility
• Consider market structure and support/resistance levels
Perfect For:
• Scalping - 1m charts with 1D TWAP
• Day Trading - 5m-15m charts with 7D TWAP
• Swing Trading - 1h-4h charts with 30D TWAP
• Position Trading - Daily charts with 365D TWAP
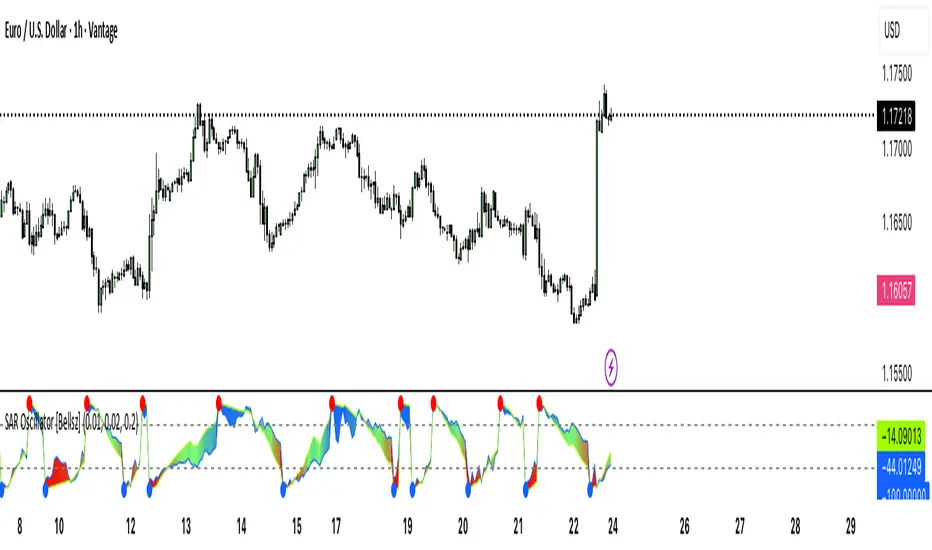
SAR Oscillator [Bellsz]Converts Parabolic SAR into a normalized oscillator with crossover signals, gradient fills, and trend strength levels. A cleaner way to read SAR momentum. Making it easier to read momentum shifts, trend strength, and reversals directly in the sub-chart. Instead of dots on price only, this tool converts SAR dynamics into a smooth oscillator that highlights bias and turning points.
What it shows
Normalized Price Line — scaled view of price relative to SAR.
Normalized SAR Line — SAR value normalized across the high/low range.
SAR Dots — visual cue when crossovers occur (potential reversal or trend acceleration).
Gradient Fill — color-coded background for quick read of momentum direction/intensity.
Guide Levels — ±50 baseline to track trend strength and overextension.
Why use it
Converts SAR into an oscillator format, easier to compare across instruments & timeframes.
Highlights momentum shifts early (crossovers, gradient flips).
Adds structure with gradient fill and baselines, making SAR more actionable than standard dot plots.
Works as a trend bias filter or confirmation tool alongside other indicators.
Inputs
Acceleration / Increment / Maximum — adjust SAR sensitivity.
Custom Colors — choose your scheme for price, SAR, and gradients.
Best practices
Use on intraday or swing TFs as a trend bias filter.
Look for Normalized Price crossing Normalized SAR as potential entry signals.
Watch how SAR dots cluster near ±100 for exhaustion or reversal signals.
Notes
This is a visual enhancement of SAR; it does not repaint.
Combine with volume, FVGs, or session models for added context.
Gap Reversal Signal with Indicators🔍 Gap Reversal Signal with Indicators — 結合 KD、MACD、SAR 與背離分析的多功能指標
🔍 Gap Reversal Signal with Indicators — A Multi-Tool Signal Indicator Combining KD, MACD, SAR, and Divergence Analysis
中文說明:
本指標結合多種常用技術分析工具,包括 KD 隨機指標、MACD 動能交叉、SAR 趨勢方向、以及 MACD 背離偵測,用以辨識潛在的價格反轉區域。適用於日內交易與波段操作,支援各類市場,如加密貨幣、股票與外匯等。
English Description:
This indicator combines several popular technical tools: Stochastic KD, MACD momentum crossovers, SAR trend direction, and MACD divergence detection. It helps traders identify potential reversal areas and is ideal for both intraday and swing trading. Works well on crypto, stocks, and forex markets.
🧠 功能特點 | Key Features
✅ KD指標(慢速隨機指標)檢測超買超賣並提供%K與%D交叉訊號
✅ Stochastic KD (slow) to detect overbought/oversold zones and crossover signals
✅ MACD金叉/死叉與零軸突破捕捉趨勢轉變與動能反轉
✅ MACD Crossovers + Zero-Line Breaks to capture trend changes and momentum reversals
✅ SAR指標即時顯示多空方向
✅ Parabolic SAR for real-time trend direction indication
✅ MACD背離偵測協助辨識潛在反轉區域
✅ MACD Divergence Detection for identifying hidden trend reversals
✅ 圖形提示與標籤提示可視化呈現各類訊號
✅ Visual Alerts and Labels for easy and quick signal recognition
📈 支援市場 | Supported Markets
📊 台股 / 美股 / 外匯 / 加密貨幣
📊 Taiwan Stocks / US Stocks / Forex / Cryptocurrencies (e.g. BTC, ETH)
🔧 推薦用法 | Recommended Use
搭配缺口策略與支撐壓力位使用
Use with gap-trading strategies and support/resistance zones
用於盤整末期或趨勢反轉的提示
Helpful for end-of-consolidation signals or trend reversals
支援短線與波段交易風格
Suitable for scalping and swing trading styles
💡 把這個指標加入你的圖表,立即體驗多重技術分析所帶來的交易優勢!
💡 Add this indicator to your chart now and experience the power of multi-tool technical analysis!

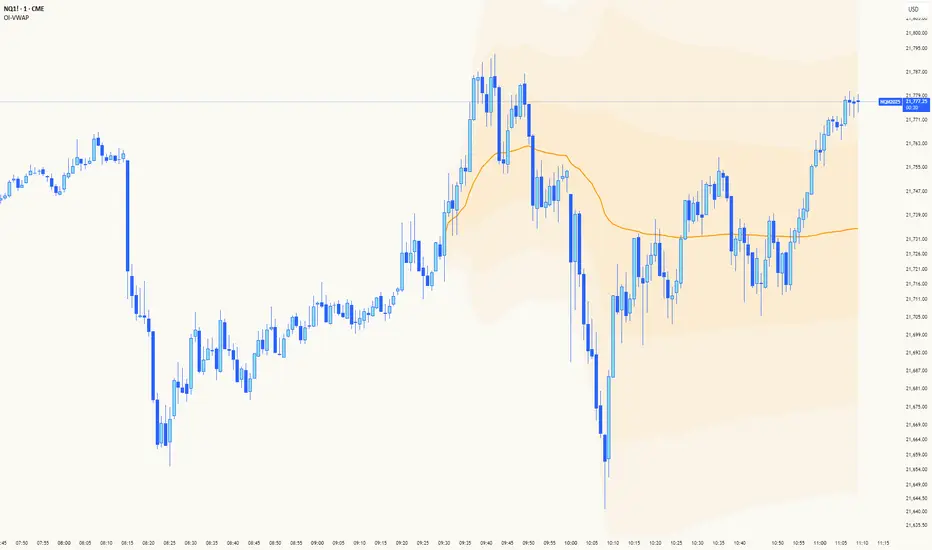
Big Money TrackerOI-Anchored VWAP: Big Money Position Tracker
Understanding VWAP in Big Money Trading
Volume Weighted Average Price (VWAP) is the benchmark most widely used by institutions to assess their execution quality and market timing. It represents the average price a security has traded at throughout the day, weighted by volume.
Why Institutions Care About VWAP:
Portfolio managers often mandate trades to be executed at or better than VWAP
Large orders are broken down and executed around VWAP to minimize market impact
Trading desks use VWAP as a neutral price to assess if they're buying too high or selling too low
Algorithmic trading systems use VWAP as a key reference for order execution
The OI-VWAP Edge
This indicator takes Big Money VWAP trading to the next level by anchoring VWAP calculations to significant Open Interest (OI) changes. This helps identify not just where institutions are trading, but where they're establishing significant positions in the crypto markets.
Key Features:
Dynamic OI-based VWAP anchoring that identifies where large positions are established
Previous VWAP level tracking to monitor historical Big Money interest points
Smart sweep detection system for both current and previous VWAP levels
Standard deviation bands for volatility context
What Makes This Indicator Unique:
Uses aggregated Open Interest data from major exchanges (Binance, BitMEX, Bybit, Kraken)
Automatically detects significant OI increases to anchor VWAP levels
Tracks both current and previous Big Money reference prices
Identifies potential stop runs and liquidity sweeps
Trading Applications:
The indicator helps identify where large positions are established and how they might influence price action:
Defense Zones: When price approaches a VWAP level with high OI, institutions often defend their positions
Liquidation Levels: Previous VWAP levels can become liquidation targets for trapped positions
Stop Runs: Sweep detection helps identify when large players might be hunting stops or creating liquidity
Mean Reversion: SD bands help identify potential reversal zones around Big Money average prices
Best Practices:
Look for price reaction at current VWAP when OI is increasing
Monitor sweeps of previous VWAP levels for potential reversals
Use SD bands to gauge volatility expansion/contraction around Big Money positions
Pay attention to failed sweeps as they often indicate strong position defense
Trading Scenarios:
// Bullish Position Defense:
// 1. High OI increase creates new VWAP (Big Money entry)
// 2. Price tests VWAP from above (retest of entry)
// 3. Failed bearish sweeps = shorts trapped
// 4. Strong defense + trapped shorts = potential squeeze
// Bearish Liquidation:
// 1. Previous VWAP level above current price
// 2. High OI trapped at higher prices
// 3. Price sweeps above then fails = more trapped longs
// 4. Break below = potential cascading liquidations
Trend Classifier [ChartPrime]Trend Classifier
This is a multi-level trend classification tool that detects bullish, bearish, and ranging conditions using an adaptive smoothing method. It highlights trend strength through color-coded candles and layered bands, making it easy to interpret market momentum visually.
⯁ KEY FEATURES
Classifies trend strength using 3 bullish and 3 bearish levels relative to an adaptive trend line.
Neutral (range) zones are marked when price stays between key bands, often signaling low volatility or consolidation.
Automatically filters band visibility based on current trend direction:
In uptrends, only levels below the price are displayed.
In downtrends, only levels above the price are shown.
Color-coded candles:
Aqua candles for bullish conditions.
Red candles for bearish conditions.
Orange candles during neutral or ranging conditions.
Includes a trend direction change marker (diamond), plotted when a shift in trend is detected.
Plots a central smoothed trend line to anchor the trend bands dynamically.
Displays a trend strength dashboard in the top-right corner with real-time bull and bear scores (0 to 3).
Labels with arrows (▲/▼) show current trend direction and strength on the chart.
⯁ HOW TO USE
Use bull and bear levels (1–3) to assess the momentum of the current trend.
When bull = 0 and bear = 0 , market is considered ranging or consolidating – consider fading or waiting for breakout confirmation.
Trend bands can be used as dynamic support/resistance during trending phases.
Monitor the trend change diamonds to spot potential early reversals.
Combine with volume or oscillator tools for confirmation of strength shifts.
⯁ CONCLUSION
Trend Classifier helps traders stay aligned with the dominant trend while visually breaking down market momentum into levels. Its clean color-coded design and strength dashboard make it ideal for both trend following and range trading strategies.

Pivot Candle PatternsPivot Candle Patterns Indicator
Overview
The PivotCandlePatterns indicator is a sophisticated trading tool that identifies high-probability candlestick patterns at market pivot points. By combining Williams fractals pivot detection with advanced candlestick pattern recognition, this indicator targets the specific patterns that statistically show the highest likelihood of signaling reversals at market tops and bottoms.
Scientific Foundation
The indicator is built on extensive statistical analysis of historical price data using a 42-period Williams fractal lookback period. Our research analyzed which candlestick patterns most frequently appear at genuine market reversal points, quantifying their occurrence rates and subsequent success in predicting reversals.
Key Research Findings:
At Market Tops (Pivot Highs):
- Three White Soldiers: 28.3% occurrence rate
- Spinning Tops: 13.9% occurrence rate
- Inverted Hammers: 11.7% occurrence rate
At Market Bottoms (Pivot Lows):
- Three Black Crows: 28.4% occurrence rate
- Hammers: 13.3% occurrence rate
- Spinning Tops: 13.1% occurrence rate
How It Works
1. Pivot Point Detection
The indicator uses a non-repainting implementation of Williams fractals to identify potential market turning points:
- A pivot high is confirmed when the middle candle's high is higher than surrounding candles within the lookback period
- A pivot low is confirmed when the middle candle's low is lower than surrounding candles within the lookback period
- The default lookback period is 2 candles (user adjustable from 1-10)
2. Candlestick Pattern Recognition
At identified pivot points, the indicator analyzes candle properties using these parameters:
- Body percentage threshold for Spinning Tops: 40% (adjustable from 10-60%)
- Shadow percentage threshold for Hammer patterns: 60% (adjustable from 40-80%)
- Maximum upper shadow for Hammer: 10% (adjustable from 5-20%)
- Maximum lower shadow for Inverted Hammer: 10% (adjustable from 5-20%)
3. Pattern Definitions
The indicator recognizes these specific patterns:
Single-Candle Patterns:
- Spinning Top : Small body (< 40% of total range) with significant upper and lower shadows (> 25% each)
- Hammer : Small body (< 40%), very long lower shadow (> 60%), minimal upper shadow (< 10%), closing price above opening price
- Inverted Hammer : Small body (< 40%), very long upper shadow (> 60%), minimal lower shadow (< 10%)
Multi-Candle Patterns:
- Three White Soldiers : Three consecutive bullish candles, each closing higher than the previous, with each open within the previous candle's body
- Three Black Crows : Three consecutive bearish candles, each closing lower than the previous, with each open within the previous candle's body
4. Visual Representation
The indicator provides multiple visualization options:
- Highlighted candle backgrounds for pattern identification
- Text or dot labels showing pattern names and success rates
- Customizable colors for different pattern types
- Real-time alert functionality on pattern detection
- Information dashboard displaying pattern statistics
Why It Works
1. Statistical Edge
Unlike traditional candlestick pattern indicators that simply identify patterns regardless of context, PivotCandlePatterns focuses exclusively on patterns occurring at statistical pivot points, dramatically increasing signal quality.
2. Non-Repainting Design
The pivot detection algorithm only uses confirmed data, ensuring the indicator doesn't repaint or provide false signals that disappear on subsequent candles.
3. Complementary Pattern Selection
The selected patterns have both:
- Statistical significance (high frequency at pivots)
- Logical market psychology (reflecting institutional supply/demand changes)
For example, Three White Soldiers at a pivot high suggests excessive bullish sentiment reaching exhaustion, while Hammers at pivot lows indicate rejection of lower prices and potential buying pressure.
Practical Applications
1. Reversal Trading
The primary use is identifying potential market reversals with statistical probability metrics. Higher percentage patterns (like Three White Soldiers at 28.3%) warrant more attention than lower probability patterns.
2. Confirmation Tool
The indicator works well when combined with other technical analysis methods:
- Support/resistance levels
- Trend line breaks
- Divergences on oscillators
- Volume analysis
3. Risk Management
The built-in success rate metrics help traders properly size positions based on historical pattern reliability. The displayed percentages reflect the probability of the pattern successfully predicting a reversal.
Optimized Settings
Based on extensive testing, the default parameters (Body: 40%, Shadow: 60%, Shadow Maximums: 10%, Lookback: 2) provide the optimal balance between:
- Signal frequency
- False positive reduction
- Early entry opportunities
- Pattern clarity
Users can adjust these parameters based on their timeframe and trading style, but the defaults represent the statistically optimal configuration.
Complementary Research: Reclaim Analysis
Additional research on "reclaim" scenarios (where price briefly breaks a level before returning) showed:
- Fast reclaims (1-2 candles) have 70-90% success rates
- Reclaims with increasing volume have 53.1% success rate vs. decreasing volume at 22.6%
This complementary research reinforces the importance of candle patterns and timing at critical market levels.

Ultimate MA & PSAR [TARUN]Overview
This indicator combines a customizable Moving Average (MA) and Parabolic SAR (PSAR) to generate precise long and short trade signals. A dashboard displays real-time trade conditions, including signal direction, entry price, stop loss, and PnL tracking.
Key Features
✅ Customizable MA Type & Period – Choose between SMA or EMA with adjustable length.
✅ Adaptive PSAR Settings – Modify start, increment, and max step values to fine-tune stop levels.
✅ Trade Signal Logic – Identifies potential buy (long) and sell (short) opportunities based on:
Price action relative to MA
MA trend direction (rising or falling)
PSAR confirmation
✅ Dynamic Stop Loss Calculation – Uses lowest low/highest high over a specified period for stop loss placement.
✅ Trade State & Reversal Handling – Manages active trades, pending signals, and stop loss exits dynamically.
✅ PnL & Dashboard Table – Displays real-time signal status, entry price, stop loss, and profit/loss (PnL) in an easy-to-read format.
How It Works
1.Buy (Long) Condition:
MA is rising
Price is above the MA
PSAR is below price
2.Sell (Short) Condition:
MA is falling
Price is below the MA
PSAR is above price
3.Stop Loss Handling:
For long trades → stop loss is set at the lowest low of the last X candles
For short trades → stop loss is set at the highest high of the last X candles
4.Trade Execution & PnL Calculation:
If a valid long/short setup is detected, a pending signal is placed.
On the next bullish (for long) or bearish (for short) candle, the trade is confirmed.
Real-time PnL updates help track trade performance.
Customization Options
🔹 Moving Average: SMA or EMA, adjustable period
🔹 PSAR Settings: Start, Increment, Maximum step values
🔹 Stop Loss Lookback: Choose how many candles to consider for stop loss placement
🔹 Dashboard Positioning: Select preferred display location (top/bottom, left/right)
🔹 Trade Signal Selection: Enable/Disable Long and Short signals individually
How to Use
Add the indicator to your chart.
Customize the MA & PSAR settings according to your trading strategy.
Follow the dashboard signals for trade setups.
Use stop loss levels to manage risk effectively.
Disclaimer
⚠️ This indicator is for educational purposes only and does not constitute financial advice. Always perform proper risk management and backtesting before using it in live trading.

Trapped Traders Order BlocksHow It Works
The Trapped Traders Order Blocks indicator identifies specific price action patterns that suggest large market participants ("big money") have been trapped in losing positions after significant price sweeps, creating potential opportunities for reversals. The indicator detects both "bullish trap blocks" (where bearish traders are trapped) and "bearish trap blocks" (where bullish traders are trapped). Here’s the step-by-step process for each:
Bullish Trap Block (Bears Trapped):
A bearish candle (Candle A) must sweep the high of the previous candle (Candle B), meaning its high exceeds the high of the prior candle.
This bearish candle must have a longer upper wick than its lower wick, indicating rejection of higher prices.
The candle must not be a doji (i.e., it must have a significant body, defined as the body being at least 10% of the candle's range).
The next candle (Candle C) must close above the body of the bearish candle (Candle A), suggesting that price has immediately moved against the bearish sweep, potentially trapping bearish traders who entered short positions expecting a downward move.
The body of the bearish candle (Candle A) is marked as a "bullish trap block." A box is drawn around this candle's body, and a label ("Bullish Trap") is placed below it.
Bearish Trap Block (Bulls Trapped):
A bullish candle (Candle A) must sweep the low of the previous candle (Candle B), meaning its low is below the low of the prior candle.
This bullish candle must have a longer lower wick than its upper wick, indicating rejection of lower prices.
The candle must not be a doji.
The next candle (Candle C) must close below the body of the bullish candle (Candle A), suggesting that price has immediately moved against the bullish sweep, potentially trapping bullish traders who entered long positions expecting an upward move.
The body of the bullish candle (Candle A) is marked as a "bearish trap block." A box is drawn around this candle's body, and a label ("Bearish Trap") is placed above it.
Dynamic Box Extension:
For both bullish and bearish trap blocks, the box extends dynamically to the current bar unless it exceeds a user-defined age (default is 52 bars), at which point it stops at the maximum age.
Sweep Detection:
Bullish Sweep (of any trap block, bullish or bearish):
The current candle's open is above the top of the box.
The low is below the top of the box.
The close is above the top of the box.
The lower wick is longer than the upper wick (indicating rejection of lower prices).
The close is above 50% of the candle's range (ensuring a strong bullish bias).
When a bullish sweep occurs, a label ("Bullish Sweep") is placed at the low of the candle, pointing upward, and an alert is triggered.
Bearish Sweep (of any trap block, bullish or bearish):
The current candle's open is below the bottom of the box.
The high is above the bottom of the box.
The close is below the bottom of the box.
The upper wick is longer than the lower wick (indicating rejection of higher prices).
The close is below 50% of the candle's range (ensuring a strong bearish bias).
When a bearish sweep occurs, a label ("Bearish Sweep") is placed at the high of the candle, pointing downward, and an alert is triggered.
When to Be Used
The Trapped Traders Order Blocks indicator is best used in the following scenarios:
Reversal Trading:
Use this indicator to identify potential reversal points in the market. Bullish trap blocks suggest that trapped bears may unwind their short positions, leading to a potential bullish move. Bearish trap blocks suggest that trapped bulls may unwind their long positions, leading to a potential bearish move.
Look for sweeps of these blocks as confirmation of a directional move. A bullish sweep indicates a potential upward move, while a bearish sweep indicates a potential downward move.
Range-Bound Markets:
In sideways or ranging markets, trapped blocks can highlight key levels where large players have been caught off-guard. These levels often act as support or resistance, and a sweep of the block can signal a breakout or continuation in the direction of the sweep.
Confluence with Other Indicators:
Combine the trapped blocks with other technical analysis tools, such as support/resistance levels, Fibonacci retracements, or volume analysis, to increase the probability of a successful trade. For example, a bullish trap block near a strong support level with a bullish sweep can provide a high-probability setup for a long position, while a bearish trap block near a strong resistance level with a bearish sweep can signal a short opportunity.
Timeframes:
The indicator is most effective on higher timeframes such as 1-day (1D), 1-week (1W), and 1-month (1M) charts. These timeframes are more likely to capture significant moves involving large market participants, reducing noise and false signals compared to lower timeframes. While it can be used on lower timeframes (e.g., 1-hour or 4-hour), the signals may be less reliable due to increased market noise.
Logic Behind It
The logic behind the Trapped Traders Order Blocks indicator is rooted in market psychology and the behavior of large market participants ("big money"). When a large sweep candle occurs where price spikes in one direction but then quickly reverses it often indicates that traders have entered positions in the direction of the sweep, expecting a continuation. However, if the price immediately moves against them, these traders are now trapped in losing positions.
Bullish Trap Block (Bears Trapped):
A large bearish sweep candle (spiking upward but closing lower) suggests that bearish traders (bears) have entered short positions at the top of the move, expecting a downward continuation. If the next candle closes above the bearish candle's body, these bears are trapped in losing positions.
The body of the bearish candle becomes a "bullish trap block" because the trapped bears are likely to have placed their stop-loss orders or break-even exit orders just above the high of the sweep candle or within the body of the candle. As price revisits this level in the future, these trapped traders may attempt to unwind their positions by buying back their shorts, which can drive the price higher. This unwinding process often attracts new buyers, leading to a potential bullish reversal or continuation.
The bullish sweep conditions (e.g., close > box top, longer lower wick, and close above 50% of the range) ensure that the price action at the block level shows strong bullish momentum and rejection of lower prices, confirming the potential for a move higher.
Bearish Trap Block (Bulls Trapped):
A large bullish sweep candle (spiking downward but closing higher) suggests that bullish traders (bulls) have entered long positions at the bottom of the move, expecting an upward continuation. If the next candle closes below the bullish candle's body, these bulls are trapped in losing positions.
The body of the bullish candle becomes a "bearish trap block" because the trapped bulls are likely to have placed their stop-loss orders or break-even exit orders just below the low of the sweep candle or within the body of the candle. As price revisits this level in the future, these trapped traders may attempt to unwind their positions by selling their longs, which can drive the price lower. This unwinding process often attracts new sellers, leading to a potential bearish reversal or continuation.
The bearish sweep conditions (e.g., close < box bottom, longer upper wick, and close below 50% of the range) ensure that the price action at the block level shows strong bearish momentum and rejection of higher prices, confirming the potential for a move lower.
Summary
Bullish Trap Block: Occurs when bears get trapped after a bearish sweep candle is immediately followed by a bullish candle, indicating a potential reversal as trapped bears may unwind their positions.
Bearish Trap Block: Occurs when bulls get trapped after a bullish sweep candle is immediately followed by a bearish candle, indicating a potential bearish reversal.
Use Case: Ideal for identifying reversal opportunities, especially in range-bound markets or at key support/resistance levels on higher timeframes like 1D, 1W, and 1M, and can be combined with other indicators for confluence.
Logic: Large sweep candles followed by an immediate reversal suggest that big money has been trapped, and these traders may unwind their positions at break-even in the near future, driving price in the opposite direction of their initial trade.
This indicator provides a visual and actionable way to identify these trapped trader scenarios, with customizable settings for box display, sweep visuals, and alerts to help traders capitalize on these opportunities, particularly on higher timeframes where the signals are most reliable.

Rolling Cumulative Volume DeltaRolling CVD is your market’s lie detector no resets, just raw volume truth! checks: close > open? Add volume (buyers flexing). Close < open? Subtract it (sellers sulking). Ties = zero. It rolls forever, plotting the vibe.
Use it when price fakes you out rising but CVD dips? Trouble. Dropping but CVD climbs? Sneaky strength. Perfect for scalpers sniffing momentum, swing traders riding waves, or that volume-obsessed buddy who overanalyses everything!
Shines best on timeframes under 15m to catch those sneaky price fibs in action!
Don’t bet your lunch money on Rolling CVD alone, you wild child! Pair it with your fave indicators RSI, moving averages, tea leaves, whatever because confluence is king. It’s a sly hint, not a crystal ball, so trade smart or the market’ll spank ya!

Heikin-Ashi Trend ScalpHeikin-Ashi Trend Scalp is an indicator for TradingView, designed to identify short-term trends and entry points based on Heikin-Ashi candles and EMA crossovers.
Key Features:
Attention Signals: Early warning of potential entry points.
Buy/Sell Signals: Filtered signals based on the prevailing trend.
Filters (Slow Mode, Shadow Filter): Help reduce the number of false signals.
Shadow Filter: Eliminates false signals caused by shadows against the trend.
The warning bar should not have any shadow against the trend.
If the bar with the buy/sell signal has a shadow that crosses the opening level of the warning bar, the signal disappears.
Since the signal may disappear as the candle forms, entries should only be made after the signal has been confirmed.
It is not recommended to disable the Shadow Filter, as doing so may lead to an increase in false signals.
Slow Mode: Reduces false signals by using longer-term EMA crossovers. For timeframes of 1–5 minutes, it is recommended to use Slow Mode to reduce false signals.
EMA Lines (7, 21, 50): Displayed for trend determination. Depending on the selected mode: in standard mode, EMA 21 (fast) is shown, in Slow Mode, the longer-term EMA 50 (slow) is displayed.
Stop-Loss Price: Automatically set at the opening level of the candle two bars ago and displayed on the chart.
RSI: Displays the current value of the RSI indicator and visualizes it with color:
Red — for overbought conditions (above 70).
Green — for oversold conditions (below 30).
Yellow — for values in the neutral zone (between 30 and 70).
Alerts: Notifications for new signals in real-time.
The indicator is ideal for scalping and short-term trading, especially when used in conjunction with other technical analysis tools.

Trend Heuristics (+Signals)Trend Heuristics - Enhanced Rolling VWAP with Smart Signals
This indicator is an enhanced version of the Rolling VWAP (RVWAP) concept, originally based on PineCoders' ConditionalAverages library. It combines volume-weighted average price analysis with advanced signal detection for both sweeps and breakouts.
Core Features
1. Rolling VWAP System
- Implements a dynamic rolling VWAP that adapts to different timeframes
- Includes standard deviation bands for volatility measurement
- Offers flexible time period settings (fixed or auto-adjusting)
- Provides customizable visual elements including bands and fills
2. Dual Signal System
Sweep Signals
Detects high-probability reversal points with these conditions:
- Bullish Sweep:
- Opens above upper band
- Tests below upper band (low)
- Closes above upper band
- Shows stronger lower wick
- Closes above previous high
- Has favorable close position (upper 50% of candle)
- Bearish Sweep:
- Opens below lower band
- Tests above lower band (high)
- Closes below lower band
- Shows stronger upper wick
- Closes below previous low
- Has favorable close position (lower 50% of candle)
Breakout Signals
Identifies potential trend changes with these conditions:
- Bullish Breakout:
- Opens below VWAP
- Closes above upper band
- Indicates strong momentum shift upward
- Bearish Breakout:
- Opens above VWAP
- Closes below lower band
- Indicates strong momentum shift downward
Technical Details
Base Components
- Built upon PineCoders' ConditionalAverages library
- Incorporates custom alert system via CustomAlertLib
- Uses standard deviation for band calculations
Customization Options
- Adjustable standard deviation multiplier
- Flexible time period settings
- Independent controls for sweep and breakout signals
- Customizable visual elements (colors, sizes, positions)
- Custom alert message formatting
Use Cases
1. Trend Following:
- Use VWAP as dynamic support/resistance
- Monitor breakout signals for trend changes
2. Mean Reversion:
- Use sweep signals for counter-trend opportunities
- Standard deviation bands for range identification
3. Volume Analysis:
- VWAP provides volume-weighted price levels
- Helps identify significant price levels
Notes
- Best performed on liquid instruments with consistent volume
- Most effective on timeframes from 1hours to 4 hours and 1D, anything greater isn't very good
- Recommended to use in conjunction with other technical analysis tools
- Signals can be filtered based on higher timeframe trends
Credits
- Original Rolling VWAP concept by PineCoders
Trend Trader-RemasteredThe script was originally coded in 2018 with Pine Script version 3, and it was in invite only status. It has been updated and optimised for Pine Script v5 and made completely open source.
Overview
The Trend Trader-Remastered is a refined and highly sophisticated implementation of the Parabolic SAR designed to create strategic buy and sell entry signals, alongside precision take profit and re-entry signals based on marked Bill Williams (BW) fractals. Built with a deep emphasis on clarity and accuracy, this indicator ensures that only relevant and meaningful signals are generated, eliminating any unnecessary entries or exits.
Key Features
1) Parabolic SAR-Based Entry Signals:
This indicator leverages an advanced implementation of the Parabolic SAR to create clear buy and sell position entry signals.
The Parabolic SAR detects potential trend shifts, helping traders make timely entries in trending markets.
These entries are strategically aligned to maximise trend-following opportunities and minimise whipsaw trades, providing an effective approach for trend traders.
2) Take Profit and Re-Entry Signals with BW Fractals:
The indicator goes beyond simple entry and exit signals by integrating BW Fractal-based take profit and re-entry signals.
Relevant Signal Generation: The indicator maintains strict criteria for signal relevance, ensuring that a re-entry signal is only generated if there has been a preceding take profit signal in the respective position. This prevents any misleading or premature re-entry signals.
Progressive Take Profit Signals: The script generates multiple take profit signals sequentially in alignment with prior take profit levels. For instance, in a buy position initiated at a price of 100, the first take profit might occur at 110. Any subsequent take profit signals will then occur at prices greater than 110, ensuring they are "in favour" of the original position's trajectory and previous take profits.
3) Consistent Trend-Following Structure:
This design allows the Trend Trader-Remastered to continue signaling take profit opportunities as the trend advances. The indicator only generates take profit signals in alignment with previous ones, supporting a systematic and profit-maximising strategy.
This structure helps traders maintain positions effectively, securing incremental profits as the trend progresses.
4) Customisability and Usability:
Adjustable Parameters: Users can configure key settings, including sensitivity to the Parabolic SAR and fractal identification. This allows flexibility to fine-tune the indicator according to different market conditions or trading styles.
User-Friendly Alerts: The indicator provides clear visual signals on the chart, along with optional alerts to notify traders of new buy, sell, take profit, or re-entry opportunities in real-time.

Options Series - Supertrend, HalfTrend, Ichimoku Cloud and P_SAR➤ Supertrend:
➤ HalfTrend:
➤ Ichimoku Cloud:
➤ Parabolic SAR:
⭐ Overview and How It Works:
This script combines multiple popular technical indicators—Supertrend, HalfTrend, Ichimoku Cloud, and Parabolic SAR—into a single, cohesive tool for analyzing price trends and reversals. Designed for traders who prefer multi-layered confirmation, it displays non-overlay signals in a candlestick format, helping users make sense of intricate market dynamics. It also includes a "Master Candle" condition, which aggregates the signals from all indicators, providing a powerful snapshot of market sentiment.
References for study,
Supertrend and HalfTrend and Ichimoku Cloud and Parabolic SAR
⭐ Key Features and Functionality:
The script integrates four indicators and visually represents them in a non-overlay fashion, meaning that each indicator's signal appears on separate candlestick layers. It uses color coding to differentiate between bullish and bearish signals. The Master Candle is a unique feature that aggregates the signals from all indicators to show the overall sentiment.
Supertrend: It uses ATR and a multiplier factor to create a trailing stop, identifying bullish and bearish trends.
HalfTrend: It analyzes market volatility that provides buy and sell signals based on volatility channels and historical highs and lows.
Ichimoku Cloud: It leverages historical highs and lows to form the conversion and baseline, which are compared to assess market strength.
Parabolic SAR: A stop-and-reverse system that highlights potential reversals. It is based on time and price, offering traders potential reversal points.
Master Candle: It computes a score based on the confluence of all four indicators, adding another layer of confirmation.
🎨 Visualizations and User Experience:
The script's user interface is highly visual, with color-coded candlesticks plotted across multiple layers. Each indicator has its own color coding for bullish and bearish signals, ensuring clarity:
➤ Green for bullish signals.
➤ Red for bearish signals.
➤ Each candlestick layer represents a different indicator (e.g., Supertrend, HalfTrend, etc.), making it easy for the trader to isolate and interpret signals.
➤ The "Master Candle" provides an overarching view of the market by displaying a consolidated signal, which can reduce confusion from mixed indicator signals.
⭐ Settings and Customization:
The script is highly customizable, allowing users to adjust the settings for each indicator. Key customizable parameters include:
• Supertrend ATR Period and Factor
• HalfTrend Amplitude and Channel Deviation
• Ichimoku Conversion, Base, and Lagging Span Periods
• Parabolic SAR Start, Increment, and Maximum value
Additionally, users can toggle the visibility of each indicator and customize the look of the plot to suit their preferences.
⭐ Uniqueness of the Concept:
No repaints. This is the advanced representation and the combination of multiple indicators into a single script, along with a powerful "Master Candle" that aggregates them, makes this tool unique. Most scripts provide isolated indicator signals, while this one brings together four powerful indicators and visually simplifies the analysis. The non-overlay style and color-coded candlesticks offer traders an easy-to-understand, actionable visual cue, which stands out from traditional indicator overlays.
🚀 Conclusion:
This script is a comprehensive, multi-indicator trading tool suitable for traders looking for reliable trend-following and reversal detection. Its ability to provide an aggregated "Master Candle" signal reduces noise and aids in better decision-making. Customization options allow users to tailor it to their trading style, while its clear visualizations provide an excellent user experience.

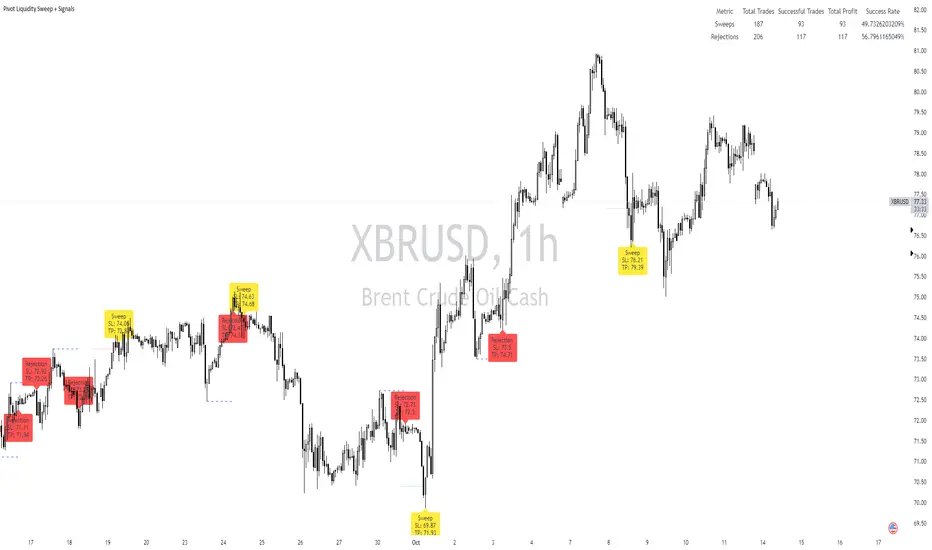
Pivot Liquidity Sweep + SignalsCore Functionalities:
Sweep Signals:
The indicator identifies sweeps of liquidity by detecting when price exceeds recent pivot highs (swing highs) or pivot lows (swing lows) and then reverses direction. It draws attention to these scenarios by labeling them on the chart.
For bullish sweep signals, the entry point is the closing price of the sweep candle, with the stop loss placed at the highest point between the sweep candle and the previous candle.
For bearish sweeps, the entry point is similarly identified, with the stop loss being the lowest price of the sweep candle and the candle before it. The profit target is dynamically set to the low or high of the closest valid pivot depending on the direction of the trade.
Rejection Signals:
Rejection signals are identified when price attempts to break a pivot high or low but fails, causing a rejection.
Bullish rejections involve price trying to break a pivot low but closing back above it, indicating potential for a bounce.
Bearish rejections follow a similar pattern, with price attempting to break a pivot high but failing to hold above it, signaling a potential bearish move.
High-Precision Intrabar Data:
The "Intrabar Precision" feature allows the indicator to use lower timeframe data to accurately plot sweeps and rejections, providing traders with precise entry and exit points.
The intrabar settings are particularly useful for traders looking for high-precision trades, such as scalpers who want to capture small yet consistent moves.
ATR and Percentage-Based Filters:
The indicator allows for customizable filters to ensure signals meet certain thresholds before being validated. Traders can use ATR (Average True Range) or percentage-based conditions to filter out low-quality signals, ensuring that the trades captured have enough volatility or price movement potential.
Dashboard:
The built-in dashboard provides a quick overview of trades executed using the indicator, displaying metrics such as the total number of sweep and rejection trades, their success rates, and total profit in points.
The dashboard is color-coded for easy reading and offers traders insights into the overall performance of their strategy, helping with ongoing evaluation and optimization.
Labeling and Alerts:
Every time a sweep or rejection signal is detected, the indicator automatically labels the chart to help traders quickly identify the trading opportunities.
Alerts are also generated for each trading signal, providing the trader with real-time notifications, which can be useful for those who are not constantly monitoring their charts.
Stop Loss and Target Adaptation:
The stop loss levels are adjusted dynamically based on the recent pivot points, and the target profit is derived from valid subsequent pivot levels to ensure realistic and efficient trade exits.
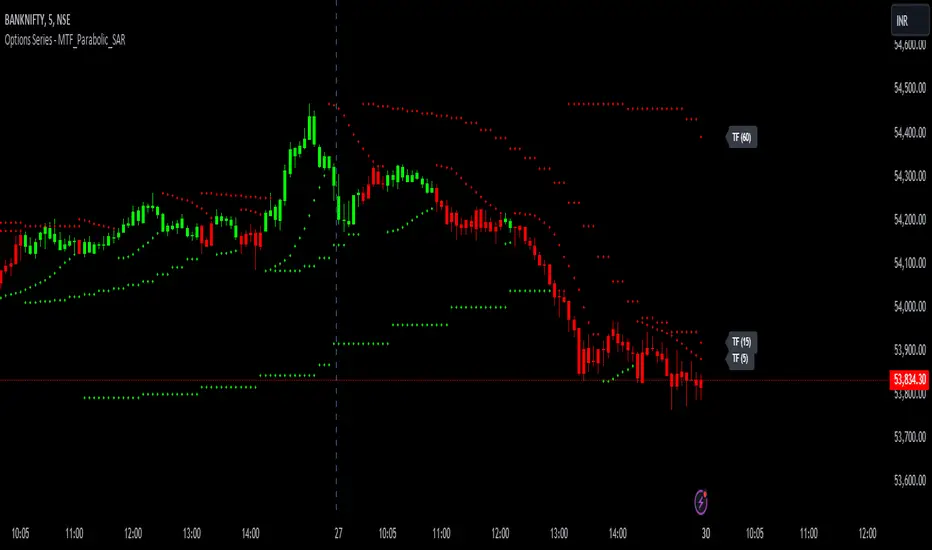
Options Series - MTF_Parabolic_SAR
⭐ Purpose of the Script
This script, titled "Options Series - MTF_Parabolic_SAR," is designed for analyzing price trends using the Parabolic SAR (Stop and Reverse) indicator across multiple timeframes (MTF). It dynamically highlights bullish and bearish conditions, helping traders identify trends with improved accuracy. The script uses the Parabolic SAR across three customizable timeframes (default: 5, 15, and 60 minutes) to gauge the market sentiment.
⭐ Key Features and Insights:
Multi-Timeframe Parabolic SAR: The script calculates the Parabolic SAR for three different timeframes ( input_tf_1 , input_tf_2 , and input_tf_3 ). Traders can configure these timeframes to match their trading style (e.g., intraday, swing).
The SAR plots adapt to the selected timeframe, helping traders see different perspectives of price movement, such as short-term and long-term trends.
Bullish and Bearish Conditions: The script determines bullish and bearish conditions by comparing the close price against the Parabolic SAR in each timeframe.
If at least one timeframe indicates a bullish condition (close price above SAR), the bars are colored green . Conversely, if one timeframe signals bearish conditions (close below SAR), the bars turn red .
This provides an at-a-glance view of the price trend across multiple timeframes, offering insights into the market's strength and direction.
Visual Enhancements: Bar Coloring: Bars are visually enhanced with a color scheme: green for bullish , red for bearish , and gray for neutral conditions. This makes it easy to spot market trends and reversals directly on the chart. Candle Plotting: The current candle is plotted with the corresponding color and labeled with the SAR values for each timeframe. This aids traders in tracking real-time price action.
Labeling of SAR Values: The script displays SAR values for each timeframe as floating labels next to the chart. These labels contain the timeframe and the exact SAR value, making it easier to reference without cluttering the chart.
⭐ Trading Advantages: Customizable and Adaptive: The customizable timeframes and SAR settings allow traders to adapt the script to various market conditions and their specific trading strategies. This flexibility provides a powerful tool for identifying entry and exit points. Multi-Timeframe Insights: By considering multiple timeframes, the script offers a comprehensive market view, making it easier to confirm strong trends and avoid false signals.
⭐ How It Helps Traders: Trend Identification: By visualizing Parabolic SAR across multiple timeframes, traders can quickly assess trend strength and direction. Reversal Detection: The script's color changes (green to red or vice versa) signal potential trend reversals, offering critical information for managing trades and reducing risk.
🚀 Conclusion:
This script provides traders with a multi-timeframe analysis tool for identifying trends and potential reversals using the Parabolic SAR. By offering customizable timeframes, clear visual cues, and SAR value labeling, it simplifies decision-making and enhances market insights.
Options Series - P_SAR And Supertrend
The provided PineScript combines two well-known indicators—Parabolic SAR (P_SAR) and Supertrend—to create a comprehensive trading tool. Here are some powerful insights and the importance of this script:
⭐ 1. Supertrend Indicator:
What it does: The Supertrend indicator is based on the Average True Range (ATR) and is used to identify trend direction. When the price is above the Supertrend line, it suggests an uptrend, and when below, a downtrend.
Insights:
Trend Following: By adjusting the ATR length (atrPeriod) and the multiplier (factor), you can fine-tune the sensitivity of the Supertrend. A smaller ATR or factor results in more frequent trend changes, whereas larger values make the indicator more robust but slower to react.
Trend Visualization: The script highlights trends with the help of green and red lines, offering a clear visual cue for traders. The uptrend is filled with a translucent green and the downtrend with red, allowing quick identification of market momentum.
⭐ 2. Parabolic SAR (P_SAR):
What it does: The Parabolic SAR is a time/price-based indicator that helps identify potential reversals in the market. The dots (SAR) follow the price and move closer to it as the trend progresses.
Insights:
Trailing Stops: This is commonly used by traders to trail stop losses, as the SAR moves closer to price as the trend strengthens.
Combining with Supertrend: The SAR dots in this script act as an additional confirmation for trend direction. For instance, when the price is above both the SAR and Supertrend, it strongly suggests an uptrend.
⭐ 3. Bar Coloring Based on Trend Confirmation:
What it does: The script calculates conditions based on whether the price is above or below both the Supertrend and SAR values.
Insights:
Bullish/Bearish Confirmation: The combination of these two indicators provides a stronger confirmation of trend direction compared to using either one alone. For example:
Green Bars: If the price is above both the Supertrend and SAR, it signals a strong uptrend (bullish).
Red Bars: If the price is below both, it suggests a strong downtrend (bearish).
Visual Alerts: The candle colors are adjusted based on these conditions, providing a quick visual alert for traders to take action.
⭐ 4. Importance of Using Both Supertrend and P_SAR:
Multiple Confirmations: Combining the Supertrend and Parabolic SAR increases the accuracy of trend-following strategies. Each indicator has its strengths: Supertrend is good for identifying the overall trend, while the SAR excels at identifying potential reversals.
Risk Management: This script can help you not only identify trends but also manage your positions more effectively. The Parabolic SAR, for example, can serve as a dynamic stop-loss level, while the Supertrend can help you stay in trades longer by smoothing out noise in the market.
⭐ 5. Customizable Inputs:
Adaptability: The user can adjust the ATR period, factor, start, increment, and maximum values, tailoring the script to different market conditions and timeframes. This flexibility is essential, as each asset class or market may require different parameter settings.
⭐ 6. Practical Application in Trading:
Entry and Exit Signals: The script can be used to generate entry and exit signals. For instance:
Buy Signal: When the bar turns green (price is above Supertrend and SAR), it could be a signal to go long.
Sell Signal: When the bar turns red (price is below Supertrend and SAR), it could be a signal to go short or exit a long position.
Stop-Loss Placement: The Parabolic SAR dots can act as trailing stop-loss levels, helping traders lock in profits as trends progress.
Trend Continuation vs. Reversal: The Supertrend provides a broader view of the trend, while the Parabolic SAR provides pinpoint entry/exit signals for reversals.
🚀 Conclusion:
This script is a robust combination of trend-following and reversal indicators, making it a versatile tool for traders. The dual confirmation from Supertrend and Parabolic SAR reduces false signals, and the color-coded bars provide quick insights into market conditions. When used properly, this can greatly improve your ability to catch trends early, exit at the right moment, and manage risk effectively.

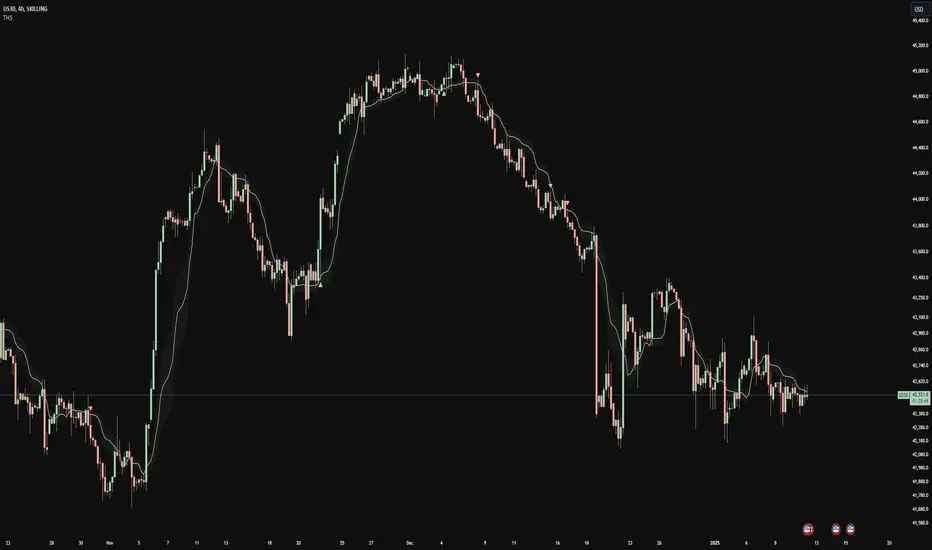
Kalman PSaR [BackQuant]Kalman PSaR
Overview and Innovation
The Kalman PSaR combines the well-known Parabolic SAR (PSaR) with the advanced smoothing capabilities of the Kalman Filter . This innovative tool aims to enhance the traditional PSaR by integrating Kalman filtering, which reduces noise and improves trend detection. The Kalman PSaR adapts dynamically to price movements, making it a highly effective indicator for spotting trend shifts while minimizing the impact of false signals caused by market volatility.
Please Find the Basic Kalman Here:
Kalman Filter Dynamics
The Kalman Filter is a powerful algorithm for estimating the true value of a system amidst noisy data. In the Kalman PSaR, this filter is applied to the high, low, and closing prices, resulting in a smoother and more accurate representation of price action. The filter’s parameters—process noise and measurement noise—are customizable, allowing traders to fine-tune the sensitivity of the indicator to market conditions. By reducing the impact of noise, the Kalman-filtered PSaR offers clearer signals for identifying trend reversals and continuations.
Enhanced PSaR Calculation
The traditional Parabolic SAR is a popular trend-following indicator that highlights potential entry and exit points based on price acceleration. In the Kalman PSaR, this calculation is enhanced by the Kalman-filtered prices, providing a smoother and more reliable signal. The indicator continuously updates based on the acceleration factor and max step values, while the Kalman filter ensures that sudden price spikes or market noise do not trigger false signals.
Min Step and Max Step: These settings control the sensitivity of the PSaR. The Min Step sets the initial acceleration factor, while the Max Step limits how fast the PSaR adapts to price changes, helping traders fine-tune the indicator’s responsiveness.
Optional Smoothing Techniques To further enhance the signal clarity, the Kalman PSaR includes an optional smoothing feature. Traders can choose from various smoothing methods, such as SMA, Hull, EMA, WMA, TEMA, and more, to reduce short-term fluctuations and emphasize the underlying trend. The smoothing period is customizable, allowing traders to adjust the indicator’s behavior according to their preferred trading style and timeframe.
Color-Coded Candle Painting The Kalman PSaR features color-coded candles that change according to the trend direction. When the price is above the PSaR, candles are painted green to indicate a long trend, and when the price is below the PSaR, candles are painted red to signal a short trend. This visual representation makes it easy to interpret market sentiment at a glance, improving decision-making speed during fast-moving markets.
Key Features and Customization
Kalman Filter Customization: The process noise and measurement noise parameters allow traders to adjust how aggressively the filter adapts to price changes, making it suitable for both volatile and stable markets.
Smoothing Options: A variety of moving average types, such as SMA, Hull, EMA, and more, can be applied to smooth the PSaR values, ensuring that the signal remains clear even in choppy markets.
Dynamic Trend Detection: The Kalman PSaR dynamically updates based on price movements, helping traders spot trend reversals early while filtering out false signals caused by short-term volatility.
Bar Coloring and PSaR Plotting: Traders can choose to color candles based on trend direction or plot the PSaR directly on the chart for additional visual clarity.
Practical Applications
Trend-Following Strategies: The Kalman PSaR excels in trend-following strategies by providing timely signals of trend changes. The dynamic nature of the indicator allows traders to capture significant price movements while avoiding market noise.
Reversal Identification: The indicator’s ability to filter out noise and provide smoother signals makes it ideal for identifying reversals in volatile markets.
Risk Management: By plotting clear stop levels based on the PSaR, traders can use this indicator to effectively manage risk, placing stop-loss orders at key points based on the trend direction.
Conclusion
The Kalman PSaR is a fusion of the classic Parabolic SAR and the Kalman filter, offering enhanced trend detection with reduced noise. Its customizable filtering and smoothing options, combined with dynamic trend-following capabilities, make it a versatile tool for traders seeking to improve their timing and signal accuracy. The adaptive nature of the Kalman filter, combined with the robust PSaR logic, helps traders stay on the right side of the market and manage risk more effectively.

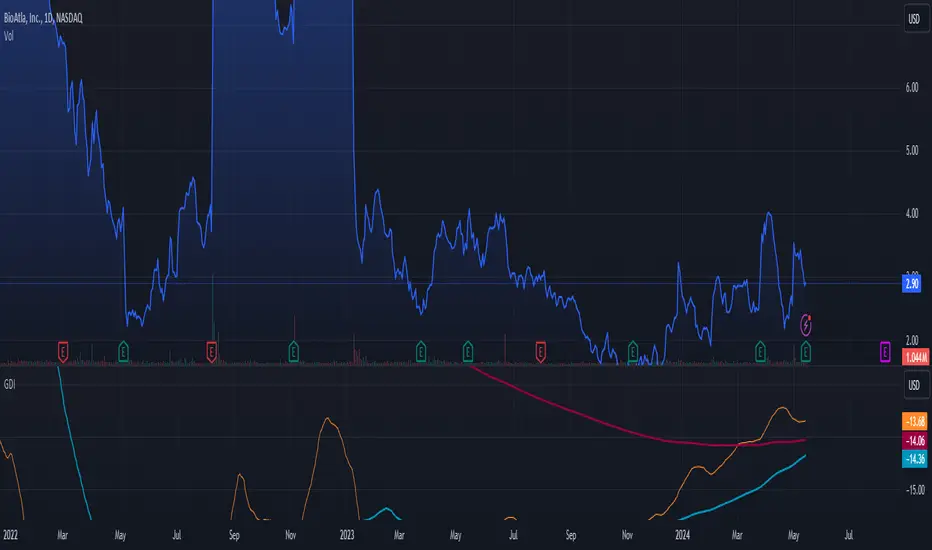
Growth/Delcline IndexAbout:
The Growth/Decline Index is a "parabolic sar" based indicator that mainly has two functions. The first function is to display when price growth or price decline will occur by displaying increases or decreases of the GDI and inflection points. The second function is to rate a stock's performance based on how high or low the digits display the GDI. If the digits read positively, high values then the stock is expected to have growth, and if the digits read negatively, low values then the stock is expected to decline. Remember when looking at the GDI you want to look at both long (yearly) and short(daily) readings to get a better confirmation of trend. The GDI also has short(orange), medium(blue), long(red), readings. The reason why there are three readings is to try to pinpoint buy or selling signals to try to maximize profit. Here is an example of ticker MSFT. As you can see MSFT is reaching long values up to 19! That means that the stock is still in long term growth.
Or how about PEGY having consistent negative values after 2021:
No matter the stock GDI will always be there to help you identify trends, and stock rating.
Want to trade short term? Easy, look at you short values and determine if they are increasing or decreasing.
Be advised:
Please stay in caution when reading the GDI.
Be advised:
The GDI is a new indicator and further behavior analysis such as concave up/down, inflection points, cross over points, divergence/convergence, and minimized/maximized points has to be taken into consideration in order to confirm more precise trends. Also remember that the GDI is a trend tracker and cannot pre identify sudden, large jumps or drops.
-Recommendations/estimates
values for buying: -15 and above
values for short selling -15 and below
What to look for:
Good dips can be found when the medium (blue) line cross from the top downward to the long (red) line and short (orange line) is minimized. (Please keep a look for long term trends)
Or when the short (orange) line has crossed from the top downward to both medium(blue) and long(red) lines.
Remember that this may not be 100% of the case looking for convergence and divergence between the blue and red lines also helps as well as the stock rating and also checking for both long term and short-term readings.
Good peaks can be found when the orange line has greatly exceeded the blue line and has peaked. (also looking at the trend of the blue line helps)
More things can be added and modified to the GDI to make it a cutting-edge indicator.
Have fun. :)