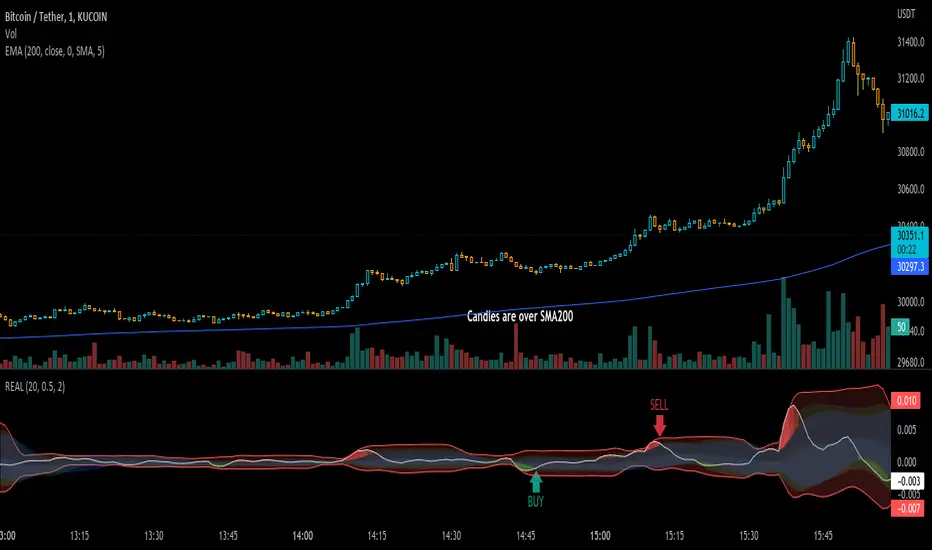
Real IndicatorReal indicator is an indicator to convert ohlcv charts to one oscilator!
there is an effective thing in all charts: "Volume", and I used this thing to mix it by price
Buy: on crossing above to Bollinger-lower-band (on Up-trends)
Sell: on crossing under Bollinger-upper-band (on Down-Trends)
use an SMA-200 to determine trends ;)
Pivot
Heikin Ashi OscillatorThis indicator plots a delta between the Heiken Ashi close price and the regular candlestick closing price as a histogram, which allows you to quickly analyse changes in trend
direction.
It also provides a reverse-engineered closing price for regular candlesticks, to reach in order to maintain the momentum, which allows you to be forewarned of potential pivot points to change in bias in direction.
Feel free to use this indicator to modify and add to your charts as you wish.

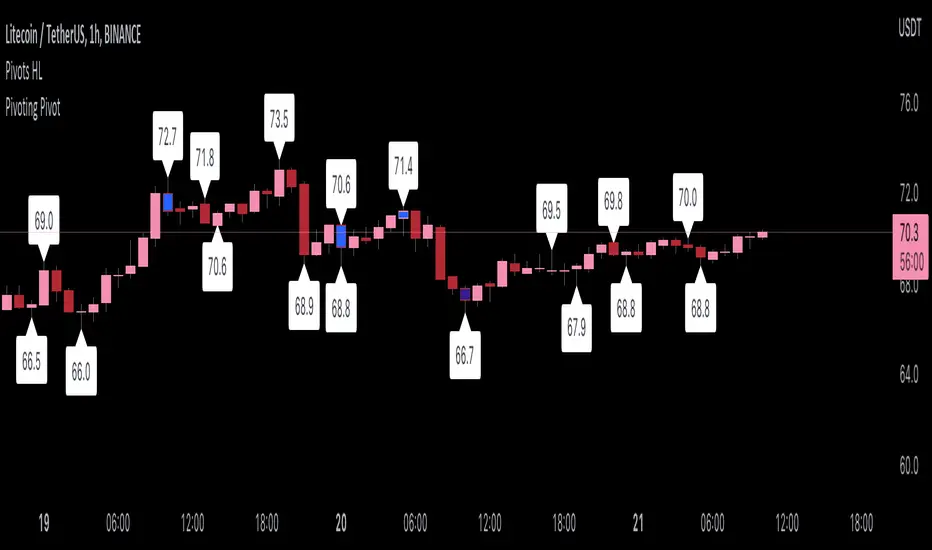
Pivoting PivotMany people use Pivots when conducting analysis, but I don't see many people using pivoting pivots. Pivoting pivots are pivots that don't have any other pivots around them. They can be useful when trying to separate pivot clusters from important pivot points.
The code is calculated by finding the distance between two candlesticks (left check), then calculating the distance between the last pivot and the current candlestick.
On the chart: labels are TradingView's official pivot high and pivot low script, and the blue candle color is my pivoting pivots (both with a look left and look right of 2).
Special thanks to @fikira for helping me with ideas for the calculations!
CPR by Hindustani Sandeep MalikThis script is based on the Secret of Pivot Boss book by Frank Ochoa.
You can view the Daily timeframe CPR/s1-s5 support/r1-r5 resistance.
You can view the Weekly timeframe CPR/s1 support/r1 resistance.
You can view the Monthly timeframe CPR/s1 support/r1 resistance.

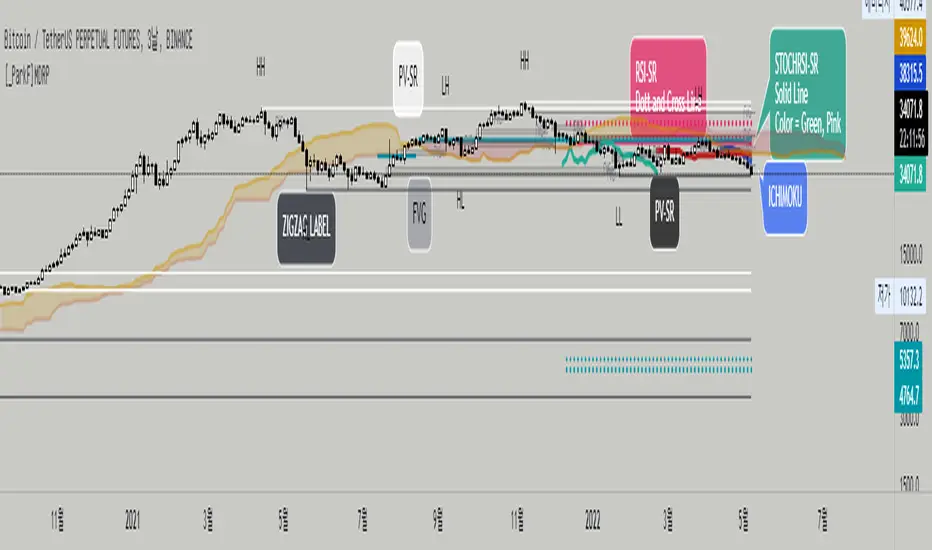
[_ParkF]MDRPThis indicator indicates that 'Momentum Discrepancy Reversal Point' = 'MDRP'.
Mixing and modifying several general indicators to find support and resistance
It is created to predict the change point of the trend by overlaying it on the chart.
The 4 support and resistance lines are drawn live, and the changed support and resistance lines are
It erases the line and overlays it again with a new line.
For each support and resistance , you can modify the color or line thickness, number of expressions, etc. in the input menu.
1. _____RSI-SR
Based on Wilder's RSI formula, overbought and oversold
Changes are detected and overlaid on the chart in the form of 2 resistances and 2 supports.
2. _____STOCHRSI-SR
Using the general stochastic and Wilder's RSI calculations,
Detect changes in overbought and oversold areas
It overlays the chart in the form of 1 resistance and 1 support.
3. _____PV-SR
Pivot-based support and resistance will be overlaid on the chart,
By default, 10 pivot lines are drawn, but by modifying the count in the input menu,
You can modify the number of overlays.
4. _____FVG
'Fair value gaps' refers to gaps within consecutive candles.
This section is overlaid in the form of a box,
The default is to draw 10 FVG boxes, but set count in the input menu.
You can modify the number of overlays by editing.
5. _____ZIGZAG
This is to find MDRP by overlaying the low and high prices of the current trend on the chart.
ZIGZAG labels near supports and resistances of 1, 2, 3 and 4 can increase the reliability of the MDRP.
The default value of live in the input menu is true, but if it is false, the closing price is checked and drawn.
Reduce false signals.
6. _____ICHIMOKU
The 5 lines of ICHIMOKU were overlaid with the default values of 9, 26, 52, 26,
Lines other than LeadLine A and B that are overlaid on the chart are overlaid on the chart only as much as the period value of each line.
* The _____FVG indicator cited the source of 'makuchaku'.
------------------------------------------------------------------------------------------------------------------------------------------------------------------------
이 지표는 'Momentum Discrepancy Reversal Point' = 'MDRP'를
찾기 위해 여러개의 일반적 지표들을 혼합, 수정하여 지지와 저항의 형태로
차트에 overlay 시켜 트렌드의 변화 지점을 예측 하기 위해 만들어졌습니다.
4개의 지지와 저항선은 실시간으로 그려지게 되며, 변화된 지지와 저항은 기존의
선을 지우고 새로운 선으로 다시 표시 됩니다.
각 지지와 저항은 input 메뉴에서 색 또는 선의 두께, 표현할 개수 등을 수정할 수 있습니다.
1. _____RSI-SR
Wilder's RSI 계산식을 기반으로 과매수, 과매도 영역에서의
변화를 감지하여 2개의 저항과 2개의 지지의 형태로 차트에 표시 됩니다.
2. _____STOCHRSI-SR
일반적 스토캐스틱과 Wilder's RSI의 계산식을 이용하여
과매수, 과매도 영역에서의 변화를 감지하여
1개의 저항과 1개의 지지의 형태로 차트에 표시됩니다.
3. _____PV-SR
Pivot을 기반으로 한 지지와 저항을 차트에 표시 하게 되며,
기본값은 10개의 Pivot선이 그려지게 되지만 input 메뉴에서 count를 수정하여
표시할 개수를 수정할 수 있습니다.
4. _____FVG
'Fair value gaps'는 연속된 캔들 안에서의 갭 구간을 말합니다.
이 구간을 박스의 형태로 표시한 것이며,
기본값은 10개의 FVG 박스가 그려지게 되지만 input 메뉴에서 count를
수정하여 표시할 개수를 수정할 수 있습니다.
5. _____ZIGZAG
현재 트렌드의 저가와 고가를 차트에 표시하여 MDRP를 찾기 위한 것으로
1, 2, 3, 4의 지지와 저항 부근에서의 ZIGZAG 라벨은 MDRP의 신뢰도를 높혀줄 수 있습니다.
input 메뉴에서의 live 기본값은 체크되어 있지만 체크를 해제하면 종가를 확인하고 그려지기에
거짓 신호를 줄일 수 있습니다.
6. _____ICHIMOKU
ICHIMOKU의 5개의 선은 기본값인 9, 26, 52, 26으로 표시하였으며,
차트에 표시되는 선행스팬 1과 2를 제외한 전환선, 기준선, 후행스팬은 각 선의 기간값만큼만 차트에 표시 되게 하였습니다.

[_ParkF]MDRPThis indicator indicates that 'Momentum Discrepancy Reversal Point' = 'MDRP'.
Mixing and modifying several general indicators to find support and resistance
It is created to predict the change point of the trend by overlaying it on the chart.
The 4 support and resistance lines are drawn live, and the changed support and resistance lines are
It erases the line and overlays it again with a new line.
For each support and resistance, you can modify the color or line thickness, number of expressions, etc. in the input menu.
1. _____RSI-SR
Based on Wilder's RSI formula, overbought and oversold
Changes are detected and overlaid on the chart in the form of 2 resistances and 2 supports.
2. _____STOCHRSI-SR
Using the general stochastic and Wilder's RSI calculations,
Detect changes in overbought and oversold areas
It overlays the chart in the form of 1 resistance and 1 support.
3. _____PV-SR
Pivot-based support and resistance will be overlaid on the chart,
By default, 10 pivot lines are drawn, but by modifying the count in the input menu,
You can modify the number of overlays.
4. _____FVG
'Fair value gaps' refers to gaps within consecutive candles.
This section is overlaid in the form of a box,
The default is to draw 10 FVG boxes, but set count in the input menu.
You can modify the number of overlays by editing.
5. _____ZIGZAG
This is to find MDRP by overlaying the low and high prices of the current trend on the chart.
ZIGZAG labels near supports and resistances of 1, 2, 3 and 4 can increase the reliability of the MDRP.
The default value of live in the input menu is true, but if it is false, the closing price is checked and drawn.
Reduce false signals.
6. _____ICHIMOKU
The 5 lines of ICHIMOKU were overlaid with the default values of 9, 26, 52, 26,
Lines other than LeadLine A and B that are overlaid on the chart are overlaid on the chart only as much as the period value of each line.
* The _____FVG indicator cited the source of 'makuchaku'.
------------------------------------------------------------------------------------------------------------------------------------------------------------------------
이 지표는 'Momentum Discrepancy Reversal Point' = 'MDRP'를
찾기 위해 여러개의 일반적 지표들을 혼합, 수정하여 지지와 저항의 형태로
차트에 overlay 시켜 트렌드의 변화 지점을 예측 하기 위해 만들어졌습니다.
4개의 지지와 저항선은 실시간으로 그려지게 되며, 변화된 지지와 저항은 기존의
선을 지우고 새로운 선으로 다시 표시 됩니다.
각 지지와 저항은 input 메뉴에서 색 또는 선의 두께, 표현할 개수 등을 수정할 수 있습니다.
1. _____RSI-SR
Wilder's RSI 계산식을 기반으로 과매수, 과매도 영역에서의
변화를 감지하여 2개의 저항과 2개의 지지의 형태로 차트에 표시 됩니다.
2. _____STOCHRSI-SR
일반적 스토캐스틱과 Wilder's RSI의 계산식을 이용하여
과매수, 과매도 영역에서의 변화를 감지하여
1개의 저항과 1개의 지지의 형태로 차트에 표시됩니다.
3. _____PV-SR
Pivot을 기반으로 한 지지와 저항을 차트에 표시 하게 되며,
기본값은 10개의 Pivot선이 그려지게 되지만 input 메뉴에서 count를 수정하여
표시할 개수를 수정할 수 있습니다.
4. _____FVG
'Fair value gaps'는 연속된 캔들 안에서의 갭 구간을 말합니다.
이 구간을 박스의 형태로 표시한 것이며,
기본값은 10개의 FVG 박스가 그려지게 되지만 input 메뉴에서 count를
수정하여 표시할 개수를 수정할 수 있습니다.
5. _____ZIGZAG
현재 트렌드의 저가와 고가를 차트에 표시하여 MDRP를 찾기 위한 것으로
1, 2, 3, 4의 지지와 저항 부근에서의 ZIGZAG 라벨은 MDRP의 신뢰도를 높혀줄 수 있습니다.
input 메뉴에서의 live 기본값은 체크되어 있지만 체크를 해제하면 종가를 확인하고 그려지기에
거짓 신호를 줄일 수 있습니다.
6. _____ICHIMOKU
ICHIMOKU의 5개의 선은 기본값인 9, 26, 52, 26으로 표시하였으며,
차트에 표시되는 선행스팬 1과 2를 제외한 전환선, 기준선, 후행스팬은 각 선의 기간값만큼만 차트에 표시 되게 하였습니다.
Vector Flow ChannelA decay channel that allows multi stage setup for timed events.
update to V5:
and

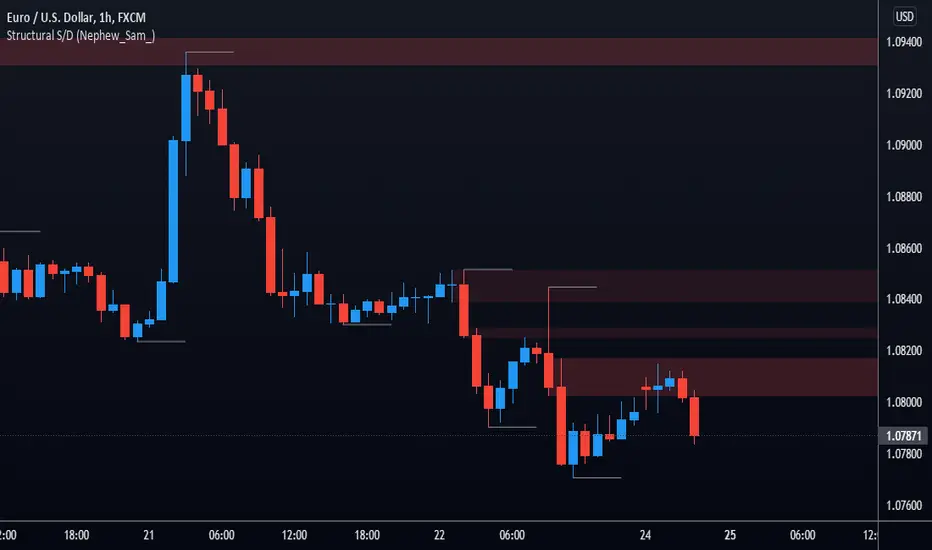
Structural S/D (Nephew_Sam_)This is a supply and demand indicator based on structural pivot points.
Everytime a pivot high/low is broken, it will plot the recent wicks of the candle that caused the break of pivot stucture and the one before it.
This is know as a 'stall' before an explosive move.
Indicator Settings:
Filled type - is zone filled once price closes away from it or if wick fills it
Delete filled - delete boxes once price has filled it
Pivots - similar to fractal points, each pivot is the highest/lowest point in a group of x left and x right bars
Box visuals - extend, colors, style etc
3EMA + Boullinger + PIVOTTRES EMAS + BANDAS DE BOLLINGER + PIVOTE
INDICADOR 1: TRES EMAS (MEDIA MOVIL EXPONENCIAL)
Con este indicador puede visualizar el promedio de precios con mayor peso a los datos mas recientes.
Se calculan y dibujan tres medias móviles exponenciales: 8, 20 y 200 últimas velas.
-Rápida EMA1 = 8
-Media EMA2 = 20
-Lenta EMA 3 = 200
INDICADOR 2: BANDAS DE BOLLINGER
Con este indicador podrá ver la fuerza y la tendencia del mercado, es decir la mide la volatilidad del precio del activo.
Si el precio sobrepasa la banda superior, el activo está sobrecomprado.
Si el precio sobrepasa la banda inferior, el activo está sobrevendido.
Longitud tendencia - BASE = 20, paso = 1
Desviación Estándar - Multiplicador = 2, paso = 0.2
INDICADOR 3: PIVOTE
Este indicador etiqueta los puntos donde el precio es mínimo y máximo, en un rango de velas determinado en el parámetro "Distancia para el Pivote".
Estos 3 indicadores sirven para todo tipo de activos: FOREX, CRIPTO, CFD´s, ETC.
------------------------------------------------------------------------------------------------------------------
THREE EMAS + BOLLINGER BANDS + PIVOT
INDICATOR 1: THREE EMAS ( EXPONENTIAL MOVING AVERAGE )
With this indicator you can visualize the average of prices with greater weight to the most recent data.
Three exponential moving averages are calculated and drawn: 4, 20 and 200 last candles.
-Fast EMA1 = 8
-Average EMA2 = 20
-Slow EMA 3 = 200
INDICATOR 2: BOLLINGER BANDS
With this indicator you can see the strength and trend of the market, that is, it is measured by the volatility of the asset price.
If the price goes above the upper band, the asset is overbought.
If the price goes above the lower band, the asset is oversold.
Trend length - BASE = 20, step = 1
Standard Deviation - Multiplier = 2, step = 0.2
INDICATOR 3: PIVOT
This indicator labels the points where the price is minimum and maximum, in a range of candles determined in the parameter "Distance to Pivot".
These 3 indicators are used for all types of assets: FOREX, CRYPT, CFD's, ETC.

Gold Reader by MarketReaderGold Reader is an indicator created for gold trading only. It is the result of deeplearning and cluster 2 step analysis. These analysis highligth specific intra-days patterns.
Pattern 1 is a full bearish day, pattern 4 a full bullish day.
Pattern 2 is an accumulation - manipulation - and bearish impulsion day
Pattern 3 is an accumulation - manipulation - and bullish impulsion day
The indicator draws 6 boxes.
-The orange box (high of pattern 1) correspond to the time and price where the high of the day is likely to form if we are in a pattern 1.
-The purple box (low of pattern 4) correspond to the time and price where the low of the day is likely to form if we are in a pattern 4.
-The red box (high of pattern 2) correspond to the time and price where the high of the day is likely to form if we are in a pattern 2.
-The blue box (low of pattern 3) correspond to the time and price where the low of the day is likely to form if we are in a pattern 3.
The 2 gray box correspond to the high probability of high of a bull day and low of a bear day. It is good area for a end of the day reversal.
ORZ= optimal reversal zone. It is a specific pattern for New York continuation of London session in case of pattern 1 and 4.

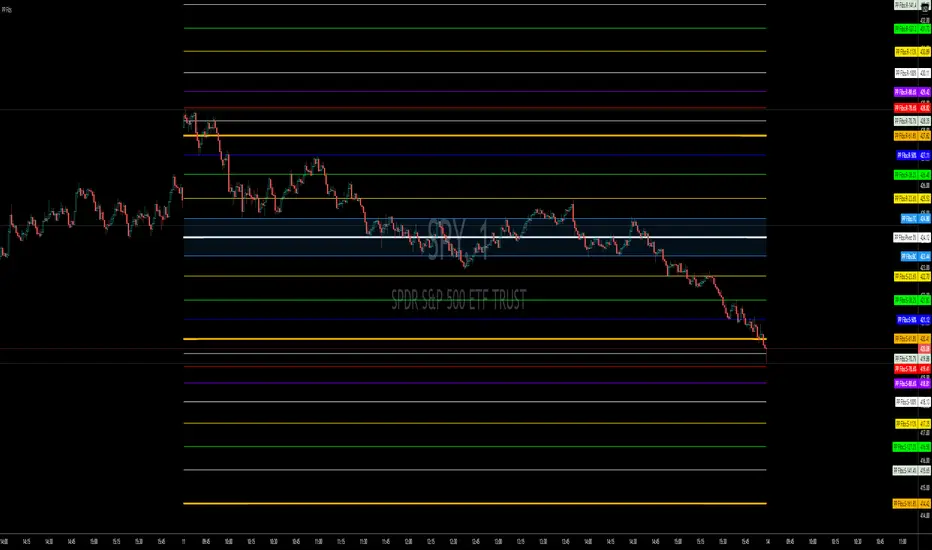
CPR BY DTTThe Central Pivot Range Indicator was created by Mark Fisher in his The Logical Trader book with some improvements made by Frank Ochoa. This indicator can seem very simple at first since it is a variation of the typical pivot points you see but this indicator aims to capture much data for the market sentiment for each stock that I will go over in detail. This indicator is known as the swiss army knife of pivots for a good reason.
First, this indicator will let you know one method of finding the current trend of the stock by determining where the price lies in comparison with the Central Pivot Range. If the price isn't touching and is above the Central Pivot Range then this stock is in a big uptrend that has a high chance of it continuing. Same for the reverse if the price isn't touching and is below the Central Pivot Range. Another method is when the current Central Pivot Range for the current period is higher than the previous Central Pivot Range and this means that the stock is in an uptrend and vice versa.
Second, you can tell much about if this stock is currently in a trending or sideways market by looking at the spacing between the 3 lines. If there is a bunch of space between each line then the stock is currently in a sideways market or in other words not much volatility. If there is very little space between each line then the stock is currently in a trending market and this means much volatility and so you need to trade in the direction of the current trend.
Finally, this indicator works as a general support and resistance system like a typical pivot point indicator and so you would go long if the price breaks through the resistance level which would be the top line or go short if the price breaks below the support level which would be the bottom line.
I have included many options in my script to allow you to see other support and resistance levels like extended pivot points, high and low points, and pivot points using data that will project what tomorrow's pivot points will look like. Let me know if you find any other uses for this indicator and of course if you have any questions for me!

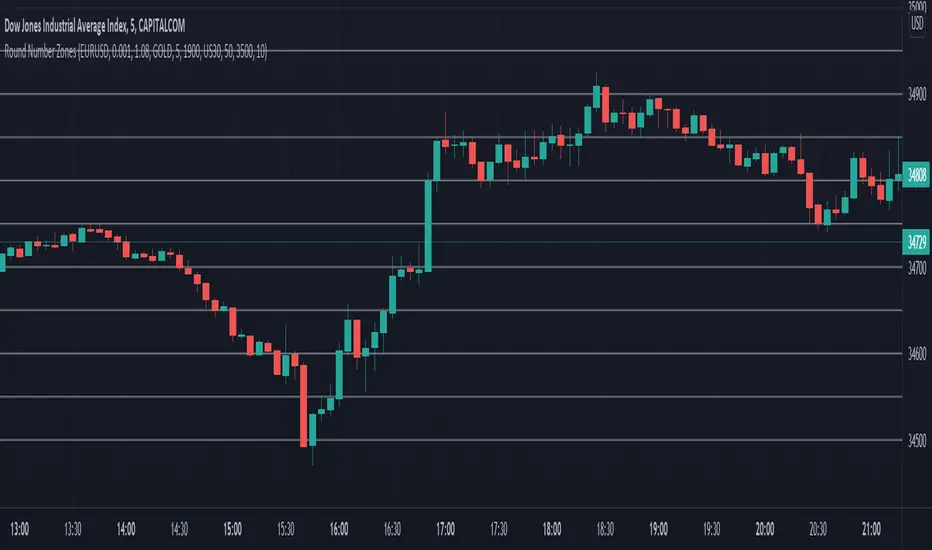
Round Number ZonesThis indicator shows zones of round numbers for 3 custom symbols like US30, EURUSD or GOLD as lines in the chart. The starting price can also be the current or a custom one and you can configure the increments as well. CAPITALCOM:US30
Pivot Order Blocks// How it Works \\
Order Blocks based on pivot reversal candle
When a pivot High or Pivot Low is found and confirmed, a box will be plotted on the open and close values of that pivot candle
// Settings \\
In the settings you have the ability to change the distances required to confirm an pivot High or Low
These are the lengths where the script checks to see if it is at its local high or low.
You also have the ability to change the amount of candles the box stretches over as well as the colors of the bullish and bearish boxes
// Use Case \\
Pivot points often provide Support and Resistance points on their own,
one way of marking up order blocks is by taking the pivot candle and marking that up as a resistance area where you could be looking for price to reverse
// Suggestions \\
Happy for anyone to make any suggestions on changes which could improve the script,
// Terms \\
Feel free to use the script, If you do use the script could you please just tag me as I am interested to see how people are using it. Good Luck!

Jimmy's Dikfat DaytraderThis Day Trading Indicator applies the use of multiple techniques designed to maximize profits and trade success probability while utilizing proprietary mathematical techniques to calculate specific high probability Pivot Points, Break of Structure, Supply and Demand, previous days High and Low, Liquidity Hunts, Dynamic Trend Lines and Fibonacci Discount Zones. The combination of these techniques combined with unique mathematical calculation & variance allow the user to make an informed analysis to take high probability trades by exposing Market Maker discount zones and highlight smart money purchasing.
Pivot Points: A traditional pivot point is described as an individual candle high that is higher than the previous two candles to the left and forward two candles to the right. Likewise a pivot is also an individual candle low that is lower than the previous two candles to the left and forward two candles to the right. In this indicator standard pivots are highlighted as yellow and white candles. Yellow candles are High or Top Pivots; White Candles are Low or Bottom Pivots. The number of pivots checked for either left or right or both can be changed in the settings. Increasing this value will add more pivot points to the chart, decreasing this value will add less. It is recommended to change values left and right with the same number.
Note: In this study, all traditional pivots will be highlighted by yellow or white for the advanced user, but not all pivot markers will highlight all pivots for the purposes of identifying a high probability trade.
Break of Structure: Break of structure occurs when current price drops below or likewise rises above a pivot point. For the purposes of this study, a break of structure tag will appear over a previous pivot tag ONLY when there is a candle close below or above the previous pivot for the purposes of identifying liquidity hunts and high probability trades. As you will note in the example chart, break of structure is used to determine not only trend but high probability trade areas by identifying market structure. Unbroken pivot highs or lows can be used to take trades, with a stop below the low (or above the high) of the unbroken pivot candle. BOS (Break of Structure) Tags will effectively show where market participants do not want to take a trade and be chopped up in a market that is trending only 30% of the time. BOS also gives future indication of where the Market Makers are taking price action. Breaks of structure in a particular direction typically indicate a continuation of price action in that direction. Trade opportunities occur after the pullback in the opposite direction of break of structure. This highlights areas traders can take on the pullback, in the direction of structure breaks, typically on unbroken pivots.
Note: In this study, not all BOS (Break of Structure) markers will highlight all breaks of structure for the purposes of identifying a high probability trade. Some very few examples of structure is not marked as broken to assist in identifying Liquidity Hunts.
Liquidity Hunt: A Liquidity Hunt is where price action moves in the opposite direction of an intended move (typically with high magnitude and velocity) to gather "Liquidity" and trigger stops created by traders caught in the break of structure zone. Any unbroken pivot is a relevant area of Liquidity. Some of the High probability areas of Liquidity will be found at Equal (or near equal) Lows or Equal High pivots. Current areas of Liquidity are marked on the chart as an Aqua (Light Blue) Background line that extends right infinitely. Once Liquidity has been taken at one of these lines, the Line will "Break" And stop displaying forward. The number of pivots calculated specifically for break of structure and Liquidity Hunts can be changed under the Liquidity Hunt setting. Much like with pivots, it is recommended to change these numbers with the same value for best results.
Due to the complexity of the math, Some liquidity pivots will only confirm and display a pivot tag after twice the candles defined have been found to the left and right under liquidity hunt settings, and some will display after the exact number specified in settings. As noted previous some will not display at all due to the high probability nature of this indicator and having been found as a "cluster" in the Supply and Demand Boxes.
Supply and Demand Boxes: Supply and Demand boxes will be created when a specific number of pivots are found in succession or in a "cluster" and a box will be drawn from the current grouping of pivots, first pivot high to the nearest pivot low in the cluster. This unique style of supply and demand box drawing has been proven to be an effective identifier of buying and selling in the price action, or likewise support or resistance upon return to these boxes. The boxes were specifically designed to identify high probability areas of Supply and Demand and are more likely to be areas of high probability buying and selling. Supply is when price action moves into or creates an area where sellers are waiting. Demand is when price action moves into or creates an area where Buyers are waiting. When price action creates a box, the box will remain Neutral with a white color while Price action remains within the box. This box will turn Red or into a Supply Box, when price action drops below the box boundaries. The box will likewise turn Green or into a Demand Box, when price action rises above the box boundaries. Any return to a colored box from the direction it was created could be anticipated as a retracement to continue in the direction of price action indicated by the box.
In the settings boxes can be extended to the current bar right to show previous areas of supply and demand, or can be left "Truncated" or in box form as a highlighter for cluster analysis.
Previous Days High and Low: The previous days High and low will be displayed on the current day as a magenta line. Some traders use these lines to anticipate price action on the day compared to where price action is moving relative to the previous day. Historical Magenta lines are also the marked on a specific day, for the previous days High and low. Historical Lines can be turned off by reducing Opacity of the setting to Zero, leaving only the previous days high and low on the current day.
Dynamic Trend Lines: Trend Lines will be created automatically that will connect unbroken pivots and extend right, highlighting the current trend. (Coming Soon™️)
Fibonacci Discount Zone: The Fibonacci Discount Zone can be found by measuring an unbroken pivot High or Low, that breaks structure left to create a new High or Low. When structure is broken and price begins a retracement before moving back in the direction of the broken structure, the retracement is typically back into the "Discount Zone" between the 618 and 786 Fibonacci zone. This zone will be automatically plotted as a light grey box in the background of the chart. (Coming Soon™️)

Market Maker Volatility Diameter V2 by Hawkeye Charting***German Description below***
Hey guys,
we are proud to publish the Market Maker Volatility Diameter V2!
Our goal with this indicator is to provide an All-in-one indicator, combining some special tools of open source scripts as well as some of our own developments and the algorithm of our MMVD V1.
We will create a video series very soon, where we will explain each aspect of the tool, your options and of course our trading strategies with this indicator.
You have the following technical tools and information combined in this indicator, which can each be shown and hidden:
- Psychological Ranges (Weekly Opening High/ Low for Crypto and Forex)
- Market Maker Sessions (Sydney, Asia, London, NY)
- Trade Cloud (algorithm developed by Hawkeye Charting)
- Fibonacci Cloud (inspired by watching paid offerings, coded by Hawkeye Charting)
- Display Moving Averages (select the visualization of up to 6 moving averages. You can change for each of these 6 MA's the type and the length.)
- Display Major Trend Cloud (developed by Hawkeye Charting)
- PVSRA Candle Colors
- Vector Candle Zones
- Pivots
- Pivot Fibonacci Levels (developed by Hawkeye Charting)
- OHLC-Levels
- Average Daily, Weekly, Monthly Ranges
- Volume Profile for Intraday Trading for up to 8 days.
We hope especially for people, who can not afford the Pro offering from TradingView, to give access to a good indicator, which includes many tools and alerts.
Our goal is to lower the barriers for new entrants and of course to protect people, to pay for indicators, which are completely insane priced.
Only, that you get an idea: the whole indicator has only cost me about 100 h of work (for a single person!), and I'm no Pine script expert, so don't get fooled when someone offers you insane amounts for an indicator...
There is no holy grail. Each indicator works only with calculations on previous data.
We appreciate seeing that you guys like this work, so please leave a like and a follow and share this indicator.
*****German Description*****
Hey Leute,
wir sind stolz, unsere 2. Version des Market Maker Volatility Diameter zu veröffentlichen!
Unser Ziel ist es, mit diesem Indikator eine All-In-One Lösung anzubieten, welche einige nicht ganz geläufige Tools sowie unsere eigenen Entwicklungen und natürlich den Algorithmus des MMVD V1 vereinen.
Wir werden in naher Zukunft eine Video Serie veröffentlichen, in welcher wir Stück für Stück jeden Aspekt des Werkzeugs, die Einstellungsmöglichkeiten sowie unsere Trading Strategien mit diesem Indikator erklären werden.
Ihr habt die folgenden technischen Werkzeuge und Informationen in diesem Indikator vereint, welche jede einzeln an- oder abgewählt und eingestellt werden können:
- Psychological Ranges (Weekly Opening High/ Low für Krypto and Forex)
- Market Maker Sessions (Sydney, Asia, London, NY)
- Trade Cloud (Algorithmus von Hawkeye Charting entwickelt)
- Fibonacci Cloud (inspiriert von der Beobachtung eines Paid-Indikators, Code geschrieben von Hawkeye Charting)
- Moving Averages (Ihr könnt die Darstellung von bis zu 6 Gleitenden Durchschnitten auswählen und für jeden dieser Durchschnitte den Typ und die Länge ändern.)
- Display Major Trend Cloud (entwickelt von Hawkeye Charting)
- PVSRA Candle Colors
- Vector Candle Zones
- Pivots
- Pivot Fibonacci Levels (entwickelt von Hawkeye Charting)
- OHLC-Levels
- Average Daily, Weekly, Monthly Ranges
- Volume Profile für Intraday Trading, Darstellungsmöglichkeit für 3-8 Tage
Wir hoffen, dass wir speziell für Leute, die sich nicht das PRO-Abo aufwärts von TradingView leisten können, Zugang zu einem guten Indikator, welche viele Werkzeuge und Alarme vereint gewährleisten zu können.
Unser Ziel ist es, die Eintrittsbarrieren für neue Marktteilnehmer senken und natürlich Leute vor wahnsinnigen Paid-Angeboten beschützen zu können.
Nur, damit ihr eine Vorstellung bekommt: den gesamten Indikator hat mich lediglich 100h Arbeit gekostet (für eine einzelne Person!), und ich bin kein Pine Script Experte. Also lasst euch bitte nicht verar******, wenn euch Paid-Angebote erreichen, mit dem Versprechen, den "zu 95% erfolgreich" Indikator erwerben zu können.
Es gibt keinen heiligen Gral, jeder Indikator arbeitet nur mit Berechnung von Vergangenheitswerten.
Wir würden uns riesig freuen, wenn euch diese Arbeit gefällt und ihr uns Likes und Follows hinterlasst und ihr diesen Indikator teilt.

MTF Pivots Zones [tanayroy]Dear Fellow Traders,
I only publish scripts that I use and found good for my trading. Pivots are my favorite indicator. I use daily, weekly, monthly, quarterly, and yearly pivots levels. multiple pivot zones are very strong levels and I like to watch these levels for possible price action.
But when I include all pivots levels at a time, my charts get too clumsy. To see price action properly, you need a clean chart. And when we trade we want to see only important levels within the price horizon.
To resolve this, I created this script, which shows important levels within my display option. I control the display option with 14 periods ATR and a multiplier to adjust the display levels.
The following chart displays levels within 14 ATR * 0.5 multipliers. As the price progress, it will automatically add levels and delete levels that do not come within this option.
What levels are included?
I have used traditional pivot calculation and included Daily, Weekly, Monthly, Quarterly, and Yearly pivots with high and low.
What options are available?
You can replace the yearly timeframe with your desired time frame and can adjust the ATR multiplier to increase or decrease display levels.
Use this in 5m, 15m, or 1H chart or any timeframe below Daily.
Please like, share, and comment.

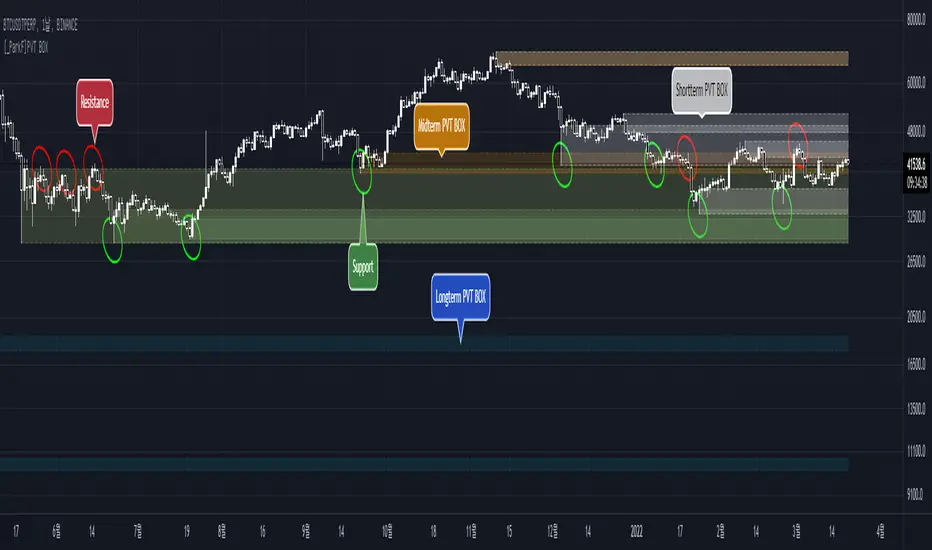
[_ParkF]PVT BOXIt creates a box based on price and pivot .
PVT BOX represents short, medium, and long term boxes in their respective colors,
which can confirm support and resistance .
This indicator has the number of displays per box, period, color, and on/off switch options.
I hope it will help you with your trading.
hope you become rich!
---------------------------------------------------------------------------------------------
가격과 피봇을 기반으로 하는 박스를 생성하여 줍니다.
PVT BOX는 단기, 중기, 장기의 박스를 각각의 색으로 표현되며,
이 박스들로 인해 지지와 저항을 확인할 수 있습니다.
이 지표에는 각 박스별 표시갯수, 기간값, 색상, on / off 스위치의 옵션을 가지고 있습니다.
거래에 도움이 되셨으면 합니다.
부자되세요!
Pivot Based Trailing Maxima & Minima [LuxAlgo]This indicator returns trailing maximums/minimums and the resulting average, each resetting on the occurrence of a pivot point high/low, thus allowing to highlight past and current support and resistance levels.
Note that the user has the option to make the indicator subject to backpainting or not. Backpainting would offset the indicator output to the past and as such would be less suited for real-time applications.
🔶 USAGE
🔹 Non Backpainting
The indicator can highlight points of support and resistance given by the trailing maximum/minimum average.
An uptrend is indicated when the trailing maximum is making a new higher high, while a downtrend is indicated when the trailing minimum makes a new lower low.
🔹 Backpainting
When backpainting is enabled the historical trailing maximum/minimum and their resulting average are offset to the past. However, we extend these to the most recent bar, allowing for real-time applications of the indicator.
Users can easily analyze past trends and determine their type by observing the trailing maximum/minimum behavior. For example, trailing maximums/minimums not making new higher high/lower low would indicate a ranging market.
The frequency of new higher high/lower low can also help determine how bullish/bearish a trend was.
🔶 SETTINGS
Length: Determines the pivot high/low lookback, with higher values allowing to detect longer-term tops and bottoms.
Backpaint: Determine if the indicator is subject to backpainting. Enabling this setting would offset the returned results in the past.

Mean Shift Pivot ClusteringCore Concepts
According to Jeff Greenblatt in his book "Breakthrough Strategies for Predicting Any Market", Fibonacci and Lucas sequences are observed repeated in the bar counts from local pivot highs/lows. They occur from high to high, low to high, high to low, or low to high. Essentially, this phenomenon is observed repeatedly from any pivot points on any time frame. Greenblatt combines this observation with Elliott Waves to predict the price and time reversals. However, I am no Elliottician so it was not easy for me to use this in a practical manner. I decided to only use the bar count projections and ignore the price. I projected a subset of Fibonacci and Lucas sequences along with the Fibonacci ratios from each pivot point. As expected, a projection from each pivot point resulted in a large set of plotted data and looks like a huge gong show of lines. Surprisingly, I did notice clusters and have observed those clusters to be fairly accurate.
Fibonacci Sequence: 1, 2, 3, 5, 8, 13, 21, 34...
Lucas Sequence: 2, 1, 3, 4, 7, 11, 18, 29, 47...
Fibonacci Ratios (converted to whole numbers): 23, 38, 50, 61, 78, 127, 161...
Light Bulb Moment
My eyes may suck at grouping the lines together but what about clustering algorithms? I chose to use a gimped version of Mean Shift because it doesn't require me to know in advance how many lines to expect like K-Means. Mean shift is computationally expensive and with Pinescript's 500ms timeout, I had to make due without the KDE. In other words, I skipped the weighting part but I may try to incorporate it in the future. The code is from Harrison Kinsley . He's a fantastic teacher!
Usage
Search Radius: how far apart should the bars be before they are excluded from the cluster? Try to stick with a figure between 1-5. Too large a figure will give meaningless results.
Pivot Offset: looks left and right X number of bars for a pivot. Same setting as the default TradingView pivot high/low script.
Show Lines Back: show historical predicted lines. (These can change)
Use this script in conjunction with Fibonacci price retracement/extension levels and/or other support/resistance levels. If it's no where near a support/resistance and there's a projected time pivot coming up, it's probably a fake out.
Notes
Re-painting is intended. When a new pivot is found, it will project out the Fib/Lucas sequences so the algorithm will run again with additional information.
The script is for informational and educational purposes only.
Do not use this indicator by itself to trade!

TWS Pivot PointsStandard Pivot Points
This Script includes the Mid Pivot Points
R1-R5,
S1 - S5
What is a Pivot Point?
A pivot point is a technical analysis indicator, or calculations, used to determine the overall trend of the market over different time frames. The pivot point itself is simply the average of the high, low and closing prices from the previous trading day. On the subsequent day, trading above the pivot point is thought to indicate ongoing bullish sentiment, while trading below the pivot point indicates bearish sentiment.
The pivot point is the basis for the indicator, but it also includes other support and resistance levels that are projected based on the pivot point calculation. All these levels help traders see where the price could experience support or resistance. Similarly, if the price moves through these levels it lets the trader know the price is trending in that direction.
When the price of an asset is trading above the pivot point , it indicates the day is bullish or positive.
When the price of an asset is trading below the pivot point , it indicates the day is bearish or negative.
The indicator typically includes four additional levels: S1, S2, R1, and R2. These stand for support one and two, and resistance one and two.
Support and resistance one and two may cause reversals, but they may also be used to confirm the trend. For example, if the price is falling and moves below S1, it helps confirm the downtrend and indicate a possible continuation to S2.

TWS Pivot Points FibsPivot Points with Fibonacci
Day, Week, Month. Year Time Frames
0% to 200%
What is a Pivot Point?
A pivot point is a technical analysis indicator, or calculations, used to determine the overall trend of the market over different time frames. The pivot point itself is simply the average of the high, low and closing prices from the previous trading day. On the subsequent day, trading above the pivot point is thought to indicate ongoing bullish sentiment, while trading below the pivot point indicates bearish sentiment.
The pivot point is the basis for the indicator, but it also includes other support and resistance levels that are projected based on the pivot point calculation. All these levels help traders see where the price could experience support or resistance. Similarly, if the price moves through these levels it lets the trader know the price is trending in that direction.
When the price of an asset is trading above the pivot point , it indicates the day is bullish or positive.
When the price of an asset is trading below the pivot point , it indicates the day is bearish or negative.
The indicator typically includes four additional levels: S1, S2, R1, and R2. These stand for support one and two, and resistance one and two.
Support and resistance one and two may cause reversals, but they may also be used to confirm the trend. For example, if the price is falling and moves below S1, it helps confirm the downtrend and indicate a possible continuation to S2.
All levels are based on Fibonacci
Makuchaku's Trade Tools - Pivots/Fractals & CrossoversPivots/Fractals are at minimum a 3 candlestick pattern.
Bearish pivot/fractal is formed when a candle is flanked by 2 lower candles on either side
Bullish pivot/fractal is formed when a candle is flanked by 2 higher candles on either side
They are great to determine market structure.
This indicator also prints boxes when those pivots/fractals are crossed over, printing bearish & bullish boxes.

[Excalibur] Pivoted Automatic Breakout Trend LinesPREAMBLE:
As I will elaborate further, lines and linearity are everywhere in the our thoughts, words, objects, and nature. For example, in our youth, drawing lines on paper, ascribing them in the dirt, and using them to perfect hand writing is common occurrences in life everyone has experienced. Our minds are uniquely adaptable to envision linearities in many natural or abstract objects, including facial geometry. That's how we easily recognize each other in person. For decades, along our path on roadways to and from our destinations, road lines have long safely guided us. Common phrases are "get in line", "walk the line", "line of duty", and "finish line" in English. Gazing upon the earth's line of horizon on calm wide open ocean standing upon the shoreline, it is easily visible and it has curvature. Sorry to break it to you flat earthers.
Multitudes of agreed upon lines define nationally recognized boundaries on maps for very specific reasons. Some lines are just simply not meant to be crossed and are purposefully intended to be respected. Even at the time of this original release, lines are being "crossed" on unimaginable and tragic scales, forming a trend of devastation of lives and livelihoods. On occasion in human history, border lines have to be redefined, especially when a godvernment no longer represents the WILL of a vast geographic majority of it's citizens. When puppet representatives and misleaders only have a self serving interest to put their citizens most treasured values, grievances, and souls in the grave, succession is a matter of last resort and it's often statistically speaking 101% necessary.
As an American, from my opinionated perspective assessing the situation, I welcome the ancestral people of Donetsk and Luhansk to the world stage, being independent to choose their own destinies and fates, because all that Ukraine wishes to do with them year, after year, after year is render them as subjugates or use them for target practice. And that isn't right! The way 2021+ is heading, by the year 2100 I suspect every continental map is going to have new lines on them.
LINES OF ANTIQUITY:
Many recorded instances throughout history detailing the use of lines, has endured centuries of time. The ancient origins and study of "Euclidean geometry" would have been performed scribbling in the ground, preferably in sand. The Greek mathematician Euclid of Alexandria, the founder of geometry, most probably spent a great deal of his life doing this in order to pass his bold ideas onto future generations.
Before Euclid's time, Spartans in the battle of Thermopylae drew their lines in the sand with their swords adhering to the infamous words "Molon Labe" (come and take ). These disciples of agoge, born and destined for rigorous entrainment were bound by duty, no retreat, no surrender. Hundreds of Spartan sigma males held the line for as long as they could for the security of their free peoples. In almost every case of Spartan history the imperative notion of holding the battle lines was absolutely necessary at all costs, regardless of the carnage delivered from their enemy adversaries, including the unrelenting hordes of invasion commanded by the tyrant Xerxes. ALL gave some on those days.
Over two millennia later, Colonel William Travis at the Alamo carved a line in the ground for able men to decide which side of history they would reside on. History has an awfully bad habit of repeating itself, as it is always told in forewarnment. Lines have always been pertinent, decisive, and always shall be. A world without lines, would make our grasp of understanding and existence nearly impossible to carry on civilization.
LINES IN MODERN TIMES:
The versatility of lines are every where imaginable in this 21st century. A short list of their applications are in art, design, engineering, architecture, demarcation, and they are always, always ever pervasive in computer graphics. Without a doubt, lines are now pinnacle to having the ability to make our charting possible in order to recognize trends. Here in this script's application I intended them to automatically reveal geometry, trends, and breakout zones.
When I originally encountered my discovery of TradingView's existence, the very first thing I was doing, was to naturally draw lines across the price action pivot points in search of identifiable opportunities. Three years later, I have now finalized my vision of automatically drawing an ample amount of them by harnessing the "Power of Pine" in version 5. As you will soon see, utilization of this script will reveal hidden geometry that is otherwise typically unforeseen.
SCRIPT FUNCTIONALITY:
Programmatically drawing lines on top of numeric chaos has been an arduous task, taking me over a year to stabilize this code to my liking. The possibilities of automatically drawing lines on market price action could in theory actually result into hundreds per chart pane. This script does have a limitation of 60 line segments/rays maximum. I have gone to great lengths to accomplish this feat, just to arrive at 60 per overlay indicator. Beyond that, I am experiencing limitations of Pine. Because of the amount of work required to finalize this indicator, this is one of my "Excalibur" indicators. I literally had to pull this code from the deepest recesses of my mind. I would classify this kind of indicator as a weapon of mass financial creation, so I'm offering it's availability to all members.
Segments/rays may be computationally drawn as far back as 5000 bars into the chart's history, but no more than that are to be expected. Only one line will occur from pivot point to pivot point. All duplicate line occurrences computed are not redrawn over another, as I ensured by filtration this would not happen. Numerous adjustments are present to handle a majority of expectations and the numerous visual acuities of members. I envision many thousands of members utilizing this script's versatility as a visual aid to help guide them along their path of trading assessments and decisiveness.
SCRIPT UTILITY:
Having the ability to recognize geometry in price movements is ultra handy in relation to directional trending and channeling arrangements especially. Trends are guaranteed at some unknown point in time to breakout, and form new trends or cycles. I employed a fire and ice color duo to differentiate between the upper trend lines from the lower trend lines. It seemed to be most visible without interfering too often with other indicators. These can be changed to any color combo you desire in Settings. Additional line preferences are provided to support your tailored experience while having other indicators present in the overlay pane. It may even be configured to only display two lines at a minimum. By doing so, you can really focus and fine tune Settings for just these two segments/rays with very specific refined tweaks.
One caveat of detecting pivots, is that they aren't recognized until after they have formed. Always remember that pivot points aren't instantaneously discoverable until their full form is computationally apparent in the form of a chevron. Technically describing the pivot detection is beyond normal comprehension and to difficult to explain in this description. I will also say, viewing this on a 4K display resolution reveals the best view. If you wish to use more than one instance of this indicator in the overlay for more than 60 lines at a time, go right ahead. However it may become messy.
P.S. This script and it's description was partially inspired by Twisted Sister's song "We're Not Gonna Take It"
RISK DISCLAIMER:
My scripts and indicators are specifically intended for informational and educational use only. This script uses historical data points to perform calculations to derive real-time calculations. They do not infer, indicate, or guarantee future results or performance.
By utilizing this script/indicator or any portion of it, you agree to accept 100% responsibly and liability for your investment or financial decisions, and I will not be held liable for your subjective analytic interpretations incurring sustained monetary losses. The opinions and information visual or otherwise provided by this script/indicator is not investment advice, nor does it constitute recommendation.
