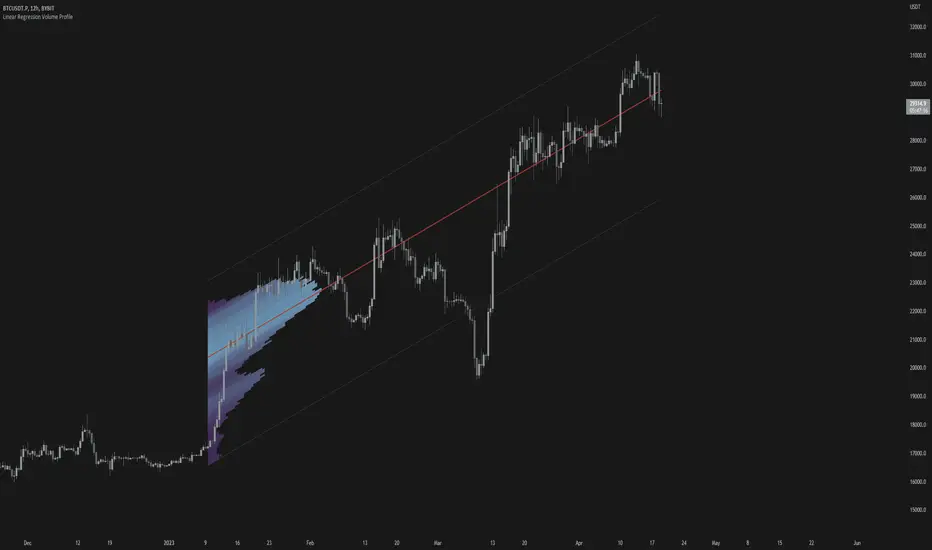
Linear Regression Volume ProfileLinear Regression Volume Profile plots the volume profile fixated on the linear regression of the lookback period rather than statically across y = 0. This helps identify potential support and resistance inside of the price channel.
Settings
Linear Regression
Linear Regression Source: the price source in which to sample when calculating the linear regression
Length: the number of bars to sample when calculating the linear regression
Deviation: the number of standard deviations away from the linear regression line to draw the upper and lower bounds
Linear Regression
Rows: the number of rows to divide the linear regression channel into when calculating the volume profile
Show Point of Control: toggle whether or not to plot the level with highest amount of volume
Usage
Similar to the traditional Linear Regression and Volume Profile this indicator is mainly to determine levels of support and resistance. One may interpret a level with high volume (i.e. point of control) to be a potential reversal point.
Details
This indicator first calculates the linear regression of the specified lookback period and, subsequently, the upper and lower bound of the linear regression channel. It then divides this channel by the specified number of rows and sums the volume that occurs in each row. The volume profile is scaled to the min and max volume.
Pointofcontrol
Volume and vPOC InsightsThe vPOC or volume point of control shows where most of the volume was traded. This is important because this is where the institutions and market makers have opened their positions, and these are the ones that move the markets!
This indicator is designed to cut through the volume noise, and enable the hiding of lower volume data.
The main setting allows you to define a lookback, and obscure the candles whose volume is less than x % of the highest volume in this lookback.
Of the remaining candles, their vPOC will be displayed. There are extra settings to extend naked vPOCs, as well as the highs and lows of these high volume candles, plus an EMA based on the vPOC price levels.
I must credit quantifytools @quantifytools who allowed me to utilize his code, for finding vPOCs using lower timeframe candles - there are comments in the code also. It works perfectly so why reinvent the wheel?

[Pt] Daily Market Profile / TPOA great mentor of mine once told me, trading is like driving. When you are driving, there are directions and road signs to follow. The key areas and levels from TPO market profile are the road signs in trading, you shouldn't trade without them much like you shouldn't drive without road signs, as you will get lost.
From Wikipedia: "A Market Profile is an intra-day charting technique (price vertical, time/activity horizontal) devised by J. Peter Steidlmayer, a trader at the Chicago Board of Trade (CBOT), ca 1959-1985. Steidlmayer was seeking a way to determine and to evaluate market value as it developed in the day time frame. The concept was to display price on a vertical axis against time on the horizontal, and the ensuing graphic generally is a bell shape--fatter at the middle prices, with activity trailing off and volume diminished at the extreme higher and lower prices." If you are unfamiliar with the concept, search for Market Auction Theory, Market Profile, and TPO on the web.
What's cool about this script?
As a professional trading, you should be drafting a trading plan and drawing all your key areas and levels before entering a trade. If you are trading with market profile, with this script, you no longer have to spend the time it takes to manually draw those key areas and levels. All are automatically generated with this script to give you the visual cues in your trades~!!
**IMPORTANT** Please note that due to the limitation on TradingView, there can only be limited number of boxes and lines that can be generated per indicator. Hence, this script only aims to provide you with as many key areas and levels as possible. This may be mitigated by having multiple instances of this indicator. Please use at your risk and discretion.
This script provides a comprehensive set of indicators / elements of daily TPO market profile, which includes the following:
- Market Profile based on TPO
- Point of Control (POC)
- Value Area (VA)
- Single Prints (SP)
- Excess (EX)
- Naked vs Visited (Touched) POC and VA
This script also includes the following key features that hopes to provide value in your trading:
- Automatically generated key areas and levels, including all the elements above
- Those key areas and levels will fade away as they become less significant, based on number of crosses and touches
- Customizable display settings
- Customizable session for generating the MP
- Two positions for MP placement
Setting descriptions:

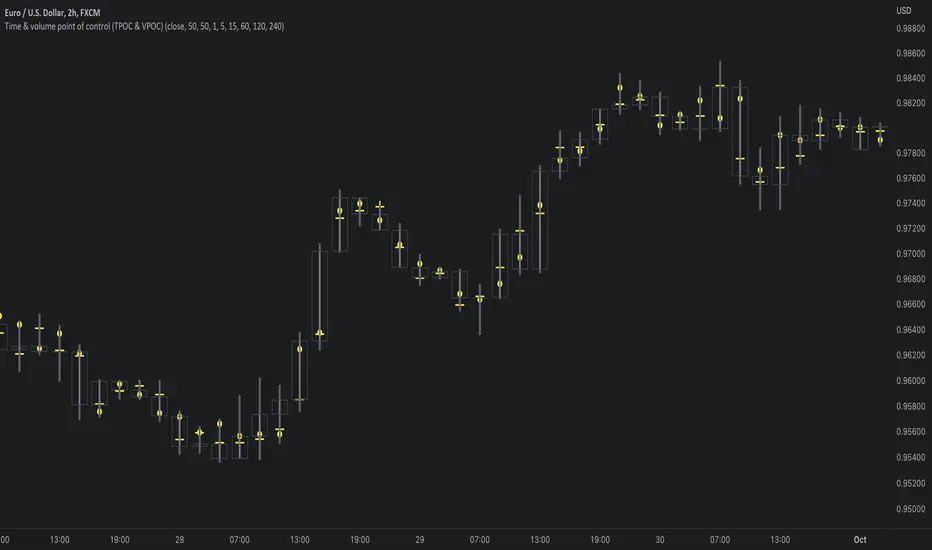
Time & volume point of control / quantifytoolsWhat are TPOC & VPOC?
TPOC (time point of control) and VPOC (volume point of control) are points in price where highest amount of time/volume was traded. This is considered key information in a market profile, as it shows where market participant interest was highest. Unlike full fledged market profile that shows total time/volume distribution, this script shows the points of control for each candle, plotted with a line (time) and a dot (volume). The script hides your candles/bars by default and forms a line in the middle representing candle range. In case of candles, borders will still be visible. This feature can be turned off in the settings.
Volume and time data are fetched from a lower timeframe that is automatically adjusted to fit the timeframe you're using. By default, the following settings are applied:
Charts <= 30 min: 1 minute timeframe
Charts > 30 min & <= 3 hours : 5 minute timeframe
Charts > 3 hours & <= 8 hours : 15 minute timeframe
Charts > 8 hours & <= 1D: 1 hour timeframe
Charts > 1D & <= 3D : 2 hour timeframe
Charts > 3D: 4 hour timeframe
Timeframe settings can be changed via input menu. The lower the timeframe, the more precision you get but with the cost of less historical data and slower loading time. Users can also choose which source to use for determining price for points of control, e.g. using close as source, the point of control is set to match the value of lower timeframe candle close. This could be replaced with OHLC4 for example, resulting in a point of control based on OHLC average.
To identify more profound points of market participant interest, TPOC & VPOC as percentage of total time/volume thresholds can be set via input menu. When a point of control is equal to or greater than the set percentage threshold, visual elements will be highlighted in a different color, e.g. 50% VPOC threshold will activate a highlight whenever volume traded at VPOC is equal to or greater than 50% of total volume. All colors are customizable.
VPOC is defined by fetching lower timeframe candle with the most amount of volume traded and using its close (by default) as a mark for point of control. For TPOC, each candle is divided into 10 lots which are used for calculating amount of closes taking place within the bracket values. The lot with highest amount of closes will be considered a point of control. This mark is displayed in the middle point of a lot:
How to utilize TPOC & VPOC
Example #1: Trapped market participants
One or both points of control at one end of candle range (wick tail) and candle close at the other end serves as an indication of market participants trapped in an awkward position. When price runs away further from these trapped participants, they are eventually forced to cover and drive price even further to the opposite direction:
Example #2: Trend initiation
A large move that leaves TPOC behind while VPOC is supportive serves as an indication of a trend initiation. Essentially, this is one way to identify an event where price traded sideways most of the time and suddenly moved away with volume:
Example #3: POC supported trend
A trend is healthy when it's supported by a point of control. Ideally you want to see either time or volume supporting a trend:
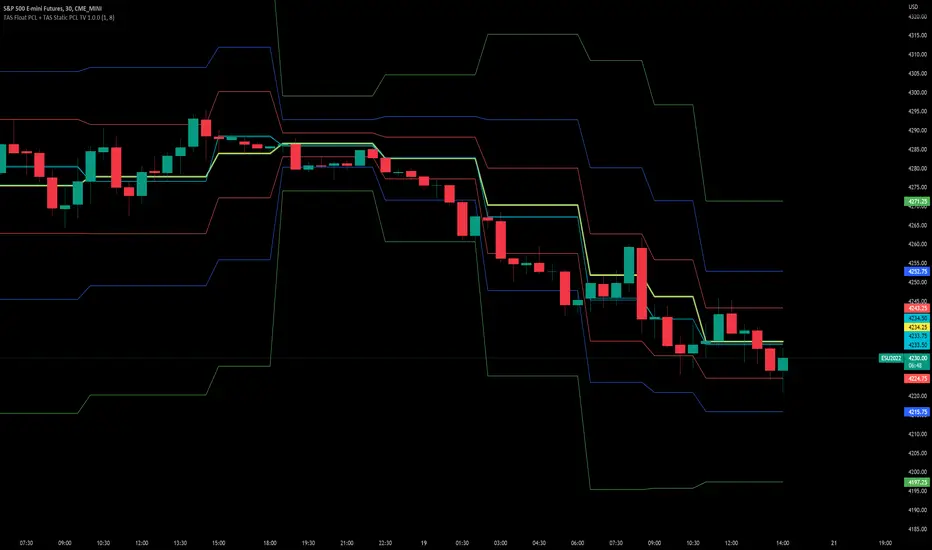
TAS Float PCL + TAS Static PCL [TASMarketProfile]TAS PRICE COMPRESSION LEVELS (PCLs) includes 2 distinct indicators that use volume at price analysis, volume aggregation and multi-timeframe confluence to calculate and display significant levels of commercial interest above and below the market. These levels reveal reliable trading levels which can be leveraged for enhanced trade entries, trailing stops and targets.
THERE ARE TWO TYPES OF TAS PCLs:
TAS Float PCLs - These levels take into account new data flow throughout the trading session and expands or contracts the levels dynamically in accordance with changing market conditions. These are often referred to by traders as “Floaters” or “Dynamic PCLs.”
TAS Static PCLs - These levels are set upon the start of the trading session and remain intact throughout the duration of the session. Many traders These are often referred to by traders as “Statics.”
Both TAS Floaters and TAS Statics have up to 10 horizontal lines available to display. The four center lines are referred to as Points of Control (POC). Three of these lines are colored cyan and one is yellow. The yellow line is more prominent and referred to as the Master Point of Control (MPOC) of the Price Compression Levels on display. The first area of commercial suppor t and resistance are plotted with red lines on both sides of the POC lines and commonly referred to as S1 and R1 levels. The next level of support and resistance areas are designated by blue lines (S2 and R2 levels) and then lastly the farthest from the POC lines are the green lines (S3 and R3 levels). By default, typically the green lines are not displayed but can be activated on an “as needed” basis within the indicator Style settings.
EXAMPLE OF TAS FLOAT PCLs:
ABOUT TAS FLOAT PCLs:
The TAS Dynamic PCLs (Floaters) reveal the price areas that attract commercial interest based on the current market conditions.
How the PCLs are plotted can be adjusted with two inputs controlled by the user.
----------1) MinSignal_123: This setting controls the sensitivity of the calculations. The default is set to 1 and this represents the most sensitive input that makes it easiest for market conditions to trigger new PCL levels. A setting of 2 is considered “medium” sensitivity and lastly a setting of 3 would require the most substantial change in conditions to trigger an adjustment of PCLs on the chart.
----------2) Length: This input setting determines the number of bars of data included in the calculation for new TAS Float PCLs to be adjusted on the chart. The default is set to 8.
MORE ON INPUT SETTINGS:
Using higher values in both inputs will display more significant areas of commercial interest for higher probability support and resistance levels around PCLs. These are referred to as “slow” Floaters.
Using lower value inputs will create Floaters that are more responsive to market conditions. These are referred to as “fast” Floaters.
When fast Floaters are contracted (cover a narrow range of prices) the market is tightly balanced and can easily enter into breakout conditions, if price closes outside of the TAS Float PCLs.
Expanded Floaters that are wider apart provide for greater rotational range trading conditions.
BELOW ARE THE RECOMMENDED INPUT SETTINGS COMBINATIONS THAT WILL DICTATE HOW RESPONSIVE THE PCLs WILL REACT TO CONDITIONS:
FAST (default): 1 - 8
MEDIUM: 2 - 14
SLOW: 3 - 34
The user will typically choose to have either Statics or Float PCLs active on the chart at a time, but not both as you'll have up to 20 levels on your chart (too many). You can, however, put them on different panes. Visit the INPUT settings of the indicator to select which one you want active.
The user can change the coloring, line type and thickness in the STYLE settings.
ABOUT TAS STATIC PCLs:
Many traders opt for TAS Static PCLs because they prefer to know the significant commercial interest price areas before they trade.
Unlike Floaters, TAS Static levels will not change throughout the trading session and are only affected if the user changes the opening and closing time parameters for the trading session displayed. By default, Static levels will recalculate and display new levels upon the reopen of the next session.
Tightly compacted POC lines designate an area of particularly strong commercial interest that provides higher probability, lower risk entries for extended directional moves. These areas are often referred to as “walls.”
If the POC lines are spread out over a wider range, a trader should be on the lookout for a more rotational trading session.
Periodically, one of the POC lines may be plotted outside of a red line (S1 or R1). In this case, the market may be biased in the same direction that the POC line is in relation to the red line.
TAS PRICE COMPRESSION LEVELS can be used as a stand-alone trading guidance system or in conjunction with other popular TASMarketProfile indicators.
Trade Well My Friends!
Point of Control V2 The genesis of this project was to create a POC library that would be available to deliver volume profile information via pine to other scripts of indicators and strategies.
This is a republish of an invite only script to open access
This is the indicator version of the library function.
A few points of significance:
- Allows the choice of reset of the study period, day/week or bars. This is simple enough to expand to other conditions
- Bar count resets starting from the beginning of the data set (bar index =0) vs bars back from the end of the data set
- A 'period' in this context is the time between resets - the start of the POC (eg. start of Day or Week) until it resets (for example at the beginning of a next day or week)
- Automates the determination of the increment level rather than the user specifying ticks or price brackets
- Does not allow for setting the # of rows and then calculating the implied price increment levels
- When a period is complete it is often useful to look back at the POCs of historical periods, or extend them forward.
- This script will find the historical POCs around the current price and display them rather than extend all the historical POC lines to the right
- This script also looks across all the period POCs and identifies the master POC or what I call the Grand POC, and also the next 3 runner up POCs
This indicator is also available as a library.
BINANCE:BTCUSDT NSE:NIFTY OANDA:XAUUSD NASDAQ:AAPL TVC:USOIL

Naked Intrabar POCThis indicator with an unfortunate and very non PC sounding name approximates (!) the intrabar point of control (POC) either from time or volume at price.
Due to pine limitations, bin size and the sample lower time frame selection will have at least some effect on the accuracy of the approximation. The trade off is between accuracy and historical availability, however bar replay can be used to view prior historical states beyond what is visible from the current real time bar.
In order for all intrabar POC circles to be visible, you will need to manually set the visual order of the indicator by bringing it to the front.
Since the POC represents a price point around which the highest market participation occurred, the exposed global variable intrabar_poc may (or may not) be interesting as an alternative to ohlc based source input.

Volume Profile, Pivot Anchored by DGTVolume Profile (also known as Price by Volume ) is an charting study that displays trading activity over a specified time period at specific price levels. It is plotted as a horizontal histogram on the finacial isntrumnet's chart that highlights the trader's interest at specific price levels. Specified time period with Pivots Anchored Volume Profile is determined by the Pivot Levels, where the Pivot Points High Low indicator is used and presented with this Custom indicator
Finally, Volume Weighted Colored Bars indicator is presneted with the study
Different perspective of Volume Profile applications;
Anchored to Session, Week, Month etc : Anchored-Volume-Profile
Custom Range, Interactive : Volume-Profile-Custom-Range
Fixed Range with Volume Indicator : Volume-Profile-Fixed-Range
Combined with Support and Resistance Indicator : Price-Action-Support-Resistance and Volume-Profile
Combined with Supply and Demand Zones, Interactive : Supply-Demand-and-Equilibrium-Zones
Disclaimer : Trading success is all about following your trading strategy and the indicators should fit within your trading strategy, and not to be traded upon solely
The script is for informational and educational purposes only. Use of the script does not constitutes professional and/or financial advice. You alone the sole responsibility of evaluating the script output and risks associated with the use of the script. In exchange for using the script, you agree not to hold dgtrd TradingView user liable for any possible claim for damages arising from any decision you make based on use of the script

[Mad] Volume DeltaThis is a volume indicator that splits purchases and sales into 2 separate columns.
In addition, I added some POW factors to scale the volume to a more compact or expanded picture.
The SMA draws the red line indicating the volume of purchases and sales, also with POW factor customizable, so it is possible to scale it within the volume bars
what to do with this information: it is very easy to find rotation points when the selling volume and the buying volume are equal, this is where possible rotation phases occur
have fun

Anchored Volume Profile by DGTAnchored Volume Profile aims to display trading activity at specific price levels over specified anchored periods of trading, where anchor period can be set to auto or users can specify anchor periods of their interest (Day (Session), Week, Quarter or Year)
Anchored Volume Profile is plotted as two horizontal histograms on the finacial isntrumnet's chart that highlights the trader's common interest at specific price levels as well as aims to reveal dominant party, bulls or bears
You are invited to glance at Vol Profile and Price Action-Support-Resistance studies
Disclaimer: Trading success is all about following your trading strategy and the indicators should fit within your trading strategy, and not to be traded upon solely
The script is for informational and educational purposes only. Use of the script does not constitutes professional and/or financial advice. You alone the sole responsibility of evaluating the script output and risks associated with the use of the script. In exchange for using the script, you agree not to hold dgtrd TradingView user liable for any possible claim for damages arising from any decision you make based on use of the script

Low Timeframe POCI have recently made a High Timeframe POC script (HFT POC) which is pretty popular. Thanks for this!
There are many requests to include lower timeframes in this script, that is why I created this script. I could have incorporated all the timeframe POC's into one indicator but I went this route to keep things more organized between all the different timeframes.
Currently included: Daily, 6H, 3H and 1H
/* DEFINITION */
Point Of Control (= POC) is a price level at which the heaviest volumes were traded.
/* HOW TO TRADE WITH THIS INDICATOR */
The basis for POC is determining bias on whichever timeframe you choose.
1. Identify a POC on the timeframe of your choosing.
/* If you choose the lowest timeframe (1H here) then always make sure to look at the higher timeframes to see how it is trading against a HTF POC.
2. When the price is moving away from the POC (either to the upside or downside) this can confirm or invalidate a trade.
3. You can now enter the trade on bias or wait for a retest of the same POC.
/* EXAMPLE TRADES /*
Here is a screenshot of some of the trades that are possible using these Low Timeframe POC's and some common sense.
s3.tradingview.com

High Timeframe POCBecause the big Bitcoin crash I have been looking a lot at high timeframe metrics. I never spent much time learning POC so I decided to create a little script for determining these on higher timeframes.
Currently included: Monthly, 3 months and 6 months.
/* DEFINITION */
Point Of Control (= POC) is a price level at which the heaviest volumes were traded.
Value Area High/Low (=VAH/VAL) is a range of prices where the majority of trading volume took place. Naturally, Value Area High being the top price level and Value Area Low being the lowest. POC always is between the two.
/* HOW TO TRADE WITH THIS INDICATOR */
The basis for POC is determining bias on whichever timeframe you choose.
1. Identify a POC on the timeframe of your choosing.
/* If you choose a "low" timeframe (monthly here) then make sure to look at the higher timeframes to see how it is playing against a higher timeframe POC.
2. When the price is moving away from the POC (either to the upside or downside) this will confirm or invalidate the trade.
3. You can now enter the trade on bias or wait for a retest of the same POC.
/* EXAMPLE TRADES /*
Here is a screenshot of some of the trades that are possible solely using the POC and some common sense.
s3.tradingview.com

Volume Profile [LuxAlgo]Displays the estimate of a volume profile, with the option to show a rolling POC (point of control). Users can change the lookback, row size, and various visual aspects of the volume profile.
Settings
Basic:
Lookback: Number of most recent bars to use for the calculation of the volume profile
Row Size: Determines the number of rows used for the calculation of the volume profile
Show Rolling POC: Determines whether to display the rolling POC of the volume profile
Style:
Width (% of the box): Determines the length of the bars relative to the Lookback value
Bar Width: Width of each bar
Flip Histogram: Flips the histogram, when enabled, the histogram base will be located at the most recent candle
Gradient: Allows to color the volume profile bars with a gradient, with a color intensity determined by the length of each bar
Rows Solid Color: Color of each bar when 'Gradient' is disabled
POC Solid Color: Color of the POC when 'Gradient' is disabled
Usage
It is very common to display volume over time in order to visualize the trading activity made over a specific candle, however this is not the only way to display volume and it can be interesting to put it in relation with the price, which is what volume profiles do.
Volume profiles are displayed as price relative histograms showing the accumulated volume within certain price areas, the number of areas are determined by the row size of the volume profile. Knowing which price's area accumulated the most volume allow highlighting areas of interest to market participants.
Most accumulated volume will be encountered in zones of equilibrium between buyers and sellers; that is zones of local price stationarity. These zones are highlighted by high volume nodes in the volume profile. Imbalance between buyers and sellers are highlighted by thinner zones of the volume profile.
The price level with the most accumulated volume is highlighted by the "point of control" (POC), displayed by the dotted line in the indicator.
The POC is often considered an important level, commonly used as support/resistance by traders. One can verify the accuracy of this use case by using the rolling POC (assuming one would use the POC over time as SR).
Indicator Limitations
Volume profiles are calculated using tick data, which is not the case of this estimate, as such you won't have an accurate representation of an actual volume profile.
The rolling POC can introduce time outs in the script computation, use lower lookback and row size value to display it.

Reditum ScanReditum Scan allows you to synchronize the Market Profile Points of Control (POC) in different time intervals to a single graph.
Components of Reditum Scan:
POC's (30 min, 60 min, 120 min, 240 min, daily)
How does it work?
The algorithm allows you to identify areas of strong support and resistance, based on where most of the trading activity takes place.
What are the strategies for considering placing a trade?
1.Cluster (agglomeration of multiple POC's) to cluster (by identifying two clusters, the price could go smoothly from one Cluster to the other).
2. From cluster (agglomeration of multiple POCs, each with unique color. Now, from this cluster important movements may begin).
3. Towards a cluster (like the “from cluster” pattern, we identify areas of high interest for institutional companies, in this pattern the cluster acts like a magnet, if price is near it may be fully attracted towards the agglomeration).
If you are a member of the mastermind tribe please contact the support team within the tribe to access the indicator (do not leave personal or subscription data in the comments on this page), if not, please visit the link located in our signature.
Thanks for taking a look!
----------------------------------------------------------------------------------------------------------------------------------------------------------------------------------------------------------------------------------
Reditum Scan permite sincronizar los puntos de control (POC) de los perfiles de mercado en varios intervalos de tiempo en una sola gráfica.
Componentes de Reditum Scan:
POC´s (30 min, 60 min, 120 min, 240 min, diario)
¿Cómo funciona?
El algoritmo le permite identificar áreas de fuerte soporte y resistencia, según el lugar donde se lleva a cabo la mayor parte de la actividad comercial.
¿Cuáles son las estrategias para considerar una entrada?
1.Cluster (aglomeración de múltiples POC´s) a cluster (al identificar dos cluster el precio podría ir con fluidez desde uno al otro que lo recibe).
2.Desde cluster (lo identificamos con la aglomeración de múltiples POC identificados con colores que hacen fácil la lectura. Ahora, desde este cluster podrían iniciar movimientos importantes).
3.Hacia cluster (al igual que el patrón “desde cluster” identificamos zonas de alto interés para los institucionales, en este patrón el cluster actúa como un imán para el precio, de modo que cuando el precio está lejos de él, lo podría atraer con fuerza).
Para acceder a la herramienta, si usted es miembro de la tribu mastermind por favor comunicarse con el equipo de soporte dentro de la tribu (no dejar datos personales ni de suscripción en los comentarios de esta página), si no es miembro por favor visite el enlace a continuación en nuestra Firma.
Gracias por echarle un vistazo!.

Hancock - POC VAThis indicator shows POC (Point of Control) and VA (Value Area) High and Low as well as the developing ranges. This indicator makes use of the new arrays which means the resolution for calculating POC and VA is up to 100k bins at, in most cases, tick resolution and allows for custom time-frames.
Not much else needs to be said about this indicator.
Happy Trading
Hancock

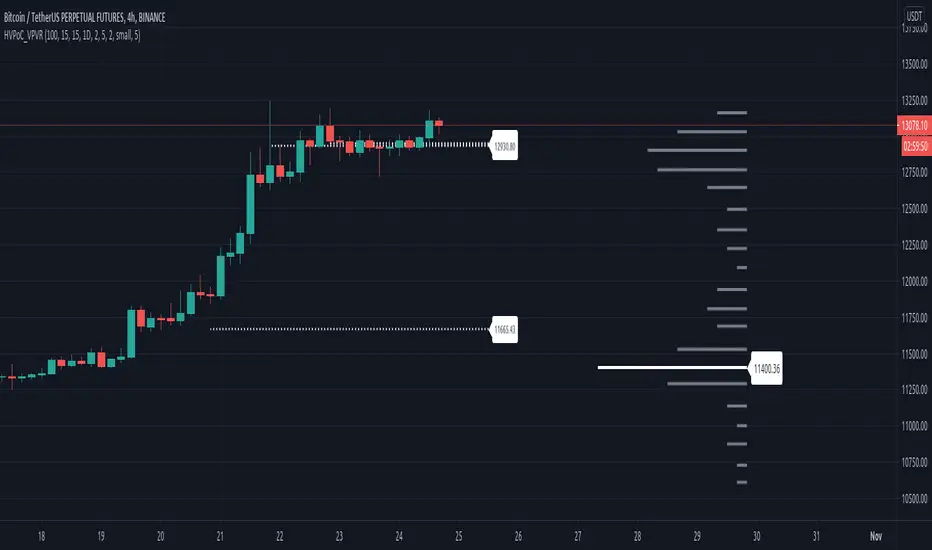
Historic VPoCs and pseudo VPVRThis study tries to recreate session based historic VPoCs
and VPVR Volume Profile
as they are used by
TradingLatino TradingView user.
It's aimed at BTCUSDT pair and 4h timeframe.
HOW IT WORKS
HOW IT WORKS - VPVR Profile Block
It gathers volume from the last chosen Bars
in order to draw the vpvr profile block
Volume that intersects with current level range
being studied is added to its value.
Additionally the current level price is modified
so that it matches the level price where most
of the volume has concentrated
So you get a pretty accurate price for drawn volume
while at the same time the levels are not stuck
to arbitrary level prices.
HOW IT WORKS - VPoC
It calculates a Volume Profile for the
given historic session but then
it only outputs that Volume Profile VPoC.
SETTINGS
Show VPVR Volume Profile {True}.
Show Historic VPoC lines {True}.
Show Historic VPoC labels {True}.
Extend Historic VPoC lines {True}: If this option is turned off the VPoC lines are only shown during the session duration.
Show tick difference from current price {False}: BETA. Feedback is needed because I'm not sure how it should work this setting.
VPVR Number of bars {100}: Define the Visible Range in number of bars so that its Volume Profile can be shown.
VPVR Profile width (in bars) {15}: VPVR Profile can be make larger or smaller in width thanks to this option.
VPVR Profile offset (in bars) {15}: VPVR Profile can be shown more to the left or to the right if the defaults do not suit you.
Historic Session Volume Profile timeframe {1D}: Historic VPoC use 1 day as their timeframe reference by default.
Number of decimal digits {2}: How many decimal digits are shown in label prices.
Number of previous sessions to print VPoC {5}: How many previous sessions VPoCs are to be printed. The maximum for this setting is 20.
Historic VPoC lines width (in pixels) {2}.
Historic VPoC labels size {small}.
History VPoC line offset (in bars) {5}: How far to the right VPoCs lines are to be extended. Note: This setting does not apply when 'Extend Historic VPoC lines' is set to 'False'.
WARNING
Please be aware that VPoC from the first previous session might not be accurate due to Pine Script limitations.
VPVR USAGE
This is not a VPVR like the official TradingView indicator.
This is a pseudo VPVR and that means it needs some manual input from you.
But, don't worry it's quite easy to do and if you always use the same number
of bars to calculate your VPVR then you might even just set it up once.
In order to show the VPVR (or Volume Profile on the Visible Range):
Rescale your chart so that you see all the bars for your Visible Range.
Click on the ruler tool.
Click on the last bar (far to the right) shown on the screen
Drag the ruler to first bar (far to the left) shown on the screen
Check what the ruler says
E.g. it says: 101 bars
Open this study settings
Modify: 'VPVR Number of bars ' setting
So that its value matches your measured number of bars (101)
Press OK to confirm and wait for the indicator to refresh.
STRATEGY USAGE
If your strategy uses VPoC
to define your resistances
or supports
you can check the VPoCs shown here.
FEEDBACK
I have only used this identifier in BTCUSDT 4h timeframe.
I'm interested to know what needs to be tweaked
in other securities and timeframes.
PINE STUDY TRICK
This study let's you choose the number of decimals the label will use.
CREDITS
I have reused and adapted some code from
'Poor man's volume profile' study
which it's from TradingView IldarAkhmetgaleev user.
I also wanted to thank him for helping me understanding his study.
I have reused some code from
'MTF Selection Framework - PineCoders FAQ' study
which it's from TradingView PineCoders user.
cPOC [Plot]This is a point of control script based between the length of two different conditions and the last time they were true (barssince() or whatever)
Been wanting to make this for a while simply because volume doesn't care about time, so why would a session based POC matter with that logic mind?
Will be improving on this more in time, just happy with the results of this prototype for now and figured it may be the first script I've ever made people will find useful so why not release it
This is the plots version (utilizing plot() instead of line.new) for longer lines and for the color change. Laggy if utilizing all the levels but my preferred version.
P.S. Thanks, Showerhead. You're finally cool

cPOC [Line]This is a point of control script based between the length of two different conditions and the last time they were true (barssince() or whatever)
Been wanting to make this for a while simply because volume doesn't care about time, so why would a session based POC matter with that logic mind?
Will be improving on this more in time, just happy with the results of this prototype for now and figured it may be the first script I've ever made people will find useful so why not release it
This is the lines version (utilizing line.new instead of plot()) for people who want a less laggy chart. Sacrifices the color flip for minimal lag and lines are much shorter.
P.S. Thanks, @paaax for the color switcher

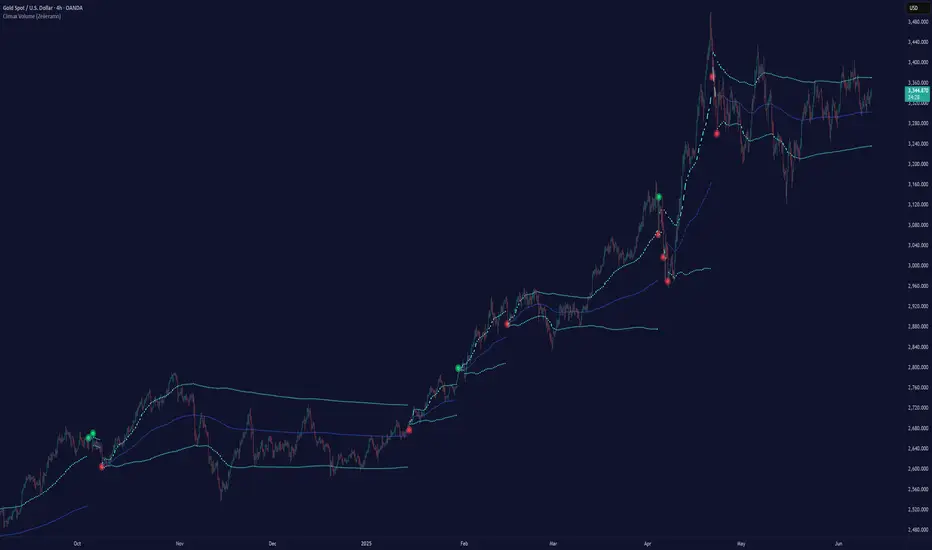
Climax Volume (Zeiierman)█ Overview
Climax Volume (Zeiierman) isolates extreme participation events to pinpoint when price action reaches exhaustion. These moments of volume climax often precede reversals, pauses, or key balance shifts, offering traders an early read on changing market dynamics. Instead of treating volume as a passive tally, it locates climax bars, abnormally large activity bursts, and anchors a Point of Control (PoC) that tracks where post-climax transactions concentrate. The result is a clear read on when participation is peaking, where value re-centers afterward, and how far price can reasonably deviate before reverting.
This tool is designed for multi-context use, such as intraday execution, swing confirmation, or structural bias analysis, offering a precise view of where volume matters, not just how much.
⚪ Why This One Is Unique
Unlike conventional volume-spike indicators, Climax Volume (Zeiierman) integrates adaptive extremum detection, a dynamic PoC core, and multi-layer deviation envelopes that evolve in real time with market context.
Internally, it fuses bid–ask volume delta modeling with re-normalized dispersion mapping to measure the directional imbalance driving each climax event. The system continuously evaluates delta asymmetry between buying and selling pressure to refine the detection of true participation extremes. This allows the engine to differentiate between constructive volume expansion (trend continuation) and exhaustive volume spikes (potential reversals).
█ Main Features
⚪ Climax Volume
The Climax Volume Engine isolates statistically significant bursts in participation that indicate potential turning points or exhaustion phases. It identifies climax bars—instances where volume reaches regime-level extremes relative to recent activity—and classifies them as bullish (green) or bearish (red) based on directional dominance. These events highlight where aggressive activity peaks and often mark the start of structural imbalance, providing early cues for reversal, absorption, or renewed continuation.
⚪ Point of Control (PoC)
Each climax event dynamically re-anchors a Point of Control (PoC)—the evolving price center of post-climax volume distribution. The PoC tracks where transaction density stabilizes after an extreme burst, forming the reference core of a control zone. From this anchor, the system projects upper and lower tolerance bands to define acceptable deviation ranges, contextualizing how far the price can travel before reverting or rebalancing.
█ How to Use
⚪ Trend Following
Use the Volume Point of Control (PoC) as a dynamic guide to assess directional bias. The PoC effectively acts as a moving equilibrium line, continuously updating to reflect where trading volume and market influence are concentrated.
When price holds above the PoC, it signals sustained bullish sentiment and active accumulation.
When the price remains below, it confirms bearish control and ongoing distribution.
⚪ Trend Continuation Retests
The slope of the PoC reflects the strength and persistence of market momentum. The steeper the PoC slope, the stronger the active momentum. A flat or neutral PoC typically signals consolidation or low conviction — conditions better avoided for trend trades.
In a bullish scenario , watch for the price to retest the PoC or the lower tolerance band after a pullback. A successful rejection of that zone often signals that buyers are defending control, providing a high-probability continuation entry.
In a bearish scenario , when the PoC slopes downward, wait for the price to retest it from below. If the market fails to reclaim that level, it indicates that sellers remain dominant, and downside momentum is likely to continue.
⚪ Reversals
Climax Points — the color-coded circles that appear during moments of extreme volume. These signals indicate that the market may soon pause, reverse, or rotate back toward the PoC equilibrium.
🟢 Bullish Climax Points emerge when heavy buying reaches unsustainable levels, often signaling a buyer exhaustion event or a possible local top formation.
🔴 Bearish Climax Points form during high-intensity selling bursts, warning of seller exhaustion and potential bottoming conditions.
⚪ Confirm Breakouts
High-volume breakouts confirmed by Climax Volume signals often mark the initiation of strong directional moves. When climax confirmation aligns with a structural break, it validates that the breakout is backed by genuine participation — not just thin volatility spikes — increasing the probability of follow-through and trend expansion.
Identify a key support or resistance zone manually or with your preferred structural tool.
Wait for a climax signal to coincide with a break beyond that level.
For bullish breakouts , a green climax point appearing as price pushes above resistance confirms that buyers are stepping in with conviction.
For bearish breakouts , a red climax point forming as price drops through support indicates that real selling pressure is driving the move.
█ How It Works
⚪ Climax Detection
Identifies participation surges within a dynamic volume–price field to isolate genuine activity extremes rather than simple bar-size anomalies.
Calculation: Utilizes adaptive extremum detection on a re-normalized volume–delta composite with regime-sensitive thresholds and variance filters to extract statistically valid climax events.
⚪ Point of Control (PoC)
Defines the evolving price centroid where post-climax transactions cluster, continuously adapting to shifting participation density.
Calculation: Employs a volume-weighted delta balance framework with incremental accumulation and curvature-preserving smoothing, ensuring stability while maintaining local reactivity to order-flow asymmetry.
⚪ Tolerance Bands
Outlines a probabilistic corridor around the PoC that distinguishes expected fluctuation from meaningful deviation.
Calculation: Implements variance-aware dispersion modeling with contextual weighting derived from real-time delta gradients, projecting symmetric envelopes scaled by adaptive multipliers.
-----------------
Disclaimer
The content provided in my scripts, indicators, ideas, algorithms, and systems is for educational and informational purposes only. It does not constitute financial advice, investment recommendations, or a solicitation to buy or sell any financial instruments. I will not accept liability for any loss or damage, including without limitation any loss of profit, which may arise directly or indirectly from the use of or reliance on such information.
All investments involve risk, and the past performance of a security, industry, sector, market, financial product, trading strategy, backtest, or individual's trading does not guarantee future results or returns. Investors are fully responsible for any investment decisions they make. Such decisions should be based solely on an evaluation of their financial circumstances, investment objectives, risk tolerance, and liquidity needs.
付费脚本
Jurik RSX+Hello friends,
Meet Jurik RSX+, a powerful standalone oscillator that also integrates perfectly with Profitable Jurik RSX optimizer.
It enhances Jurik's original RSX by introducing a Values Distribution Profile , Point of Control (POC) , and Value Area visualization — transforming a traditional oscillator into a statistically guided market sentiment tool.
These additions help identify where true equilibrium, overbought, and oversold zones occur based on the actual behavior of RSX values rather than fixed numeric levels.
🛠 How It Works
Jurik RSX+ applies advanced smoothing and statistical profiling to analyze how RSX values are distributed over time.
The Values Distribution Profile builds a frequency map of RSX activity, allowing traders to see:
The Point of Control (POC) — the statistically dominant RSX level.
The Value Area — the range where RSX values cluster most frequently.
By studying this distribution, the indicator reveals true overbought, oversold, and midline zones , adapting dynamically to different instruments and market conditions.
On top of that, traders can construct fully customized Buy/Sell signals using crossover conditions between RSX, Signal Line, Midline, or POC — creating a flexible signal generation framework.
🔥 Key Features
Jurik RSX foundation with enhanced smoothing and adaptive distribution modeling
Values Distribution Profile identifying statistically balanced and extreme zones
Point of Control (POC) and Value Area visualization for precision analysis
Customizable Buy/Sell logic — up to 4 Buy and 4 Sell slots using flexible crossover conditions
Strategy Mode preventing overlapping Buy/Sell signals
Multiple visualization styles — Labels , Dots , Stripes , or combined modes
Integrated alerts for RSX, POC, and OB/OS conditions
If you'd like access or have any questions, feel free to reach out to me directly via DM.
👋 Good luck and happy trading!
付费脚本

RSI+A free addon for Profitable RSI . Equipped with RSI Values Distribution Profile, Point of Control, Value Area (customizable % based) and alert system.

Volume Profile Free Ultra SLI (100 Levels Value Area VWAP) - RRBVolume Profile Free Ultra SLI by RagingRocketBull 2019
Version 1.0
This indicator calculates Volume Profile for a given range and shows it as a histogram consisting of 100 horizontal bars.
This is basically the MAX SLI version with +50 more Pinescript v4 line objects added as levels.
It can also show Point of Control (POC), Developing POC, Value Area/VWAP StdDev High/Low as dynamically moving levels.
Free accounts can't access Standard TradingView Volume Profile, hence this indicator.
There are several versions: Free Pro, Free MAX SLI, Free Ultra SLI, Free History. This is the Free Ultra SLI version. The Differences are listed below:
- Free Pro: 25 levels, +Developing POC, Value Area/VWAP High/Low Levels, Above/Below Area Dimming
- Free MAX SLI: 50 levels, 2x SLI modes for Buy/Sell or even higher res 150 levels
- Free Ultra SLI: 100 levels, packed to the limit, 2x SLI modes for Buy/Sell or even higher res 300 levels
- Free History: auto highest/lowest, historic poc/va levels for each session
Features:
- High-Res Volume Profile with up to 100 levels (line implementation)
- 2x SLI modes for even higher res: 300 levels with 3x vertical SLI, 100 buy/sell levels with 2x horiz SLI
- Calculate Volume Profile on full history
- POC, Developing POC Levels
- Buy/Sell/Total volume modes
- Side Cover
- Value Area, VAH/VAL dynamic levels
- VWAP High/Low dynamic levels with Source, Length, StdDev as params
- Show/Hide all levels
- Dim Non Value Area Zones
- Custom Range with Highlighting
- 3 Anchor points for Volume Profile
- Flip Levels Horizontally
- Adjustable width, offset and spacing of levels
- Custom Color for POC/VA/VWAP levels, Transparency for buy/sell levels
WARNING:
- Compilation Time: 1 min 20 sec
Usage:
- specify max_level/min_level/spacing (required)
- select range (start_bar, range length), confirm with range highlighting
- select volume type: Buy/Sell/Total
- select mode Value Area/VWAP to show corresponding levels
- flip/select anchor point to position the buy/sell levels
- use Horiz Buy/Sell SLI mode with 100 or Vertical SLI with 300 levels if needed
- use POC/Developing POC/VA/VWAP High/Low as S/R levels. Usually daily values from 1-3 days back are used as levels for the current day.
SLI:
use SLI modes to extend the functionality of the indicator:
- Horiz Buy/Sell 2x SLI lets you view 100 Buy/Sell Levels at the same time
- Vertical Max_Vol 3x SLI lets you increase the resolution to 300 levels
- you need at least 2 instances of the indicator attached to the same chart for SLI to work
1) Enable Horiz SLI:
- attach 2 indicator instances to the chart
- make sure all instances have the same min_level/max_level/range/spacing settings
- select volume type for each instance: you can have a buy/sell or buy/total or sell/total SLI. Make sure your buy volume instance is the last attached to be displayed on top of sell/total instances without overlapping.
- set buy_sell_sli_mode to true for indicator instances with volume_type = buy/sell, for type total this is optional.
- this basically tells the script to calculate % lengths based on total volume instead of individual buy/sell volumes and use ext offset for sell levels
- Sell Offset is calculated relative to Buy Offset to stack/extend sell after buy. Buy Offset = Zero - Buy Length. Sell Offset = Buy Offset - Sell Length = Zero - Buy Length - Sell Length
- there are no master/slave instances in this mode, all indicators are equal, poc/va levels are not affected and can work independently, i.e. one instance can show va levels, another - vwap.
2) Enable Vertical SLI:
- attach the first instance and evaluate the full range to roughly determine where is the highest max_vol/poc level i.e. 0..20000, poc is in the bottom half (third, middle etc) or
- add more instances and split the full vertical range between them, i.e. set min_level/max_level of each corresponding instance to 0..10000, 10000..20000 etc
- make sure all instances have the same range/spacing settings
- an instance with a subrange containing the poc level of the full range is now your master instance (bottom half). All other instances are slaves, their levels will be calculated based on the max_vol/poc of the master instance instead of local values
- set show_max_vol_sli to true for the master instance. for slave instances this is optional and can be used to check if master/slave max_vol values match and slave can read the master's value. This simply plots the max_vol value
- you can also attach all instances and set show_max_vol_sli to true in all of them - the instance with the largest max_vol should become the master
Auto/Manual Ext Max_Vol Modes:
- for auto vertical max_vol SLI mode set max_vol_sli_src in all slave instances to the max_vol of the master indicator: "VolumeProfileFree_MAX_RRB: Max Volume for Vertical SLI Mode". It can be tricky with 2+ instances
- in case auto SLI mode doesn't work - assign max_vol_sli_ext in all slave instances the max_vol value of the master indicator manually and repeat on each change
- manual override max_vol_sli_ext has higher priority than auto max_vol_sli_src when both values are assigned, when they are 0 and close respectively - SLI is disabled
- master/slave max_vol values must match on each bar at all times to maintain proper level scale, otherwise slave's levels will look larger than they should relative to the master's levels.
- Max_vol (red) is the last param in the long list of indicator outputs
- the only true max_vol/poc in this SLI mode is the master's max_vol/poc. All poc/va levels in slaves will be irrelevant and are disabled automatically. Slaves can only show VWAP levels.
- VA Levels of the master instance in this SLI mode are calculated based on the subrange, not the whole range and may be inaccurate. Cross check with the full range.
WARNING!
- auto mode max_vol_sli_src is experimental and may not work as expected
- you can only assign auto mode max_vol_sli_src = max_vol once due to some bug with unhandled exception/buffer overflow in Tradingview. Seems that you can clear the value only by removing the indicator instance
- sometimes you may see a "study in error state" error when attempting to set it back to close. Remove indicator/Reload chart and start from scratch
- volume profile may not finish to redraw and freeze in an ugly shape after an UI parameter change when max_vol_sli_src is assigned a max_vol value. Assign it to close - VP should redraw properly, but it may not clear the assigned max_vol value
- you can't seem to be able to assign a proper auto max_vol value to the 3rd slave instance
- 2x Vertical SLI works and tested in both auto/manual, 3x SLI - only manual seems to work (you can have a mixed mode: 2nd instance - auto, 3rd - manual)
Notes:
- This code uses Pinescript v3 compatibility framework
- This code is 20x-30x faster (main for cycle is removed) especially on lower tfs with long history - only 4-5 sec load/redraw time vs 30-60 sec of the old Pro versions
- Instead of repeatedly calculating the total sum of volumes for the whole range on each bar, vol sums are now increased on each bar and passed to the next in the range making it a per range vs per bar calculation that reduces time dramatically
- 100 levels consist of 50 main plot levels and 50 line objects used as alternate levels, differences are:
- line objects are always shown on top of other objects, such as plot levels, zero line and side cover, it's not possible to cover/move them below.
- all line objects have variable lengths, use actual x,y coords and don't need side cover, while all plot levels have a fixed length of 100 bars, use offset and require cover.
- all key properties of line objects, such as x,y coords, color can be modified, objects can be moved/deleted, while this is not possible for static plot levels.
- large width values cause line objects to expand only up/down from center while their length remains the same and stays within the level's start/end points similar to an area style.
- large width values make plot levels expand in all directions (both h/v), beyond level start/end points, sometimes overlapping zero line, making them an inaccurate % length representation, as opposed to line objects/plot levels with area style.
- large width values translate into different widths on screen for line objects and plot levels.
- you can't compensate for this unwanted horiz width expansion of plot levels because width uses its own units, that don't translate into bars/pixels.
- line objects are visible only when num_levels > 50, plot levels are used otherwise
- Since line objects are lines, plot levels also use style line because other style implementations will break the symmetry/spacing between levels.
- if you don't see a volume profile check range settings: min_level/max_level and spacing, set spacing to 0 (or adjust accordingly based on the symbol's precision, i.e. 0.00001)
- you can view either of Buy/Sell/Total volumes, but you can't display Buy/Sell levels at the same time using a single instance (this would 2x reduce the number of levels). Use 2 indicator instances in horiz buy/sell sli mode for that.
- Volume Profile/Value Area are calculated for a given range and updated on each bar. Each level has a fixed length. Offsets control visible level parts. Side Cover hides the invisible parts.
- Custom Color for POC/VA/VWAP levels - UI Style color/transparency can only change shape's color and doesn't affect textcolor, hence this additional option
- Custom Width - UI Style supports only width <= 4, hence this additional option
- POC is visible in both modes. In VWAP mode Developing POC becomes VWAP, VA High and Low => VWAP High and Low correspondingly to minimize the number of plot outputs
- You can't change buy/sell level colors from input (only transparency) - this requires 2x plot outputs => 2x reduces the number of levels to fit the max 64 limit. That's why 2 additional plots are used to dim the non Value Area zones
- You can change level transparency of line objects. Due to Pinescript limitations, only discrete values are supported.
- Inverse transp correlation creates the necessary illusion of "covered" line objects, although they are shown on top of the cover all the time
- If custom lines_transp is set the illusion will break because transp range can't be skewed easily (i.e. transp 0..100 is always mapped to 100..0 and can't be mapped to 50..0)
- transparency can applied to lines dynamically but nva top zone can't be completely removed because plot/mixed type of levels are still used when num_levels < 50 and require cover
- transparency can't be applied to plot levels dynamically from script this can be done only once from UI, and you can't change plot color for the past length bars
- All buy/sell volume lengths are calculated as % of a fixed base width = 100 bars (100%). You can't set show_last from input to change it
- Range selection/Anchoring is not accurate on charts with time gaps since you can only anchor from a point in the future and measure distance in time periods, not actual bars, and there's no way of knowing the number of future gaps in advance.
- Adjust Width for Log Scale mode now also works on high precision charts with small prices (i.e. 0.00001)
- in Adjust Width for Log Scale mode Level1 width extremes can be capped using max deviation (when level1 = 0, shift = 0 width becomes infinite)
- There's no such thing as buy/sell volume, there's just volume, but for the purposes of the Volume Profile method, assume: bull candle = buy volume, bear candle = sell volume
P.S. I am your grandfather, Luke! Now, join the Dark Side in your father's steps or be destroyed! Once more the Sith will rule the Galaxy, and we shall have peace...

Session Volume Profile v1.0This script is a continuous Real Time Session Based (1D) Volume Profile . It emulates TV's built in Volume Profile Session Volume function.
It looks at the real time volume for a given session (1 day) and updates the following three elements for that day in real time:
Point of Control ( POC )
Value Area High ( VAH )
Value Area Low ( VAL )
There are 2 standard parameters:
Number of Bins/Rows : The granularity of the volume profile, the higher the number the more precise the calculations will be but will load slower, ideal is 16/32.
Percent for Value Area : Percent of total volume traded that you would like to be shown as a fill around the POC (maximum volume bin/row)
There are also 2 non standard parameters:
Checkbox for slower loading but more precise Value Area Calculation, checked = enabled, unchecked = disabled
Checkbox for more volatile symbols, check this if the price action is outside of the white dotted lines, default is disabled, checked = enabled, unchecked = disabled
POC: White Stepline
Value Area High: Highest Blue Line marking the top of the fill (Value Area)
Value Area Low: Lowest White Line marking the bottom of the fill
Please pm me if you are interested in trying this script out; I am also available for hire to work on custom scripts. Ty
