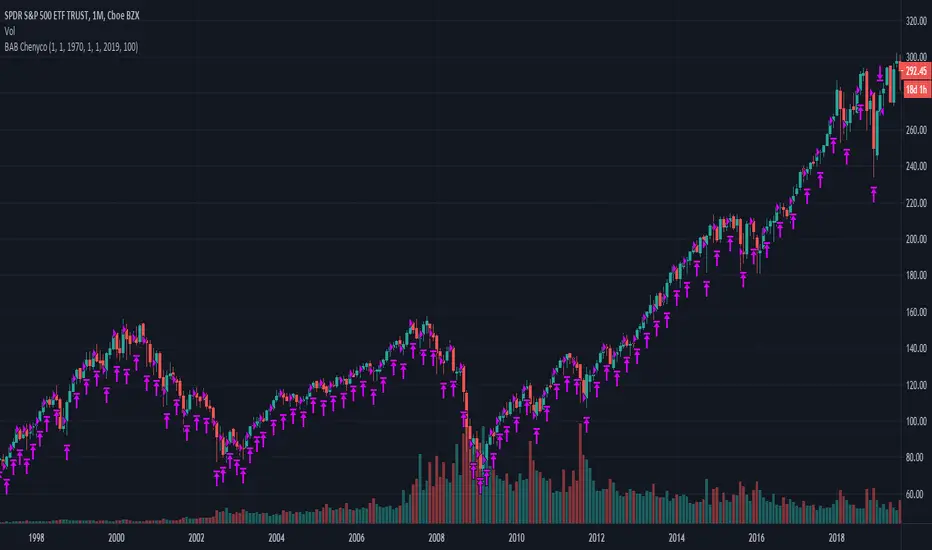
Buy Any Bar By ChenycoBuys amount of shares by bars with specified amount of money (100$ for a month bar for example).
Including commissions.
Ratio
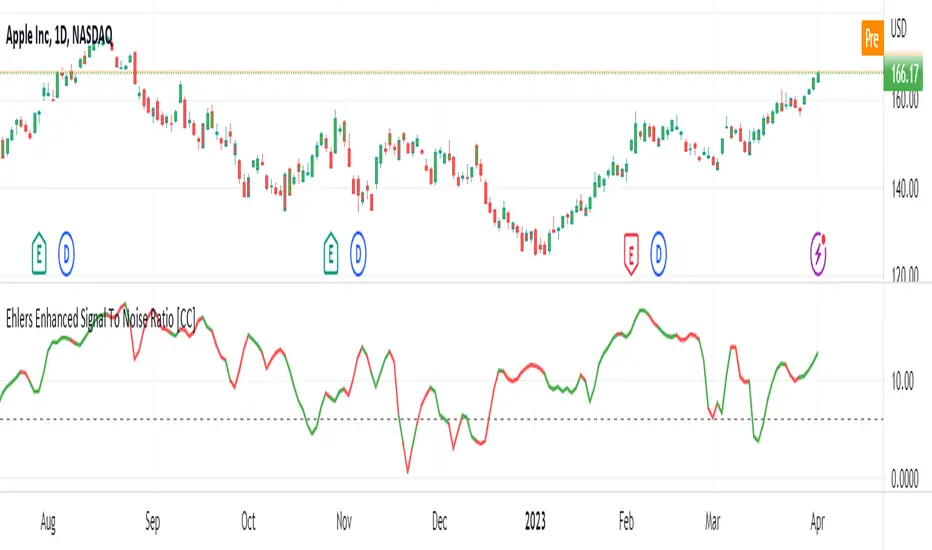
Ehlers Enhanced Signal To Noise Ratio [CC]The Enhanced Signal To Noise Ratio was created by John Ehlers (Rocket Science For Traders pgs 87-88) and this is my favorite Ehlers Signal To Noise Ratio indicator. Scalpers like to use this indicator because when it is above the dotted line then the stock is trending and not trading sideways. Buy when the indicator line is green and sell when it is red.
Let me know when you want to see me publish other indicators or if you want something custom done!
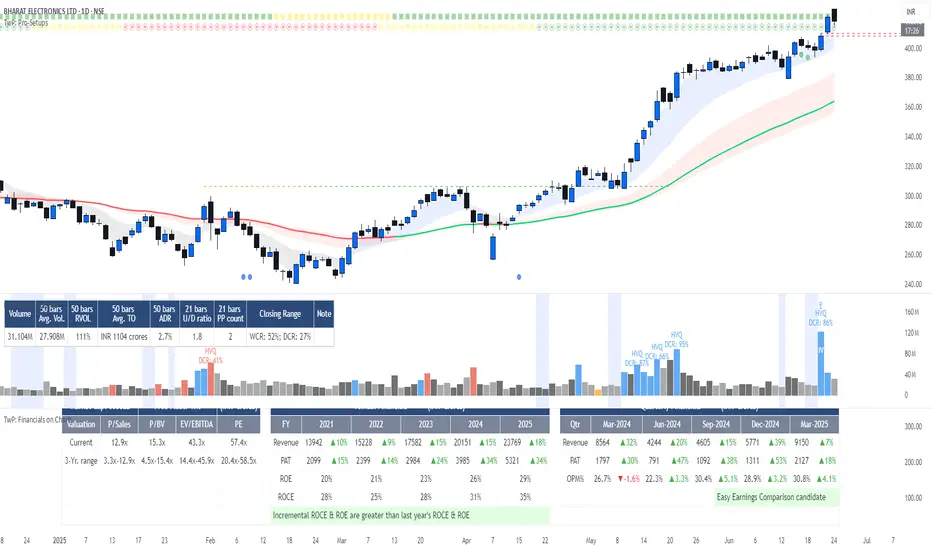
TwP: Financials on ChartsWith this indicator, you can see the following on a chart:
> An Info Panel , with the financial snapshot of the company, such as its market capitalization, annual & quarterly financials, Y/Y growth numbers, profitability margins, RoE & RoCE, and valuation ratios.
> EBITDA and PAT margins over a period of time.
> RoE and RoCE ratios over a period of time.
> Valuation multiples over a period of time.
> A comparison of margins, return ratios, and valuation multiples with any peer-group company .
Info Panel
This gives a quick snapshot of the financials of the company, which includes annual & quarterly Revenue, EBITDA, PAT, margins with Y/Y changes, Debt-Equity ratio, ROE, ROCE, and valuation multiples.
Profitability & Return Ratios
You can view quarterly as well as annual EBITDA & PAT margins and annual RoE, RoCE. You can choose to see these ratios either only for the company or can also add a peer company to compare.
Valuation Ratios
You can view TTM valuation ratios such as EV/Sales, EV/EBITDA, P/BV & P/E multiples. You can choose to see these valuation multiples either only for the company or can also add a peer company to compare.
LotSizeCalc_v1 (EUR)Hey there,
here I like to publish my first TradingView Script for the Indicator "LotSizeCalc" which calculates the LotSize for the currency '€' for e.g. the MT4-App depending on the following parameters:
- Stop Loss in pips (example: 30 pips)
- Account Balance in EUR (example: 500€)
- Risk in % (example: 1%)
It is very similar to the MyFxBook Calculator on their website, where you can compare the results for the lotsize.
You receive the calculated value next to the indicator, and - for mobile device - it also shows a label with the calculated lotsize (which you can deacivate via settings if you like).
The indicator works for the included common foreign Forex pairs (AUD, CAD, CHF, JPY, JPY, GBP, NZD, USD) in order to calculate the risk to a EUR-Trading Account.
Actually, the Script allows in general some adaptations due to your trading system. This one is the most basic version.
Happy pips and I wish you safe and risk-calculated trading!
Marcel :)

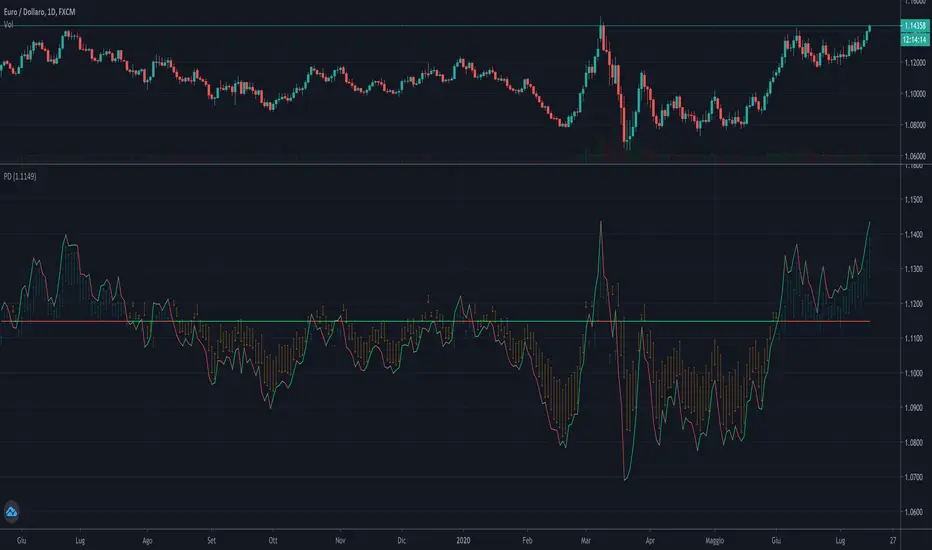
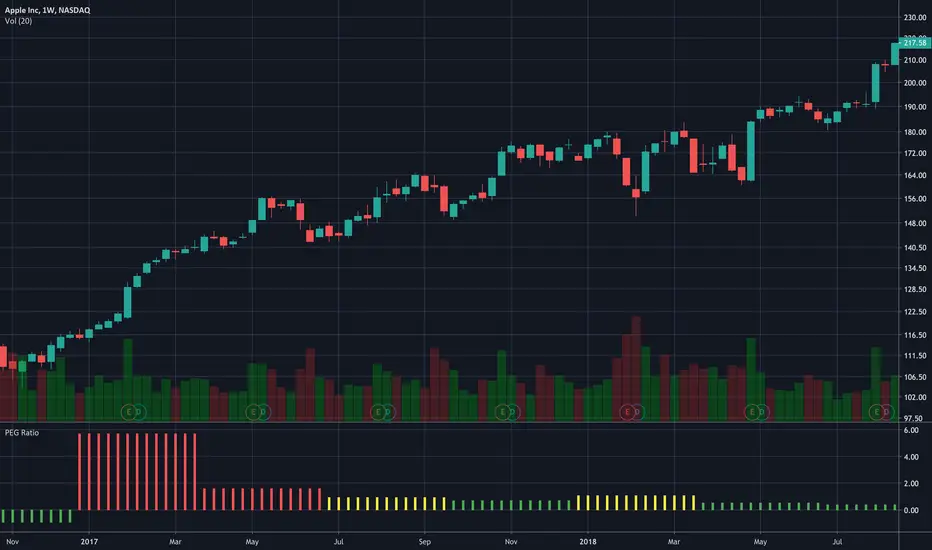
PEG RatioHello everyone,
Quick script to check the PEG Ratio.
What is PEG Ratio?
The price/earnings to growth ratio (PEG Ratio) is a stock's price-to-earnings (P/E) ratio divided by the growth rate of its earnings for a specified time period. The PEG ratio is used to determine a stock's value while also factoring in the company's expected earnings growth, and is thought to provide a more complete picture than the more standard P/E ratio.
A PEG Ratio greater than 1.0 means that the stock is overvalued, while below 1.0 means is is undervalued. When the PEG Ratio is exactly 1.0, then the stock is trading at fair valuation.
Formula:
PEG Ratio = (Price / EPS) / EPS Growth
Examples:
Company A:
Price per share = $46
EPS this year = $2.09
EPS last year = $1.74
Company B
Price per share = $80
EPS this year = $2.67
EPS last year = $1.78
Company A
P/E ratio = $46 / $2.09 = 22
Earnings growth rate = ($2.09 / $1.74) - 1 = 20%
PEG ratio = 22 / 20 = 1.1
Company B
P/E ratio = $80 / $2.67 = 30
Earnings growth rate = ($2.67 / $1.78) - 1 = 50%
PEG ratio = 30 / 50 = 0.6
The company A is overvalued whiled the B is undervalued.
In this script an overvalued stock is considered when the PEG Ratio is above 1.1, while it is 0.9 for an undervalued stock.
Only works with Stocks.
Happy trading,
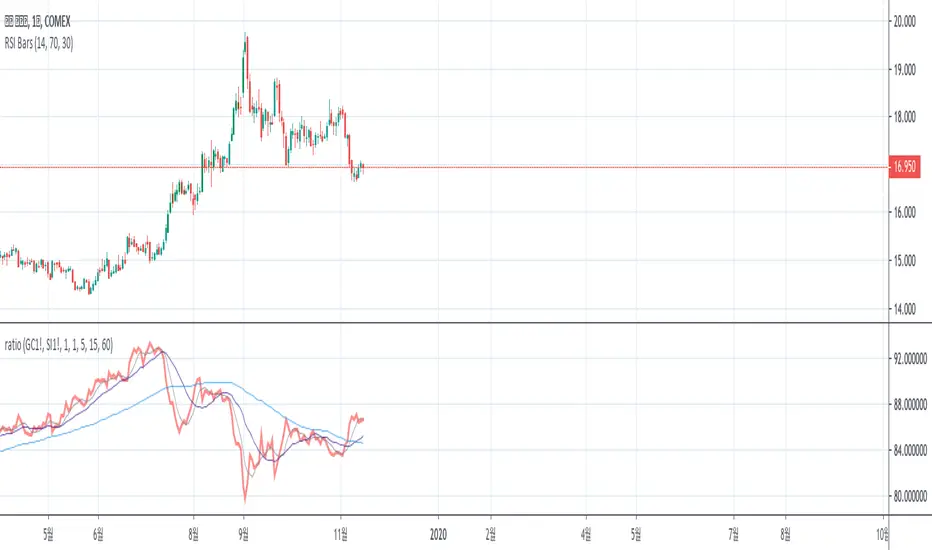
Gold-Stocks RatioA historic risk-off flag.
When the Gold-Stocks Ratio is above the 200 week moving average, investors may fair better holding gold and avoiding equities, as was the case for the last 20 years.

RSI LevelsRSI Levels
- The relative strength index ( RSI ) is a technical indicator used in the analysis of financial markets.
It is intended to chart the current and historical strength or weakness of a stock or market based on the closing prices of a recent trading period.
- This indicator allows us to visualize the levels of rsi in the chart, so that we can calculate take profit and stop points in a simple way,
knowing what position the price is currently in relation to these levels and how much space we have.
- We can also visualize the slope of the three levels of rsi , overbought, oversold and level 50, something that is not possible in the oscillator version.
- It allows you to display 2 rsi values at the same time.
- Allows to change the color of candlesticks based on rsi.


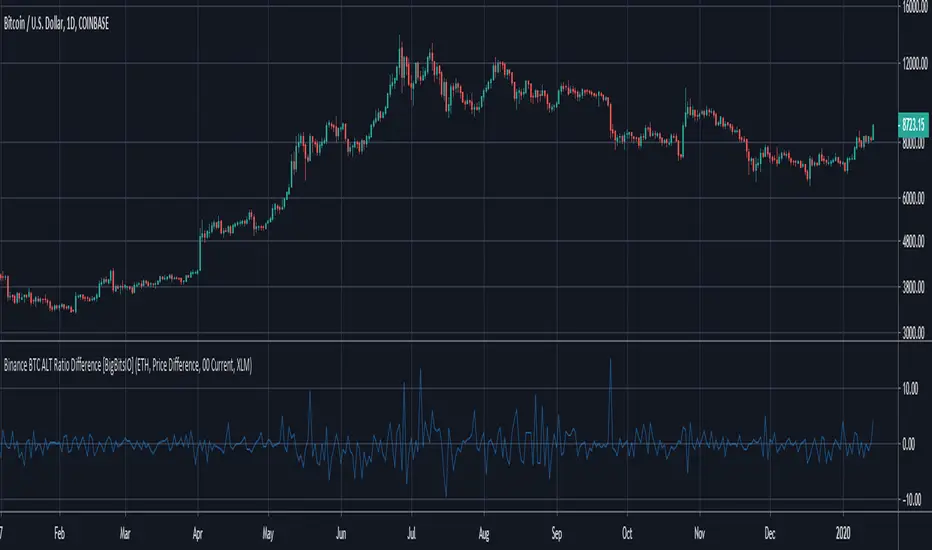
Binance BTC ALT Ratio Difference [BigBitsIO]This was a follower suggested script. This script compares the USDT and BTC relative prices of a particular altcoin traded on Binance by calculating it's USDT price comparative to BTC. This is a very simple calculation (ALT/USDT price divided by ALT/BTC price). From there, we simply subtract the BTC/USDT price from the ALT ration price and we can see if a coin is trading comparatively high or low compared to it's BTC relative price.
This indicator may or may not be useful for you. However, for the purposes of my development series for indicators, I have published it to highlight the ability to concatenate strings to manipulate securities.
Features:
- Dropdown to choose from several built-in altcoin selections.
- Dropdown to choose to show a USDT base difference in the ratio, or a percentage based difference (might be useful for considering fees).
- Dropdown to choose the resolution of the indicator.
- Checkbox to toggle the option to use a custom altcoin.
- Text input to allow entry of a custom altcoin from Binance. Please only use the prefix on its trading pair vs. BTC. I cannot guarantee this will work with all altcoins. They must be traded vs. USDT and BTC on Binance.
- Concatenated strings to manipulate selected securities.
*** DISCLAIMER: For educational and entertainment purposes only. Nothing in this content should be interpreted as financial advice or a recommendation to buy or sell any sort of security or investment including all types of crypto. DYOR, TYOB. ***
Bitcoin Halving CountdownHello traders,
I offer you today the BTC halving countdown updated in real-time on your charts
I inspired myself greatly from the gentleman @everget's script LTC halving countdown below
(
The countdown date is coming from that source www.bitcoinblockhalf.com.
The halving date is estimated to be around May 13th, 2020 .
That date is hardcoded in the script and is used for the countdown calculation.
The Bitcoin block mining reward halves every 210,000 blocks, the coin reward will decrease from 12.5 to 6.25 coins.
Enjoy the weekend
Dave

BTC Mining Cost - IndicatorBTC Mining Cost Indicator
- Adjust the Emission Rate after each halving, currently it's 12.5
- Current settings are for the Antminer S17 with an average cost of 12 cents per kWh
As you can see, a bounce usually follows when the price hits the cost of mining 1 BTC .
I would love to hear your feedback, and if you like it please gimme a thumbs up ❤️
Happy Trading!

Murreys Math Lines Box OR Ratio PivotsI'm publishing my second script, though nothing extraordinary, I believe there is user group for Murry Math indies and the only "proper one" (According to my usage) I found was of RicardoSantos, here is the link :
He developed that script in 2014 and it is in need of update to Pine V4 and I'm doing the needful as its user.
All the updates from my end are listed below:
1. Updated to Pine V4
2. Automatic octave selection
3. In auto mode one can switch octave
4. This script is color coded with intention of use on dark theme, one can change the colors to use it on white background with simple few clicks as pinelines have been used
Other thing I want to add is that usage of this is not very clear to many users, so I'll do little explaining here;
Lets start with what is Octave? Octave is basically distance between square of two whole numbers, this is hard-fast method to calculate, Murry has made it far more complicated to use practically. In mathematical formula terms it could be something like this for script trading at 11890 (CMP)
Step 1: Square Root of CMP i.e Square Root of 11890 = 109.041 = Rounded to 109
Step 2: You can either take one whole number higher or lower than 109, which is 108 or 110. We will take 108
Step 3: Square of 108 = 11664 and Square of 109 = 11881
Step 4: Octave => Distance between (Lowlevel) 11664 and (Higherlevel) 11881
I've automated it so you don't need to calculate, but there is also manual entry possible if you want to calculate octaves yourself, there are different ways to calculate and some like to just take High and Low's of the day or week or month, whatever you like. When I used it I did it strictly this way, so automation is based on it. This is very subjective matter so don't ask to change the calculation of this, if I started doing that every second person would ask me to modify it to different calculation..and thats...just not possible to do.
This is output for calculation we just did above
This is octave shift option (Which basically shifts to next whole number square in above calculation)
Normal nomenclature on octaves and important color codes
+2/8: Extreme overbought = Blue Color and solid line
+1/8: OverBought
8/8: Hardest line to rise above (overbought) = White Color and solid line
7/8: Fast reverse line (weak)
6/8: Pivot reverse line = Yellow Color and solid line
5/8: Upper trading range
----------------------------------------
4/8: Major reversal line = Green Color and solid line
----------------------------------------
3/8: Lower trading range
2/8: Pivot reverse line = Blue Color and solid line
1/8: Fast reverse line (weak)
0/8: Hardest line to fall below (oversold) = White Color and solid line
-1/8: Oversold
-2/8: Extreme Oversold = Yellow Color and solid line
Other lines that I've not mentioned color codes for are minor and are usually plotted in dotted format.
Resources on complete technique to trade and importance of levels (highly recommended to read carefully before trading), if you don't know how to get this for free don't worry you can just google Murrey math and you will find it somewhere, its just that it would be in little scattered manner.
www.scribd.com
Enjoy!

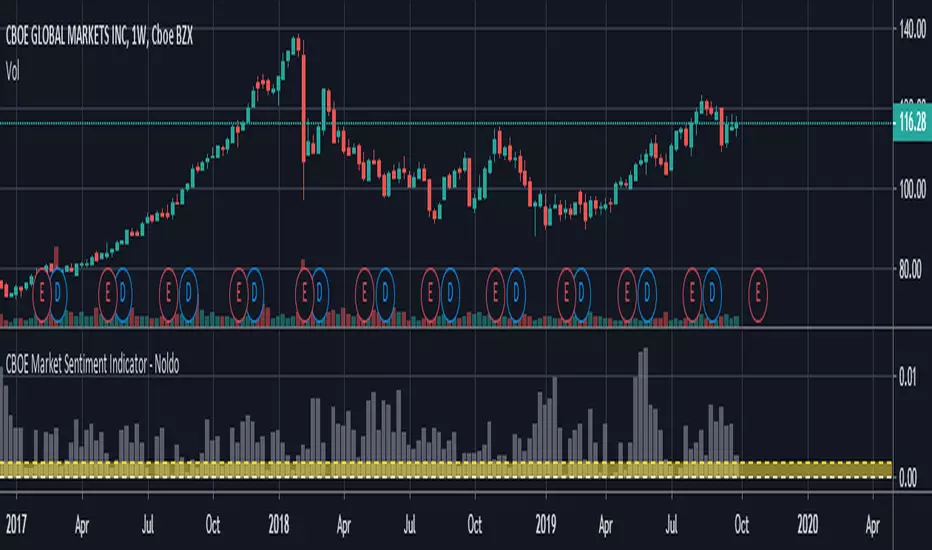
Call / All Ratio ( C / A ) - NoldoFirst of all this script inspired by MagicEins' Put/Call-Ratio-Buschi script .
What is the Put-Call Ratio
The put-call ratio is an indicator ratio that provides information about relative trading volumes of an underlying security's put options to its call options. The put-call ratio has long been viewed as an indicator of investor sentiment in the markets, where a large proportion of puts to calls indicates bearish sentiment, and vice versa. Technical traders use the put-call ratio as an indicator of performance and as a barometer of overall market sentiment. Put-call ratios on broader indexes such as the S&P 500 are also used as more general gauges of market climate.
Put-Call Ratio Interpretation
One way to interpret the put-call ratio is to say that a higher ratio means it's time to sell and a lower ratio means it's time to buy, because when the ratio is high it suggests that people are either expecting or protecting more readily against a future decline in the price of the underlying. A Put-Call ratio between 0.5 and 1 is considered a sideways trend in the markets.
Some also view the Put-Call ratio as a contrarian indicator. Traders know that derivatives are used to do more than place bets; they are used as hedges and insurance. If there's a lot of insurance being placed to the sell side, it means traders are worried about prices falling.
Some traders buy when the put-call ratio is above 1, meaning the market is out of balance to the sell side, and sell when the put-call ratio is below 1, meaning the market is out of balance to the buy side. These traders are looking to make money on the correction. The interpretation of the ratio is left to the analyst's or trader's investment philosophy.
Reference : Investopedia (www.investopedia.com)
Let' s start.
In short, calls represent "bulls" and puts represent "bears".
Some analysts do the opposite,for trend reversals the choice is up to you.
I usually look at the opposite comments in commercial positions because I look at this flow angle neutral.
If you want to do the opposite, you must create Put / All Ratio.
So i created this ratio to observe easily movements under or over 0.50 area .
Or you can take the point close to 0.50 as a horizontal trend. Many more comments can be made.I have a few ideas about this, and I'm going to publish them soon . My best suggestion is that it covers a single bar and is very volatile, so you can look for averages and strong accelerations.
This code is open source under the MIT license. If you have any improvements or corrections to suggest, please send me a pull request via the github repository github.com
Stay tuned , best regards.
Signal To Noise Ratio IndicatorThis is a trend indicator at its core so combine with rsi or a moving average of your choice to see which direction the stock is trending in.
Only enter a position (long or short) when signal to noise ratio is above the signal line
This is one of my first indicators posted on here so be sure to leave me feedback

Crypto Break-even FeeWhen I started trading cryptocurrency, I lost money because I didn't take the fees enough into account. Therefore I created my own indicator to quicqly see the break-even selling price of the selling price if I want a predifined profit level.
2 lines are added to the graph. These lines move together with the current price.
- One line indicating the break-even selling price (depending on your maker/taker strategy). For beginners I suggest taking the taker strategy (mostly 0.25%)
- Another line indicating the selling price in order to make a predifined profit %
There are 2 parameters you can set:
- Desired profit (%)
- Maker/Taker Fee (%)
Always happy with a little appreciation ;-) Bitcoin wallet: 18522cAc7YDwwXTvtckXKb1kP33upVDRFR

Modified Signal to Noise Ratio (SNR) - EhlersThis is my "Modified Signal to Noise Ratio" (SNR) indicator using Pine Script version 4.0, freely available to ALL! While creating my "Enhanced Instantaneous Cycle Period" detector, within the same document entitled "SIGNAL ANALYSIS CONCEPTS" written by Dr. John Ehlers, there was code for a signal to noise indicator. So, I adapted it to Pine Script v4.0.
Notice: Consider this to be experimental, but it may come in handy for a few traders who figure out how to use it.
Overviewing it's display on multiple assets with the "Original" formulation, I noticed the "Signal to Noise Ratio" looked commonly hunky-dory all too often except for on a few occasions. You will see that displayed above in the upper indicator and notice how smooth it is. Hmm... The original formulation utilizes three EMAs, and I pondered if that was providing too much smoothing and additional lag. I figured I would try another filter in it's place that may be favorable, and the results seemed more likely as I originally expected, for the most part.
Displayed above, the second indicator from the top, is the "Modified Formulation" that is selectable in the indicator "Settings". You will notice on the left, the highlighting is revealing itself while encountering volatile areas of the assets price. When I encounter this, I switch to a lower time frame to see in more detail what is transpiring. The signal to noise ratio may have a better appearance after doing so. On the 1 second time frame, many assets look like a trading nightmare and that is reflected in the SNR indicator. While on the 30 second time frame, many price fluctuations often look reasonable, but this depends always on the asset too. The point is, if there is an abundance of yellow and/or especially red across the indicator, it may be a good time to consider switching time frames. Some assets are just highly volatile and that's just the way it is. I provided a range smoothing control for ONLY the modified formulation in the indicator "Settings" to attempt to mitigate a choppy SNR signal, but that typically has minimal effect. Setting it too low just makes the SNR worse.
How is the highlighting set up? Yellow is cautionary and red is worst case signal to noise. Keep in mind the scale is ranged in decibels. Anything below 6 decibels in red, below the red dotted line, is an indication of high noise detection. Below the yellow line of 10dB is definitely a cautionary zone down to 6dB. Ideally, above 12dB is ordinarily a signal that may be worth analyzing. The red and yellow dotted lines are adjustable in "Settings" too, and I provided three types of highlighting selectable in the indicator "Settings".
I sourced my "Simple Sine Wave Generator" to the signal to noise indicator, and the signal to noise ratio is upwards towards an astounding 90dB signal to noise on both SNR formulations. 90dB is a SUPERB signal level to pump through a loudspeaker without any audible "noise" to hear, FYI. If only the stock market gave signals like my "Simple Sine Wave Generator"...
I hope that explains how this indicator may be used with the potential to assist you with finding a suitable time frame for trading on certain assets.
Features List Includes:
I.P.O.C.S.(Initial Public Offering Clean Start) Technology
Enable/disable dark background for enhanced visibility
"Source" selection with multiple time frame adjustments
"SNR Formulation" adjustment
"Smooth Range" tweak
Threshold adjustments
"Highlighting Methods" selection
The comments section below is solely just for commenting and other remarks, ideas, compliments, etc... regarding only this indicator, not others. If you do have any general questions or comments regarding this indicator, I will consider your inquiries, thoughts, and ideas presented below in the comments section, when time provides it. As always, "Like" it if you simply just like it with a proper thumbs up, and also return to my scripts list occasionally for additional postings. Have a profitable future everyone!

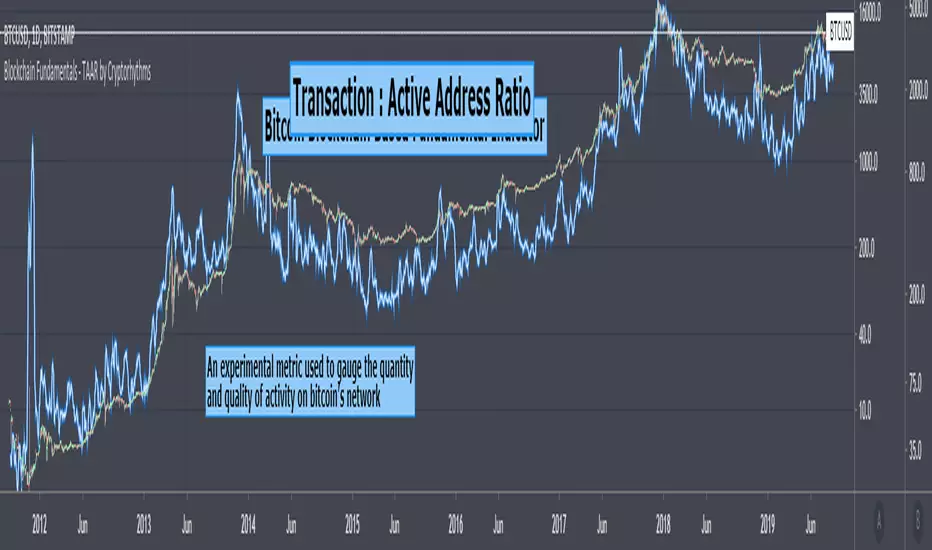
Blockchain Fundamentals - TAAR by CryptorhythmsBlockchain Fundamentals - TAAR (Network Transaction Vol : Active Address Ratio) by Cryptorhythms
Link to Instructions Page / Idea will be linked below.
Q: Why are we separating instructions from the indicator page?
A: Well Tradingview recently instituted a change that only open source script authors can gain rep for their efforts. Any script that is protected or invite only no longer gets points, even if its still free for anyone to use.
We (respectfully) disagree and feel that it is unfair. We ask everyone to like the IDEA (linked below) for this script if you want to support our efforts to keep releasing free (but protected source) indicators.
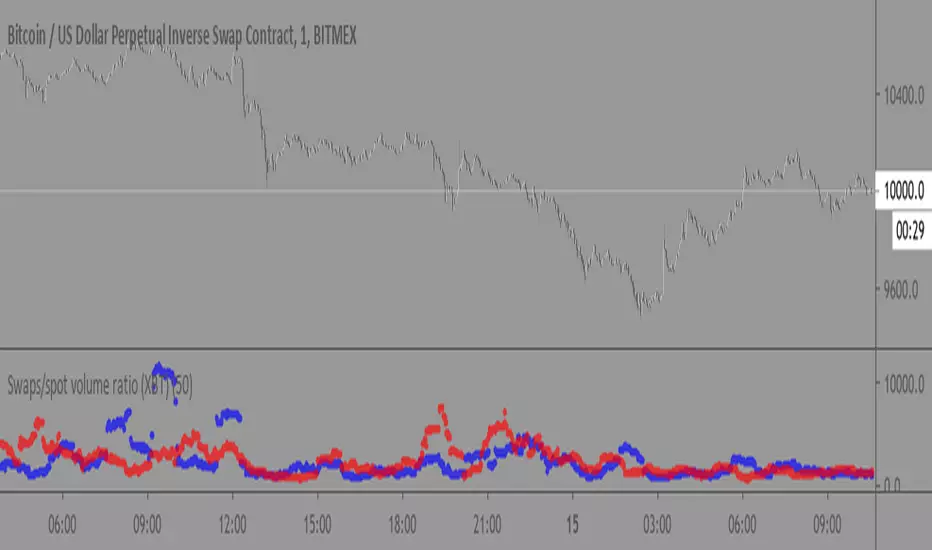
Swaps/spot volume ratio [XBT]Inspired by @SimpeLyfe on both tradingview and twitter
Takes BitMex's XBT volume and divides it by a basket of spot exchanges volume to determine a ratio between both of them.
Has options like: Smoothing or no smoothing, Showing individual data points or data points summed up over a specified period.
Open source so enjoy!
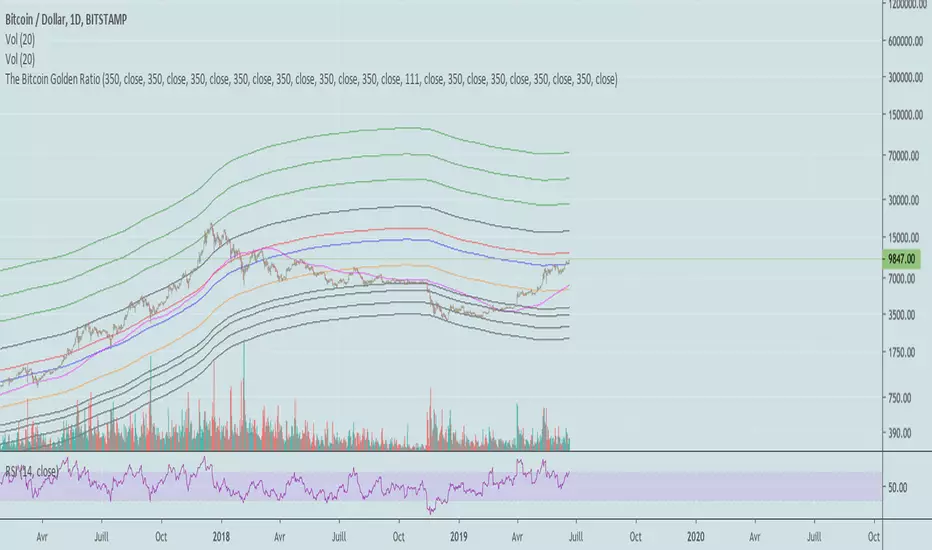
Bitcoin Golden RatioGives the top and bottom of the cryptocurrencies cycles.
When DMA111 crosses DMA350*2, the top is in.
Show accumulation phases and resistances with very precise accuracy.
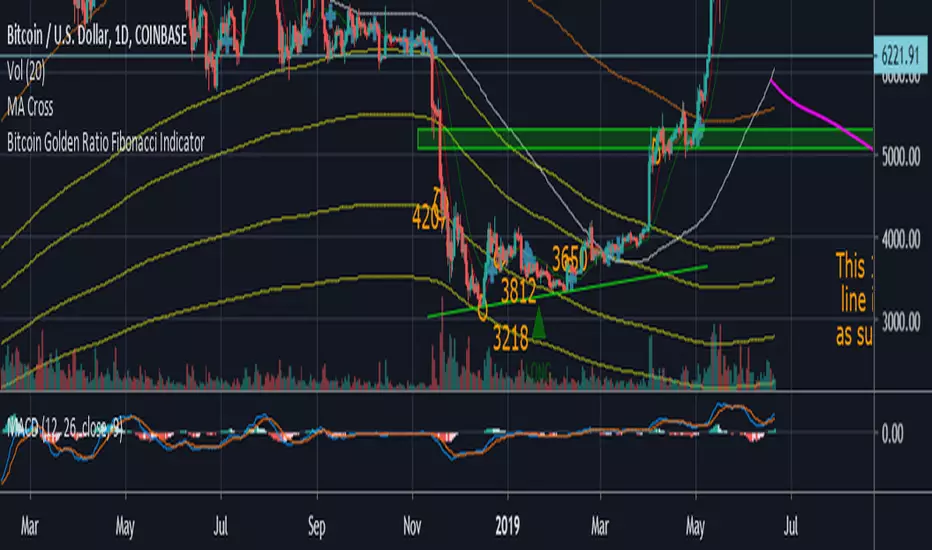
Bitcoin Golden Ratio Fibonacci IndicatorI didn't see this one already it isn't my original idea either. I pulled the formula's from an article on medium, I also added few bear market bottom fib indicators.
Credit to the article I pulled the formula from.
The Golden Ratio Multiplier
Unlocking the mathematically organic nature of Bitcoin adoption
Go to the profile of Philip Swift (@PositiveCrypto)
Philip Swift (@PositiveCrypto)
Jun 17, 2019
By Philip Swift
Release Notes: Fixed spelling error on title, added a couple long and short labels for the top and bottom indicator.
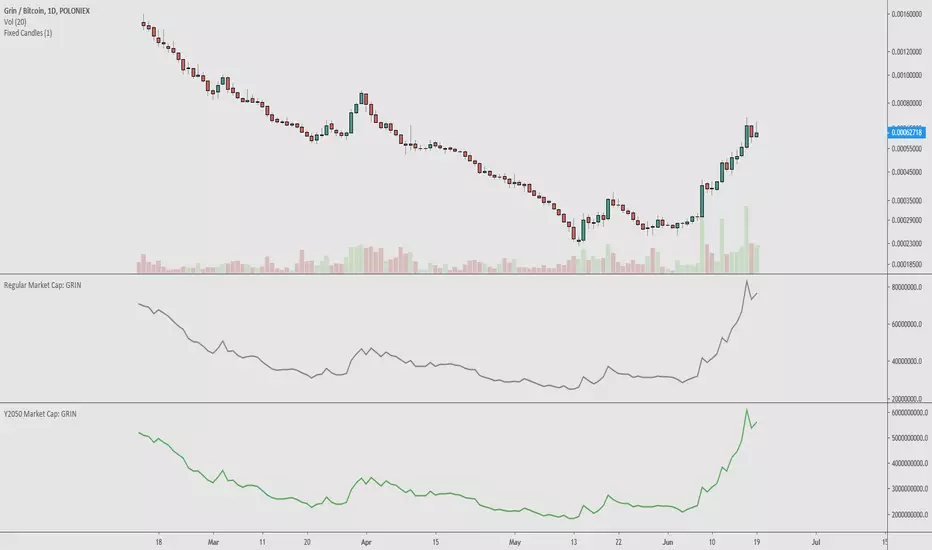
Y2050 Market Cap: GRINMethodology:
Composite of Bittrex and Poloniex to smoothen out the skewed values from lack of liquidity.
To be concise, the main advantage that a Y2050 market cap has over a 'regular' market cap is that it takes into account:
Inflation
What supply should be in the future
What the market cap could be in world of tomorrow
I'm having difficulty publishing the script so bear with me if the professional quality of the description is lacking. As always, I hope you are able to make use of this indicator and find new ways to create a consistent system to test out.
NB