Trend Strength [OmegaTools]Trend Strength is a quantitative regime oscillator designed to measure directional pressure and trend quality by blending price structure, return-dependence, realized intrabar expansion, and volume participation into a single normalized signal. The goal is not to predict, but to classify market state: when price action is in an expansionary/distributionary phase versus when it is in a contractionary/accumulation phase, so you can align execution and risk with the prevailing environment.
Core concept and methodology
The indicator aggregates four components computed on stable rolling windows and mapped into comparable ranges:
1. Price location / structural positioning (100-bar range)
A normalized price-location metric (position of close within the rolling high–low range) is transformed into a non-linear “strength” profile. This emphasizes meaningful departures from the middle of the range and penalizes indecision, producing a structure-aware contribution rather than a raw oscillator.
2. Return-dependence / directional persistence (100 bars)
A correlation term measures the relationship between the current return (close − close ) and the prior price level (close ). This helps detect environments where movement is more persistent or more mean-reverting, providing a statistical component that complements pure price-location signals.
3. Realized expansion / volatility proxy (50-bar accumulation, 300-bar normalization)
Intrabar expansion is approximated via the absolute candle body relative to the full range, aggregated over a short window to represent realized “effort” and then normalized over a longer window. This captures whether price is moving with meaningful body expansion versus compressing and stalling.
4. Volume participation (11-bar accumulation, 300-bar normalization)
A rolling volume sum is normalized over a longer window to quantify participation. This helps separate “thin” moves from moves supported by broader activity, without relying on exchange-specific volume assumptions.
The final oscillator is a weighted blend of these four normalized components, scaled for readability. The output is intentionally centered around two actionable regimes rather than a symmetric overbought/oversold framework.
How to read the oscillator
Trend Strength is designed around two main thresholds:
- Distribution / Expansion regime (oscillator above 0)
When the oscillator is above 0, the market is classified as being in a higher-pressure expansion regime. This often corresponds to directional continuation potential, stronger impulse behavior, and reduced suitability for tight mean-reversion tactics.
- Accumulation / Contraction regime (oscillator below −1.3)
When the oscillator is below −1.3, the market is classified as being in a contraction/accumulation regime. This frequently corresponds to compression, rotation, and lower directional efficiency, where breakouts may be more fragile and mean-reversion tactics may be more appropriate (depending on instrument and session conditions).
Values between 0 and −1.3 are treated as transitional/neutral, where the market is not clearly committing to either regime.
Continuous Mode vs Standard Mode
Trend Strength includes an optional Continuous Mode to improve interpretability during regime transitions:
- Standard Mode colors only when the oscillator is firmly in one of the two regimes (above 0 or below −1.3). Neutral zones remain uncolored, keeping the display conservative.
- Continuous Mode adds persistence logic: once a regime is confirmed, intermediate values are rendered with a lighter shade of the last confirmed regime until the opposite regime is confirmed. This reduces visual noise, helps maintain a consistent directional bias framework, and is particularly useful for intraday execution and session trend management.
Visual design and bar coloring
The oscillator line is color-coded:
- Purple: distribution / expansion regime
- Orange: accumulation / contraction regime
Neutral/transitional values are displayed in grey (or lightly shaded in Continuous Mode based on last confirmed regime).
Optionally, the indicator can color price bars using the same regime logic, allowing rapid at-a-glance regime recognition directly on the chart.
Practical use cases
- Regime filter for strategies: enable trend-following logic only in expansion regimes; enable mean-reversion or range logic in contraction regimes.
- Risk adjustment: increase/decrease position sizing or tighten/widen stops based on regime classification.
- Confirmation layer: combine with structure tools (market structure, VWAP, key levels) to validate whether conditions support continuation or imply compression.
- Session management: identify when a session is behaving as a trend day versus a rotational day, improving trade selection and reducing overtrading.
Notes
Trend Strength is a regime classifier and contextual tool. It does not guarantee future direction and should be integrated into a complete decision process (risk management, market structure, session context, and instrument-specific behavior).
© OmegaTools
Regimedetection

CUSUM Volatility BreakoutCUSUM Volatility Breakout A statistical trend-detection and volatility-breakout indicator that identifies subtle momentum shifts earlier than traditional tools.
OVERVIEW
The CUSUM control chart is a statistical tool designed to detect small, gradual shifts from a target value. In trading, it helps identify the early stages of a trend, giving traders a heads-up before momentum becomes obvious on standard price charts. By spotting these subtle movements, the CUSUM Volatility Breakout indicator (CUSUM VB) can highlight potential breakout opportunities earlier than traditional indicators. In other words, a statistical trend detection & breakout indicator.
Copyright © 2025 CoinOperator
HOW IT WORKS
CUSUM VB uses a combination of differenced price series, volume normalization, and dynamic control limits:
CUSUM Principle: Tracks cumulative deviations of price from a zero reference. Signals occur when cumulative deviations exceed a control limit shown on the chart and clears any enabled filters.
Adaptive Volatility: H adjusts automatically based on short- vs long-term ATR ratios, allowing faster detection during volatile periods and reduced false signals in calm markets.
Volume Weighting (optional): Amplifies price CUSUM values during high-volume bars to prioritize market participation strength.
ATR Confirmation (optional): Ensures breakouts are accompanied by expanded volatility.
Bollinger Band Squeeze Integration (optional): Confirms trend breakouts by detecting volatility contraction and release shown on the chart as triangles.
Signals:
Arrows on the price chart mark the bars where trades are actually filled, based on conditions detected on the prior signal bar.
Long Entry: Confirmed positive CUSUM breach (price & volume) with BB breakout (signal bar).
Short Entry: Confirmed negative CUSUM breach (price & volume) with BB breakout (signal bar).
Exit Signals: Triggered automatically by opposite-side signals.
Alerts, when created, fire on the bars where fills occur.
CHART COMPONENTS
CUSUM Upper Price (CU Price) and CUSUM Lower Price (CL Price) are green/red circles for confirmed signals.
● Rapid upward accumulation of CU Price indicates a developing bullish trend.
● Rapid downward accumulation of CL Price indicates a developing bearish trend.
Decision/Control limits (UCL/LCL, red)
Zero line (reference for the differenced price series baseline)
Optional BB triangles and volume CUSUM
SETUP AND CONFIGURATION
Differenced Price Series
Differenced Price Length and Lag
Increase differencing lag or window length → Increases variance of residuals → Wider control limits (UCL/LCL) → Slower to trigger.
Decrease lag or window → Tighter limits, more responsive to short-term regime shifts.
CUSUM Parameters
Volume-Weighted CUSUM
NOTE : Uses price length if 'Confirm Price with Volume' is disabled, otherwise will use volume length.
Amplifies CUSUM price responses during high-volume bars and reduces them during low-volume bars. This links trend detection to market participation strength.
Volume-Weighted CUSUM doesn’t replace price confirmation with volume; it modulates it by volume intensity, amplifying price signals when participation is strong and suppressing them when weak.
Recommended when analyzing assets with consistent volume patterns (e.g., stocks, major futures).
Disable for low-liquidity or irregular-volume instruments (e.g., crypto pairs, small-cap stocks).
ATR Confirmation
Enable this feature to confirm CUSUM signals only when price deviations are accompanied by higher-than-normal volatility. The indicator compares current ATR to a smoothed ATR to detect volatility expansion. This helps distinguish true breakouts from low-volatility noise and reduces false signals during quiet periods.
Adjust the ATR lookback length, smoothing length, and expansion factor to control sensitivity. Rule of thumb:
ATR Length ≈ 0.5 × differenced price length to 1.5 × differenced price length gives balanced sensitivity.
ATR Smoothing 5–10 bars.
ATR Expansion 5% to 50%.
CUSUM Input Mode
Select how CUSUM processes differenced price and log-normalized volume — either directly (Txfrm Data) or as deviations from a short-term EMA baseline (Residuals):
Txfrm Data = transformed input: differenced price & log-normalized volume as input for CUSUM (larger swings, more frequent control limit breaches)
Residuals = deviation from short-term EMA baseline (smaller swings, fewer control limit breaches, but higher signal quality).
Residual EMA Length: Defines how quickly the residual baseline adapts to recent differenced price moves. Shorter = more reactive; longer = smoother baseline. Keep EMA length moderate; over-smoothing can distort timing.
Control Sensitivity (K)
Increase K → Less sensitive → CUSUM accumulates slower → Fewer signals, captures only major trends.
Decrease K → More sensitive → CUSUM accumulates faster → More signals, captures minor swings too.
Reset Mode : Method of resetting CUSUM values.
Immediate Reset: Reset both immediately after any signal breach. Traditional SPC.
Opposite-Side Reset: Reset only the opposite side when a valid signal fires. Best for ongoing trend tracking.
Decay Reset: Gradually reduce CUSUM values toward zero with a decay factor each bar. Maintains trend memory but allows slow “forgetting.”
Threshold Reset: Reset only if CUSUM returns below a small threshold (10 % of H). Filters noise without full wipe.
No Reset / Continuous: Never reset; instead track running totals. Long-term cumulative bias measurement.
Conflict Handling : Method of handling conflicting signals.
Ignore Both: Discards both when overlap occurs.
Prioritize Latest: Chooses the direction implied by the most recent close.
Prioritize Stronger: Compares absolute magnitudes of CU Price vs CL Price.
Average Resolve: Looks at the difference; small overlap → ignore, otherwise pick direction by sign.
Sequential Confirm: Requires N consecutive same-direction signals before confirmation.
Volume Parameters (Optional)
Amplification Factor
Adjusts volume sensitivity and effectively rescales the log series of volume to a comparable magnitude with price changes.
Since price and volume are normalized in a compatible way, the amplification factor is used instead of independent K and H values for volume.
Bollinger Bands (Optional)
Lookback Synchronization
BB Lookback (for CUSUM): Number of bars that define a window for the BB signal to look back for the CUSUM signal.
CUSUM Lookback (for BB): Number of bars that define a window for the CUSUM signal to look back for the BB signal.
Both can be enabled for stricter alignment.
Relationship Between K, H, ARL₀ and ARL₁
H (max) is usually the only H you need to adjust. With everything else being constant, increasing either K or H (max) generally increases both ARL₀ and ARL₁ : higher thresholds reduce false alarms but slow detection, and lower thresholds do the opposite.
Increase Min Target ARL ratio →
ARL₀ increases (safer, fewer false alarms)
ARL₁ decreases or stays small (faster detection)
Control limits slightly expand to achieve separation
Strategy becomes more selective and stable
Decrease Min Target ARL ratio →
ARL₀ decreases (more false alarms tolerated)
ARL₁ increases (slower detection tolerated)
Control limits tighten
Strategy becomes more sensitive but lower quality
The ARL Ratio of ARL₀ / ARL₁ is typically between 3 and 8. This implies you want your ARL₀ (false-alarm interval) ≈ 'Min Target ARL ratio' × differenced price length window.
Example:
"Min Target ARL ratio = 4.0"
⇒ implies you want your ARL₀ (false-alarm interval) ≈ 4 × differenced price length.
Assume price length = 50 (typical differencing window).
ARL ratio = 4.0 → target ARL = 4 × 50 = 200 bars.
● On a 6-hour chart (≈4 bars/day) → ~50 days between expected false alarms (on average).
● On a daily chart → ~200 trading days between false alarms (very conservative).
ARL ratio = 8.0 → target ARL = 400 bars → twice as infrequent signals vs ratio=4.
ARL ratio = 2.0 → target ARL = 100 bars → about half the inter-signal interval.
Another way to think about it: probability of a false alarm on any bar ≈ 1 / target ARL. If you want ~1% of bars producing alarms, target ARL ≈ 100.
QUICK START
Start with the defaults.
Set price series → length/order/lag
Configure CUSUM thresholds → K, H min/max
1. Adjust the price differencing lag/window.
2. Verify that it captures real price inflection points without overreacting to bar noise.
Enable optional filters → Volume, ATR, BB
The optional Bollinger Bands squeeze usually works best if used with CUSUM Input Mode = Txfrm Data.
Monitor CUSUM chart → CU Price, CL Price, thresholds, zero line
Act on signals → data window / chart triangles
Adjust sensitivity → H (max), K, lengths
Monitor ARL ratio and CUSUM behavior for fine-tuning
Note : When you’ve finalized the length, lag, and order of the Price Difference, as well as the Ln(Vol) Series of “Confirm Price with Volume” if enabled, then pass both through the Augmented Dickey–Fuller (ADF) mean reversion test to ensure they are stationary, i.e., mean reverting. You can find a ready-made indicator for such use at . Many thanks to tbtkg for this indicator.
SUMMARY
CUSUM VB combines CUSUM statistical control, volatility-adaptive thresholds, volume weighting, and optional BB breakout confirmation to provide robust, actionable signals across a wide variety of trading instruments.
Why traders use it : Fast detection of shifts, reduced false alarms, versatile across markets.
Ideal for : Futures (continuous contracts), forex, crypto, stocks, ETFs, and commodity/index CFDs, especially where:
● Price and volume data exist
● Breakouts and volatility shifts are tradable
● There’s enough liquidity for meaningful signals
Visualization : Upper/lower CUSUM circles, UCL/LCL thresholds, optional highlight traded background, optional volume and BB overlays on the chart, optional entry/exit labels on the price chart, as well as entry/exit signals in the data window.
Alerts : For entry/exit labels when trades are actually filled.
CUSUM VB is designed for traders who want statistically grounded trend detection with configurable sensitivity, visual clarity, and multi-market versatility.
DISCLAIMER
This software and documentation are provided “as is” without any warranties of any kind, express or implied. CoinOperator assumes no responsibility or liability for any errors, omissions, or losses arising from the use or interpretation of this software or its outputs. Trading and investing carry inherent risks, and users are solely responsible for their own decisions and results.

Market State Intelligence [Interakktive]Market State Intelligence (MSI) is a diagnostic market-context indicator that reveals how the market is behaving — not where price "should" go.
MSI does not generate buy/sell signals. Instead, it classifies market conditions into clear behavioural regimes by continuously measuring:
- DRIVE (directional effort)
- OPPOSITION (absorption / resistance)
- STABILITY (structural persistence)
MSI is designed to answer three practical questions:
- What state is the market in right now?
- Is energy building, releasing, or decaying?
- Is participation aligned with price, or opposing it?
█ WHAT MSI DOES
MSI operates as a real-time regime classification engine that processes each closed bar through three independent measurement systems:
DRIVE — Directional Effort (0–100)
- Displacement efficiency (net progress vs total path)
- Range expansion quality (actual range vs expected ATR range)
- Body dominance (body vs candle range)
OPPOSITION — Absorption / Resistance (0–100)
- Wick pressure (rejection relative to attempt)
- Effort–result gap (high effort, low progress)
- Reversal density (counter-moves frequency)
STABILITY — Persistence (0–100)
- Condition persistence (how long conditions hold)
- Variance score (flip frequency)
- Follow-through consistency (reaction continuity)
These three forces feed a deterministic classifier with hysteresis (anti-flicker) to identify five regimes:
COMPRESSION — low drive, low opposition, higher stability (pressure building, direction unclear)
EXPANSION — high drive, low opposition (directional energy release)
TREND — medium-high drive, higher stability, low-medium opposition (healthy continuation)
DISTRIBUTION — medium drive, high opposition (effort absorbed; progress blocked)
TRANSITION — rapidly rising opposition, low stability (regime breakdown / uncertainty)
█ WHAT MSI DOES NOT DO
- No buy/sell signals, entries/exits, or performance claims
- No prediction of future direction
- No repainting: calculations use closed-bar data only
MSI is a market state layer intended to support your execution framework.
█ VISUAL SYSTEM
MSI uses a layered visual grammar designed to remain readable on live charts:
Regime Ribbon
A thin horizontal band showing the current regime via colour. Ribbon opacity reflects regime confidence (stronger confidence = more visible).
Pressure Envelope (core visual)
A soft corridor around price that expands with Drive and becomes more visible as Opposition increases. This visualises "pressure thickness" around current action (not a volatility band for entries).
Structural Memory
Faint background stains appear where regimes previously failed (e.g., expansion collapsing into absorption). These are behavioural context zones showing where market intention was rejected — not support/resistance.
Regime Change Markers (optional)
Subtle labels appear when regimes transition after confirmation. Useful for replay and education.
Effort Halo (optional)
Candle highlighting when Opposition materially exceeds Drive, indicating absorption/inefficiency.
█ HUD PANEL
The HUD displays:
- Current regime name + colour indicator
- A context gate showing whether conditions are aligned with long-bias or short-bias context (not an entry/exit system)
█ REGIME LEGEND
When enabled, displays:
- A one-line definition of the current regime
- Live Drive / Opposition / Stability values for interpretation
█ TIME-TO-DECISION METER
A visual pressure gauge that tends to fill during Compression (energy building) and drain during Expansion (energy releasing). It is a state-tracking meter, not a timing tool.
█ SETTINGS
MSI — Settings
- Preset Mode: Scalper / Swing / Position
- Analysis Mode (Minimal): ON = subtle visuals, OFF = full intensity
- Regime Ribbon, Structural Memory, HUD Panel, Time-to-Decision Meter, Effort Halo
MSI — Visual Options
- Show Regime Changes: Labels when regime transitions occur
- Show Regime Legend: Definition and live values display
- Panel Position: Move the entire panel anywhere on chart
MSI — Advanced (Tuning)
- Sensitivity (0.5–2.0)
- Smoothing (0.5–2.0)
- Memory Decay (0.5–2.0)
- Visual Intensity (Low / Medium / High)
█ PRESETS EXPLAINED
Scalper
Higher sensitivity + lower smoothing + faster memory decay. Best for 1m–15m monitoring.
Swing (default)
Balanced behaviour. Best for 15m–4H analysis.
Position
Lower sensitivity + higher smoothing + slower memory decay. Best for 4H–1D macro context.
█ STRUCTURAL MEMORY
When a regime fails (example: Expansion → Distribution), MSI creates a memory imprint:
- Fixed stain window (preset dependent)
- Strength decays over time
- Limited to a maximum number of imprints to reduce chart clutter
These zones represent behavioural rejection, not levels.
█ SUITABLE MARKETS
MSI is designed for Forex, Crypto, Indices, Stocks, and Commodities.
Works from intraday to Daily, with particularly strong readability on 15m–4H.
█ DISCLAIMER
This indicator is for educational and informational purposes only. It does not constitute financial advice, trading recommendations, or solicitation. Trading involves substantial risk. Always use proper risk management and make independent decisions.

Z-Score Regime DetectorThe Z-Score Regime Detector is a statistical market regime indicator that helps identify bullish and bearish market conditions based on normalized momentum of three core metrics:
- Price (Close)
- Volume
- Market Capitalization (via CRYPTOCAP:TOTAL)
Each metric is standardized using the Z-score over a user-defined period, allowing comparison of relative extremes across time. This removes raw value biases and reveals underlying momentum structure.
📊 How it Works
- Z-Score: Measures how far a current value deviates from its average in terms of standard deviations.
- A Bullish Regime is identified when both price and market cap Z-scores are above the volume Z-score.
- A Bearish Regime occurs when price and market cap Z-scores fall below volume Z-score.
Bias Signal:
- Bullish Bias = Price Z-score > Market Cap Z-score
- Bearish Bias = Market Cap Z-score > Price Z-score
This provides a statistically consistent framework to assess whether the market is flowing with strength or stress.
✅ Why This Might Be Effective
- Normalizing the data via Z-scores allows comparison of diverse metrics on a common scale.
- Using market cap offers broader insight than price alone, especially for crypto.
- Volume as a reference threshold helps identify accumulation/distribution regimes.
- Simple regime logic makes it suitable for trend confirmation, filtering, or position biasing in systems.
⚠️ Disclaimer
This script is for educational purposes only and should not be considered financial advice. Always perform your own research and risk management. Past performance is not indicative of future results. Use at your own discretion.

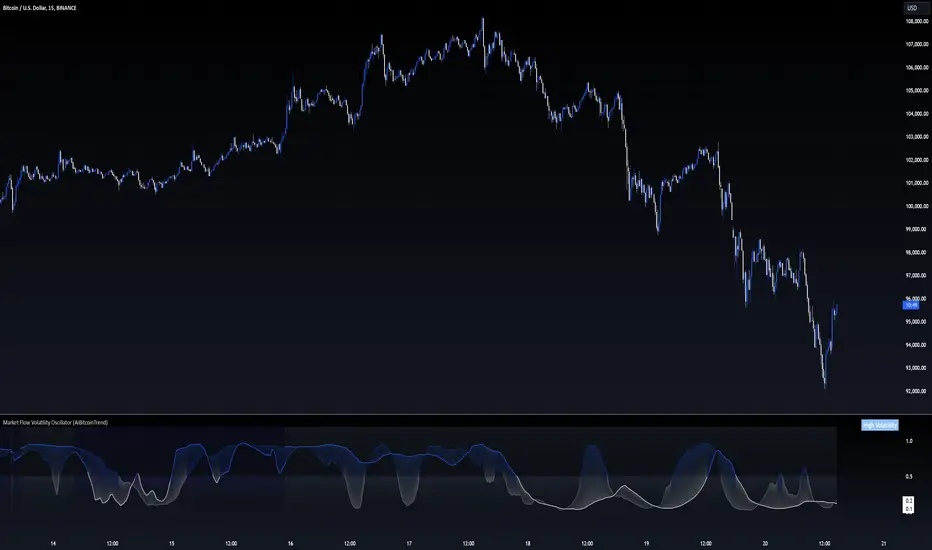
Market Flow Volatility Oscillator (AiBitcoinTrend)The Market Flow Volatility Oscillator (AiBitcoinTrend) is a cutting-edge technical analysis tool designed to evaluate and classify market volatility regimes. By leveraging Gaussian filtering and clustering techniques, this indicator provides traders with clear insights into periods of high and low volatility, helping them adapt their strategies to evolving market conditions. Built for precision and clarity, it combines advanced mathematical models with intuitive visual feedback to identify trends and volatility shifts effectively.
👽 How the Indicator Works
👾 Volatility Classification with Gaussian Filtering
The indicator detects volatility levels by applying Gaussian filters to the price series. Gaussian filters smooth out noise while preserving significant price movements. Traders can adjust the smoothing levels using sigma parameters, enabling greater flexibility:
Low Sigma: Emphasizes short-term volatility.
High Sigma: Captures broader trends with reduced sensitivity to small fluctuations.
👾 Clustering Algorithm for Regime Detection
The core of this indicator is its clustering model, which classifies market conditions into two distinct regimes:
Low Volatility Regime: Calm periods with reduced market activity.
High Volatility Regime: Intense periods with heightened price movements.
The clustering process works as follows:
A rolling window of data is analyzed to calculate the standard deviation of price returns.
Two cluster centers are initialized using the 25th and 75th percentiles of the data distribution.
Each price volatility value is assigned to the nearest cluster based on its distance to the centers.
The cluster centers are refined iteratively, providing an accurate and adaptive classification.
👾 Oscillator Generation with Slope R-Values
The indicator computes Gaussian filter slopes to generate oscillators that visualize trends:
Oscillator Low: Captures low-frequency market behavior.
Oscillator High: Tracks high-frequency, faster-changing trends.
The slope is measured using the R-value of the linear regression fit, scaled and adjusted for easier interpretation.
👽 Applications
👾 Trend Trading
When the oscillator rises above 0.5, it signals potential bullish momentum, while dips below 0.5 suggest bearish sentiment.
👾 Pullback Detection
When the oscillator peaks, especially in overbought or oversold zones, provide early warnings of potential reversals.
👽 Indicator Settings
👾 Oscillator Settings
Sigma Low/High: Controls the smoothness of the oscillators.
Smaller Values: React faster to price changes but introduce more noise.
Larger Values: Provide smoother signals with longer-term insights.
👾 Window Size and Refit Interval
Window Size: Defines the rolling period for cluster and volatility calculations.
Shorter windows: adapt faster to market changes.
Longer windows: produce stable, reliable classifications.
Disclaimer: This information is for entertainment purposes only and does not constitute financial advice. Please consult with a qualified financial advisor before making any investment decisions.