Operietur ⸗ Time Range BreakoutOur T.R.B ( Time Range Breakout ) indicator is very similar to the O.R.B ( Open Range Breakout ) indicator. This script plots the high/Low within a custom time-range which then extends that plot to end-of-day. A Fibonacci extension is then drawn from that range. The default settings of this indicator set the similarities to the ORB. This script only displays the last trading day.
Due to Tradingview's singular refresh rate for the larger timeframes("resolutions"); this indicator works on timeframes LESS than 60min. Additionally, the smaller the timeframe the more accurate the price range will be.
The movements within the specified period of time define the projected Fibonacci prices associated with the allotted time's price range.
• Custom Time Range
• Fibonacci Extensions
• Up to 5 PTs
• Customizable Multiplier
Additional script features allow for fully adjustable settings and configurations:
• Adjustable; PT Colors
• Adjustable; Range Color
• Adjustable; Toggles
Regressions

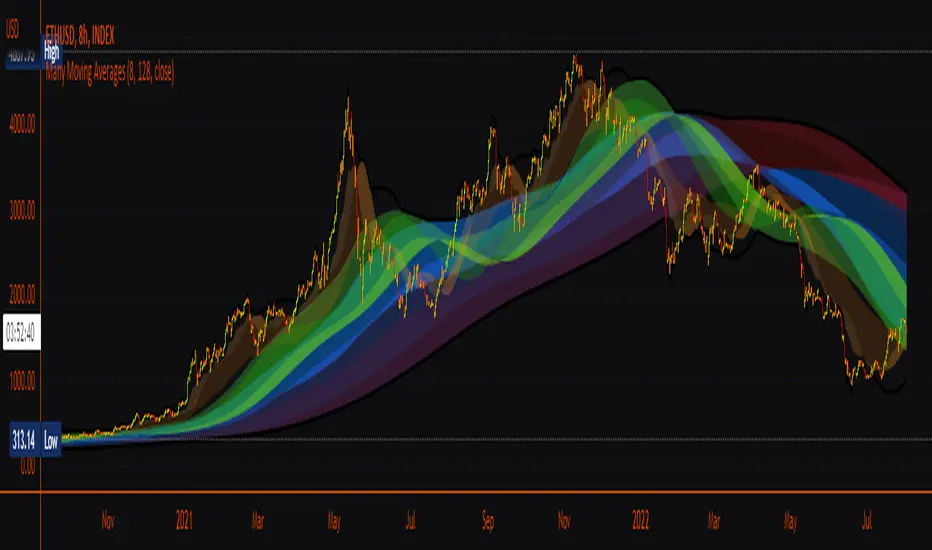
Many Moving AveragesA smooth looking indicator created from a mix of ALMA and LRC curves. Includes alternative calculation for both which I came up with through trial and error so a variety of combinations work to varying degrees. Just something I was playing around with that looked pretty nice in the end.
Regression Channel Alternative MTF█ OVERVIEW
This indicator displays 3 timeframes of parallel channel using linear regression calculation to assist manual drawing of chart patterns.
This indicator is not true Multi Timeframe (MTF) but considered as Alternative MTF which calculate 100 bars for Primary MTF, can be refer from provided line helper.
The timeframe scenarios are defined based on Position, Swing and Intraday Trader.
█ INSPIRATIONS
These timeframe scenarios are defined based on Harmonic Trading : Volume Three written by Scott M Carney.
By applying channel on each timeframe, MW or ABCD patterns can be easily identified manually.
This can also be applied on other chart patterns.
█ CREDITS
Scott M Carney, Harmonic Trading : Volume Three (Reaction vs. Reversal)
█ TIMEFRAME EXPLAINED
Higher / Distal : The (next) longer or larger comparative timeframe after primary pattern has been identified.
Primary / Clear : Timeframe that possess the clearest pattern structure.
Lower / Proximate : The (next) shorter timeframe after primary pattern has been identified.
Lowest : Check primary timeframe as main reference.
█ EXAMPLE OF USAGE / EXPLAINATION

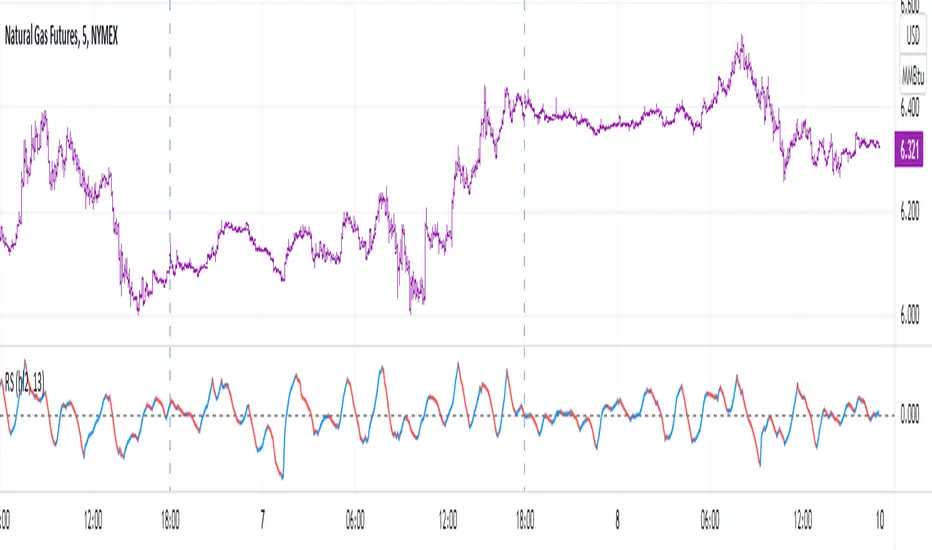
Mean Distance IndicatorThe Mean Distance Indicator
The distance indicator is a market regime technique that measures the relative distance between the market price and the moving average. To calculate the indicator we can follow these steps:
Calculate the difference between the market price and the current moving average value.
Calculate the RSI on the differenced values.

BTC - Novel RPPI IndicatorHey Everyone,
This is a collab effort between me (a statistician) and @Stein3d (A coder). So if you like this indicator, be sure to also give him the credit!
This a novel indicator theorized by me and applied by Stein3d. We are calling it the RPPI indicator, standing for Regression based Price Prediction Indicator.
This is specifically coded for BTC and cannot be used for alt coins or ETH.
This is pretty beta so your feedback and comments are encouraged!
I will keep it brief, but here is the run down:
What does it do:
The indicator does 3 main things:
1. Predicts bullish targets;
2. Predicts bearish targets;
3. Predicts close price
Who is it applicable for:
This is generally targeted to day trades, but it can have swing trade applications as well. Feel free to get creative with combining it with other indicators that you feel complement it well.
How does it work:
It uses statistical based regressive analysis of BTC to compare current price action to previous price action and determine where the natural high and lows will fall intra-day based on the current price action of the day.
How to use it:
This does not omit the need for technical analysis and chart interpretation; however, it sets realistic expectations of intra-day bullish and bearish price targets as well as its best guess of where the current day close is most likely to fall. Take a look at some of the images below:
The image is pretty self explanatory but you see that there are 2 bull and bear targets. The bull targets, of course, are listed in Green and the bear targets are listed in Red.
There is a dummy neutral support and resistance target which is listed in yellow and the close price is in the purple dotted line.
Of course these are all customizable.
I think that pretty much covers it in a nut shell but let us know if you have any other questions and also please provide feedback!
Thanks for checking it out!

[BUBBLENUKE] BOB The Reversal Trader Indicator=============================================================: BOB The Reversal Trader :=============================================================
COMPONENTS:
- VWAP Anchored at Friday CME close
- Bitcoin CME close
- Volume bars
DESCRIPTION:
BOB is a mean-reversion trading system focused in BTCUSDT asset in the 30M time frame. The system is divided into 2 types of entries:
WEEKENDS:
BOB will trigger his entry when the price of Bitcoin is at one of the two deviations from the VWAP anchored at Friday CME close
INTRA-WEEK:
BOB will trigger its entry when the price of Bitcoin is at one of the two deviations from the VWAP anchored at the Friday CME close or when a volume candle indicates a reversal

RAS.V2 Strength Index OscillatorHeavily modified version of my previous "Relative Aggregate Strength Oscillator" -Added high/low lines, alma curves,, lrc bands, changed candle calculations + other small things. Replaces the standard RSI indicator with something a bit more insightful.
Credits to @wolneyyy - 'Mean Deviation Detector - Throw Out All Other Indicators ' And @algomojo - 'Responsive Coppock Curve'
And the default Relative Strength Index
The candles are the average of the MFI ,CCI ,MOM and RSI candles, they seemed similar enough in style to me so I created candles out of each and the took the sum of all the candle's OHLC values and divided by 4 to get an average, same as v1 but with some tweaks. Previous Peaks and Potholes visible with the blue horizontal lines which adjust when a new boundary is established. Toggle alma waves or smalrc curves or both to your liking. This indicator is great for calling out peaks and troughs in realtime, although is best when combined with other trusted indicators to get a consensus.

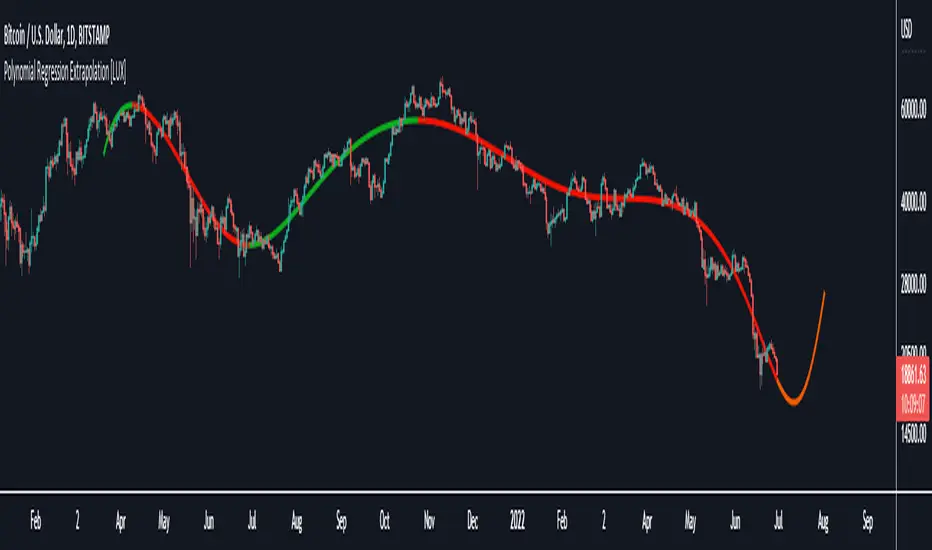
Polynomial Regression Extrapolation [LuxAlgo]This indicator fits a polynomial with a user set degree to the price using least squares and then extrapolates the result.
Settings
Length: Number of most recent price observations used to fit the model.
Extrapolate: Extrapolation horizon
Degree: Degree of the fitted polynomial
Src: Input source
Lock Fit: By default the fit and extrapolated result will readjust to any new price observation, enabling this setting allow the model to ignore new price observations, and extend the extrapolation to the most recent bar.
Usage
Polynomial regression is commonly used when a relationship between two variables can be described by a polynomial.
In technical analysis polynomial regression is commonly used to estimate underlying trends in the price as well as obtaining support/resistances. One common example being the linear regression which can be described as polynomial regression of degree 1.
Using polynomial regression for extrapolation can be considered when we assume that the underlying trend of a certain asset follows polynomial of a certain degree and that this assumption hold true for time t+1...,t+n . This is rarely the case but it can be of interest to certain users performing longer term analysis of assets such as Bitcoin.
The selection of the polynomial degree can be done considering the underlying trend of the observations we are trying to fit. In practice, it is rare to go over a degree of 3, as higher degree would tend to highlight more noisy variations.
Using a polynomial of degree 1 will return a line, and as such can be considered when the underlying trend is linear, but one could improve the fit by using an higher degree.
The chart above fits a polynomial of degree 2, this can be used to model more parabolic observations. We can see in the chart above that this improves the fit.
In the chart above a polynomial of degree 6 is used, we can see how more variations are highlighted. The extrapolation of higher degree polynomials can eventually highlight future turning points due to the nature of the polynomial, however there are no guarantee that these will reflect exact future reversals.
Details
A polynomial regression model y(t) of degree p is described by:
y(t) = β(0) + β(1)x(t) + β(2)x(t)^2 + ... + β(p)x(t)^p
The vector coefficients β are obtained such that the sum of squared error between the observations and y(t) is minimized. This can be achieved through specific iterative algorithms or directly by solving the system of equations:
β(0) + β(1)x(0) + β(2)x(0)^2 + ... + β(p)x(0)^p = y(0)
β(0) + β(1)x(1) + β(2)x(1)^2 + ... + β(p)x(1)^p = y(1)
...
β(0) + β(1)x(t-1) + β(2)x(t-1)^2 + ... + β(p)x(t-1)^p = y(t-1)
Note that solving this system of equations for higher degrees p with high x values can drastically affect the accuracy of the results. One method to circumvent this can be to subtract x by its mean.
ATR ChartATR Levels
Calculated by adding ATR to daily low and subtracting ATR from daily high.
Inputs can change ATR timeframe and range, defaults to 6 hr and daily.
Colorful RegressionColorful Regression is a trend indicator. The most important difference of it from other moving averages and regressions is that it can change color according to the momentum it has. so that users can have an idea about the direction, orientation and speed of the graph at the same time. This indicator contains 5 different colors. Black means extreme downtrend, red means downtrend, yellow means sideways trend, green means uptrend, and white means extremely uptrend. I recommend using it on the one hour chart. You can also use it in different time periods by changing the sensitivity settings.

Easy TrendCurrent script displays trend channel, which makes it easy to see reversal signals
Note:
- If price goes above the channel it might be an early sell signal
- If price falls from channel it might be a sell signal, better to enter position on retest
Plan for future development:
- Alerts
- Trend angle

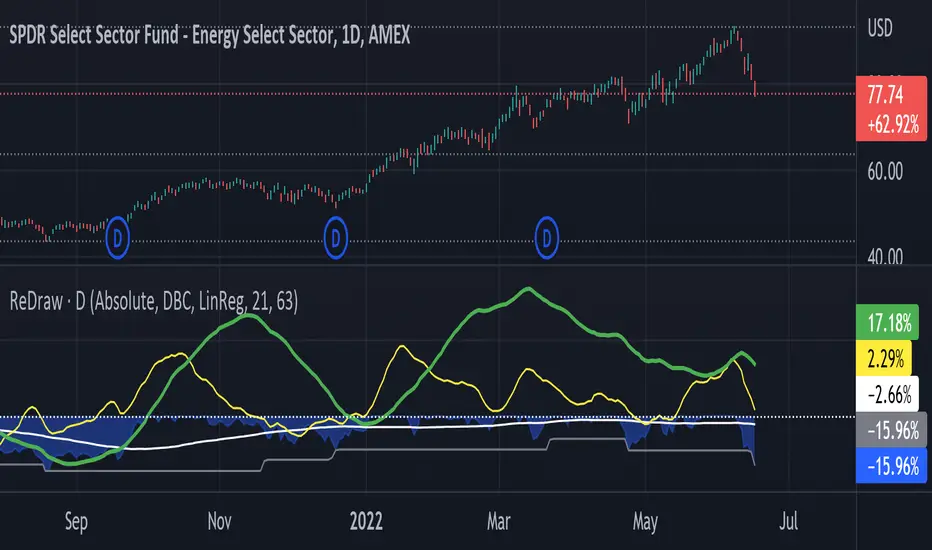
Return & Drawdown
ReDraw script calculates the historical returns and drawdown for the given periods.
By default, the return of the linear regression trends is displayed (can be turned off in settings). In this mode, two linear regression trends are being computed for both long and short periods, and the percent value indicates the "return of the trend" for the corresponding period. Observing the dynamic of the linear regression trends can give a great hint if the trend is slowing down.
When the smoothing method is set to "none" or WMA3/5, the real asset return is shown for both periods, using the formula (LastPrice-FirstPrice)/FirstPrice
The script calculates the maximum drawdown for the long period using the formula (max(Price) - LastPrice) / max(Price).
The white line under the zero is the average maximum drawdown over the long period.
When the mode is set to Compare, ReDraw will display the difference in metrics between the current and selected symbol (SPY by default).
Super trend BThis indicator is a mix of 3 well known indicators
the buy point is based on linear regression
the sell points are based on mix of super trend and Bollinger
it try to find best point to sell and buy which are independent from each other
for each time frame you need to try to search for best setting
alerts included

Enio_LR_SlopeEnio_LR_Slope is the slope curve of a Linear Regression Line. As such, it describes whether the LRL is decreasing or vice versa.
Its crossing above the Zero line is considered a Buy signal, and vice versa. This signal can also be used to confirm signals from other indicators.
The default setting is:
Slope curve, 30 periods
Cut-Off signal, 7-periods (This is a simple moving average of the Slope curve).
Cut-Off signals can be used for early buy/sell positioning.

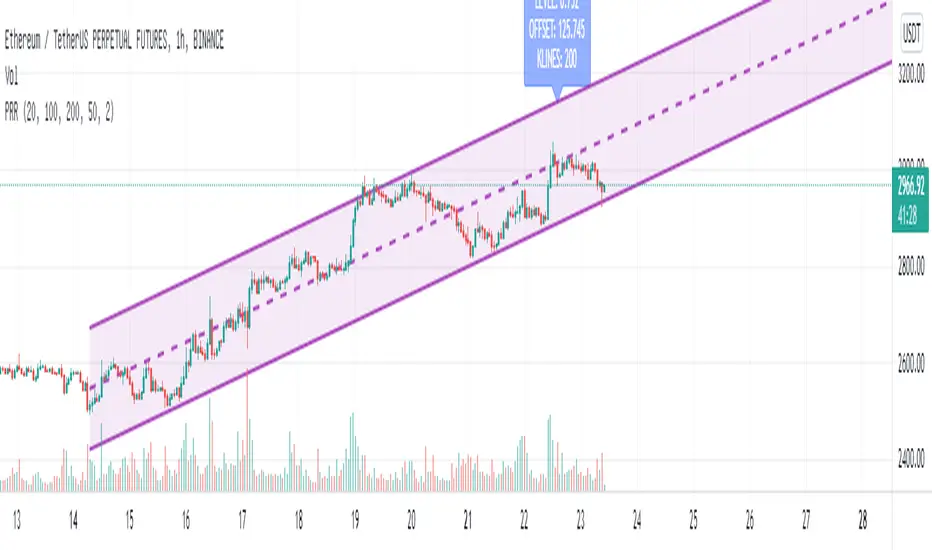
Regression Channel with projectionEXPERIMENTAL:
Auto adjusting regressive channel with projection.
Linear regression is a linear approach to modeling the relationship between a dependent variable and one or more independent variables.
In linear regression , the relationships are modeled using linear predictor functions whose unknown model parameters are estimated from the data.
Disclaimer :
Success in trading is all about following your trading strategy and indicators should fit into your own strategy, and not be traded purely on.
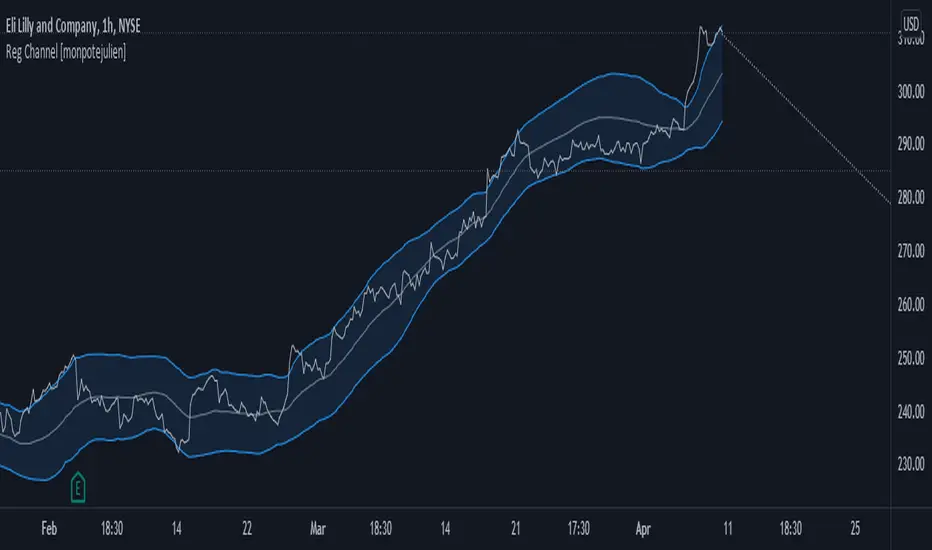
This script is for informational and educational purposes only. Use of the script does not constitute professional and / or financial advice. You are solely responsible for evaluating the outcome of the script and the risks associated with using the script. In exchange for the use of the script, you agree not to hold monpotejulien TradingView user responsible for any possible claims for damages arising out of any decisions you make based on the use of the script.
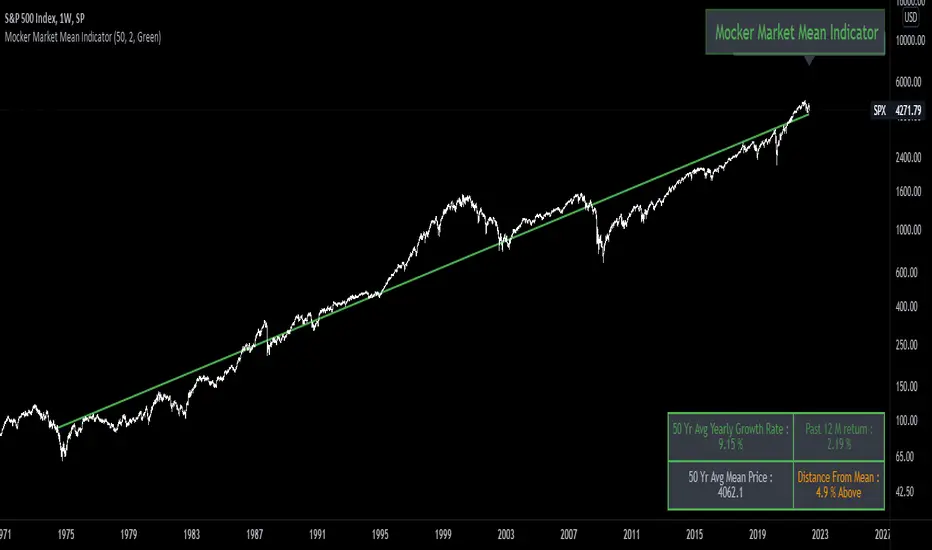
Mocker Market Mean IndicatorThe objective of this indicator is to find the historical mean price of a market ( Intended for Indexes or ETF's). Based off of the concept that Benjamin Graham taught, that Mr. Market is a manic depressive forever oscillating between unjustified pessimism to extreme optimism. The intent of this indicator is to supplement a regular allocation strategy to an index or ETF , to increase that allocation when it's trading below its historical mean and decrease when trading above. It does this by using an exponential regression model to find the closest approximation of the current mean price based on past growth rate, and user defined lookback period.
Relative slopeRelative slope metric
Description:
I was in need to create a simple, naive and elegant metric that was able to tell how strong is the trend in a given rolling window. While abstaining from using more complicated and arguably more precise approaches, I’ve decided to use Linearly Weighted Linear Regression slope for this goal. Outright values are useful, but the problem was that I wasn’t able to use it in comparative analysis, i.e between different assets & different resolutions & different window sizes, because obviously the outputs are scale-variant.
Here is the asset-agnostic, resolution-agnostic and window size agnostic version of the metric.
I made it asset agnostic & resolution agnostic by including spread information to the formula. In our case it's weighted stdev over differenced data (otherwise we contaminate the spread with the trend info). And I made it window size agnostic by adding a non-linear relation of length to the output, so finally it will be aprox in (-1, 1) interval, by taking square root of length, nothing fancy. All these / 2 and * 2 in unexpected places all around the formula help us to return the data to it’s natural scale while keeping the transformations in place.
Peace TV
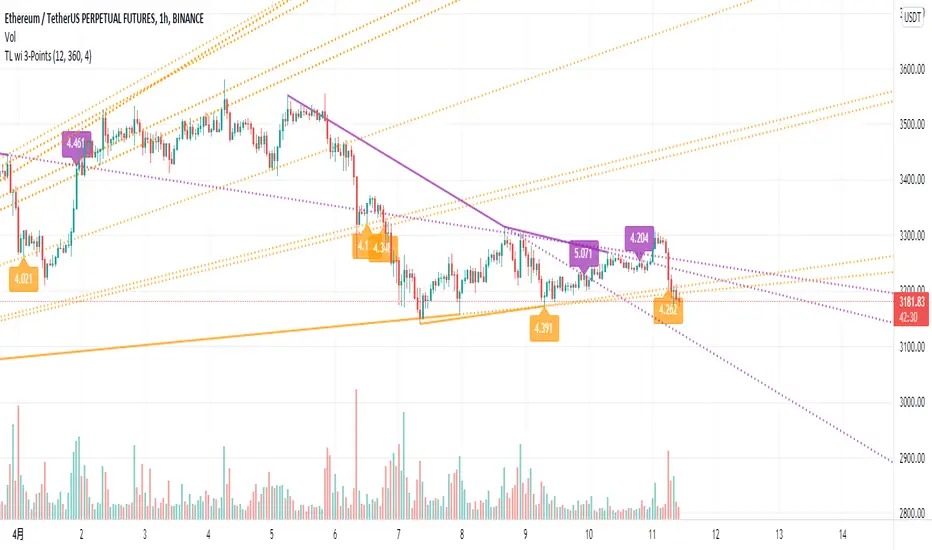
Trend Line wi 3-PointsHello, my friends. This is a new version of the trend line regression indicator, which always finds quantitive trend lines with three key points.
(1) Indicator description
This indicator finds a trend line with three key points on the historical K-line
Solving the problem of calculation timeout based on a faster trend line regression algorithm
Supports filtering unwanted trend lines by setting a trendline strength threshold
It's suitable for most markets and timeframes
(2) Key parameters
- Pivot High/Low Settings
Pivot Lookback Left: Number of K-lines to look back left from the pivot top/bottom
Pivot Lookback Right: Number of K-lines to look back right from the pivot top/bottom
- Trend Line Regression
Max of Lookback Forward: The maximum number of historical K-lines
Min Regression Strength: The minimum strength threshold for trend line regression
Multiply Regression Std: The width of the trend line to display on the chart
(3) Script description
Due to some circumstances that I don't want to see, subsequent scripts will not be open source, but you can still use the script for free. Thanks for your understanding and support!
If you have any suggestions or comments about the script, please feel free to leave your comments!
Happy trading, and enjoy your life!
————————————————————————————————————————
各位朋友大家好,这是一个全新的趋势线回归指标。该指标总是会找到在图表中具有3个关键点的合理趋势线
(1) 指标说明
该指标在历史K线上找到具有3个关键点的趋势线,并绘制于图表上
基于更快速的趋势线回归算法,解决了计算超时的问题
支持通过设置趋势线强度阈值过滤不需要的趋势线
该指标适用于大部分市场和时间周期
(2) 关键参数
- Pivot High/Low Settings
Pivot Lookback Left: 枢纽顶/底点往左回顾的 K线 数量
Pivot Lookback Right: 枢纽顶/底点往右回顾的 K线 数量
- Trend Line Regression
Max of Lookback Forward: 回顾历史 K线 的最大数量
Min Regression Strength: 趋势线回归的最小强度阈值
Multiply Regression Std: 趋势线的显示宽度
(3) 脚本说明
因为出现了一些我不希望看到的情况,后续的脚本将不再开源代码,但是您依然可以免费使用该脚本,感谢理解和支持!
如果您存在对于该脚本的使用建议或者意见,欢迎各位留言!
祝大家交易愉快
Smart Reg channel [monpotejulien]This indicator calculates an adaptative regression channel over a specified period or interval.
Resources:
rosettacode.org
en.wikipedia.org

Trend Line RegressionThis is a fast trend line regressor based on least squares regression.
(1) Supports setting regression from the Nth candle
(2) Supports the minimum and maximum regression candle interval length
(3) Supports finding the optimal regression region based on the length step among the minimum and maximum regression region lengths
(4) Supports displaying the optimal regression level
(5) The size of the regression region is 0.5 times the standard deviation by default
(6) You can filter the trend line by setting minimum trend line regression level
(6) Please properly set the parameters to avoid calculation timeout
Enjoy!
这是一个基于最小二乘法回归的快速趋势线回归
(1) 支持从第N根蜡烛开始设置回归
(2) 支持最小和最大的回归蜡烛区间长度
(3) 支持在最小和最大回归区间长度的基础上寻找最佳回归区域
(4) 支持显示最佳回归水平
(5) 回归区域的大小默认为标准差的0.5倍
(6) 可以通过设置最小趋势线回归等级来过滤趋势线
(6) 请正确设置参数以避免计算超时
使用愉快!

Price Region RegressionThis is an optimized price range regressor based on least squares regression.
(1) Supports setting regression from the Nth candle
(2) Supports the minimum and maximum regression candle interval length
(3) Supports finding the optimal regression region based on the length step among the minimum and maximum regression region lengths
(4) Supports displaying the optimal regression level
(5) The size of the regression region is two times the standard deviation by default
这是一个基于最小二乘回归的价格区间回归指标
(1) 支持设置从第N个蜡烛开始回归
(2) 支持最小和最大回归蜡烛的区间长度
(3) 在最小和最大回归区间长度中,根据长度步进寻找最优的回归区间
(4) 支持显示最优回归等级
(5) 回归区间的大小默认为2倍标准差
StrengthA mathematically elegant, native & modern way how to measure velocity/ strength/ momentum. As you can see it looks like MACD, but !suddenly! has N times shorter code (disregard the functions), and only 1 parameter instead of 3. OMG HOW DID HE DO IT?!?
MACD: "Let's take one filter (1 parameter), than another filter (2 parameters), then let's take dem difference, then let's place another filter over the difference (3rd parameter + introduction of a nested calculation), and let's write a whole book about it, make thousands of multi-hours YouTube videos about it, and let's never mention about the amount of uncertainty being introduced by multiple parameters & introduction of the nested calculation."
Strength: "let's get real, let's drop a weighted linear regression & usual linear regression over the data of the same length, take dem slopes, then make the difference over these slopes, all good. And then share it with people w/o putting an ® sign".
Fyi, regressions were introduced centuries ago, maybe decades idk, the point is long time ago, and computational power enough to calculate what I'm saying is slightly more than required for macd.
Rationale.
Linearly weighted linear regression has steeper slope (W) than the usual linear regression slope (S) due to the fact that the recent datapoints got more weight. This alone is enough of a metric to measure velocity. But still I've recalled macd and decided to make smth like it cuz I knew it'll might make you happy. I realized that S can be used instead of smoothing the W, thus eliminating the nested calculation and keeping entropy & info loss in place. And see, what we get is natural, simple, makes sense and brings flex. I also wanna remind you that by applying regression we maximize the info gain by using all the data in the window, instead of taking difference between the first and the last datapoints.
This script is dedicated to my friend Fabien. Man, you were the light in the darkness in that company. You'll get your alien green Lambo if you'll really want it, no doubts on my side bout that.
Good hunting

End Point Moving Average [EPMA]The End Point Moving Average was introduced in the October 95 issue of Technical Analysis of Stocks &
Commodities in the article "The End Point Moving Average", by Patrick E. Lafferty.
The Time Series Forecast takes this value and the slope of the regression line to forecast the next day and then plots this forecasted price as today's value.
For interpretation refer to Mr. Lafferty's article.
Please note
From line 10 starts my personal experemental modifications to this script, all above is original formula by Patrick E. Lafferty.
