Bogdan Ciocoiu - LitigatorDescription
The Litigator is an indicator that encapsulates the value delivered by the Relative Strength Index, Ultimate Oscillator, Stochastic and Money Flow Index algorithms to produce signals enabling users to enter positions in ideal market conditions. The Litigator integrates the value delivered by the above four algorithms into one script.
This indicator is handy when trading continuation/reversal divergence strategies in conjunction with price action.
Uniqueness
The Litigator's uniqueness stands from integrating the above algorithms into the same visual area and leveraging preconfigured parameters suitable for short term scalping (1-5 minutes).
In addition, the Litigator allows configuring the above four algorithms in such a way to coordinate signals by colour-coding or shape thickness to aid the user with identifying any emerging patterns quicker.
Furthermore, Moonshot's uniqueness is also reflected in the way it has standardised the outputs of each algorithm to look and feel the same, and in doing so, enabling users to plug them in/out as needed. This also includes ensuring the ratios of the shapes are similar (applicable to the same scale).
Open-source
The indicator uses the following open-source scripts/algorithms:
www.tradingview.com
www.tradingview.com
www.tradingview.com
www.tradingview.com
Relativestrength

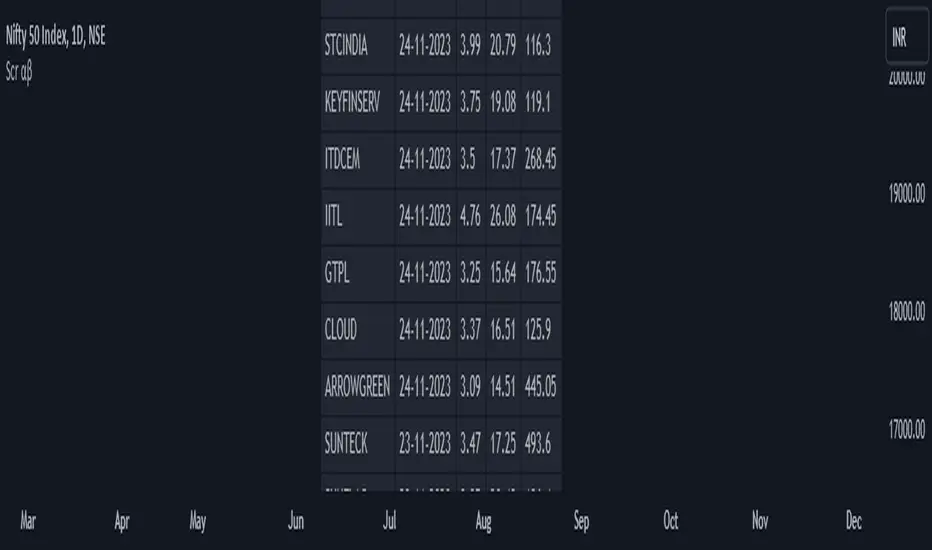
Screener for 40+ instrumentsAs you probably know in TradingView there is a limit of 40 instruments in one custom screener.
I created a script that will allow you to scan more symbols.
The idea of it is pretty simple. You have to add a screener a few times on your screen with a different set of symbols. Then select column width (as % of your chart width) and # of the screener right to left.
Script will plot #1 screener next to the right border. For #2 and all next tables, the script will compute the needed offset and will draw it on the left. This way it will look like one table and not a few separate indicators.
I created a script with an RSI screener, but you can create more complicated examples with it.
Off course, that's not a silver bullet solution but might work for some of you.
Disclaimer
Please remember that past performance may not be indicative of future results.
Due to various factors, including changing market conditions, the strategy may no longer perform as well as in historical backtesting.
This post and the script don’t provide any financial advice.

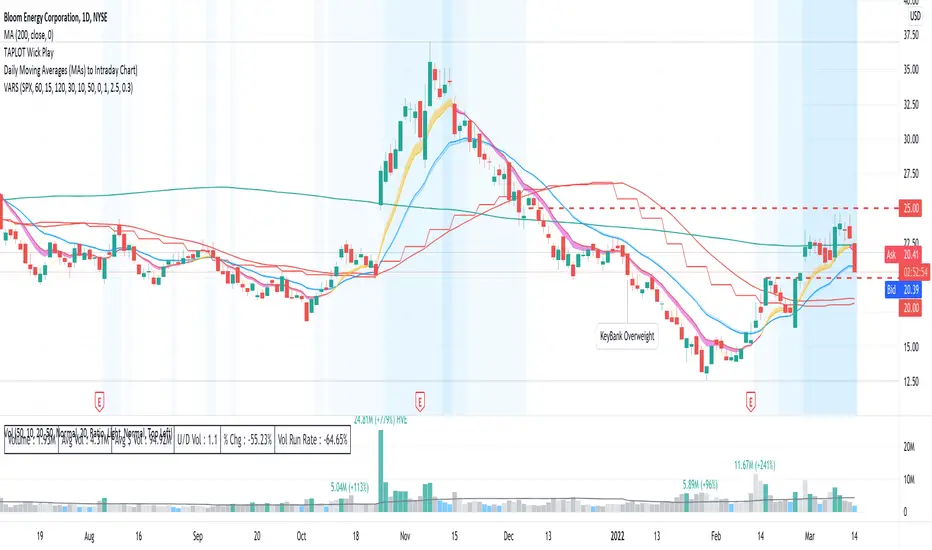
Volatility Adapted Relative StrengthVARS uses a stock's ALPHA in comparison to the SPX to determine whether there is RS on an volatility adjusted basis.
Multiple Relative Strength (Multiple RS) (XP)Multiple Relative Strength (Multiple RS) (XP)
You can see three Relative Strength lines.
The lines are thicker going from RS1 to RS2 to RS3, for differentiation.
Using the three RS, you can see long, medium, and short term performance at once.

Relative StrengthRelative strength is a calculation of the price trend of a stock or a financial instrument in comparison to another instrument, stock, or industry. It shall be determined by taking the price of one commodity and dividing it by another.
Relative strength is a strategy used for determining value stocks and is used in momentum investing as well. It involves investing in stocks that have done well, in relation to their index or benchmark. For example, a relative strength investor might pick technology companies that have outperformed the Nasdaq Composite Index or large-cap stocks that are lagging against the S&P 500 index(Adjustable in the settings).
This indiator will give you a plot for relative strength between the current pair with another pair (adjustable in the settings), with a plotshape for RSNHBP & RSNH
Features :
1. Relative Strength
2. Double EMA of Relative Strength
3. RSNHBP & RSNH
How to use it :
1. Adjust All the settings parameter
2. For Alerting, Just use any alert function call, it will give you an alert of RSNHBP and RSNH

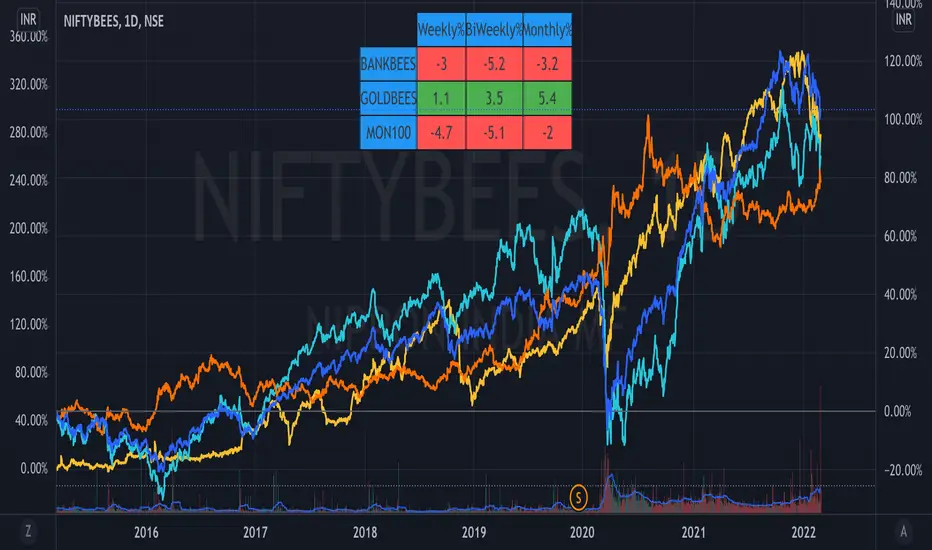
ETF Trends//@Devendra Akolkar - @dakolkar - This indicator will compare and show relative performance of 3 symbols.
// It'll compare those 3 symbols on 3 different Timeframe (Weekly - 5 sessions , BiWeekly - 10 sessions and Monthly - 20 sessions) and display performance in %
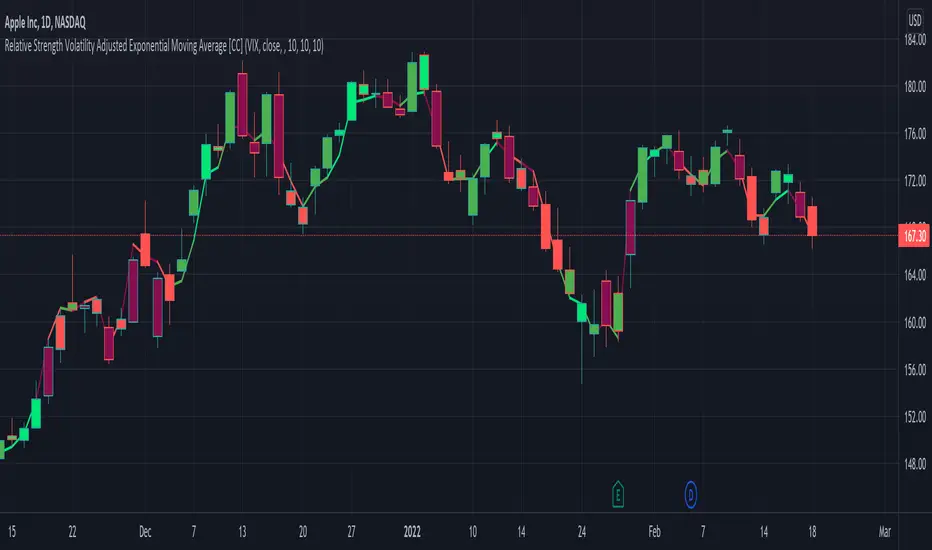
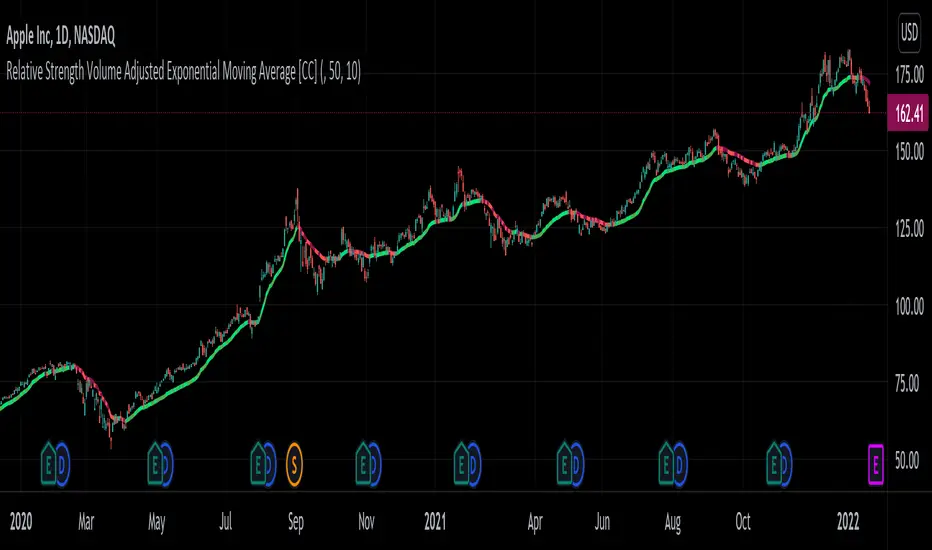
Relative Strength Volatility Adjusted Ema [CC]The Relative Strength Volatility Adjusted Exponential Moving Average was created by Vitali Apirine (Stocks and Commodities Mar 2022) and this is his final indicator of his recent Relative Strength series. I published both of the previous indicators, Relative Strength Volume Adjusted Exponential Moving Average and Relative Strength Exponential Moving Average
This indicator is particularly unique because it uses the Volatility Index (VIX) symbol as the default to determine volatility and uses this in place of the current stock's price into a typical relative strength calculation. As you can see in the chart, it follows the price much closer than the other two indicators and so of course this means that this indicator is best for choppy markets and the other two are better for trending markets. I would of course recommend to experiment with this one and see what works best for you.
I have included strong buy and sell signals in addition to normal ones so strong signals are darker in color and normal signals are lighter in color. Buy when the line turns green and sell when it turns red.
Let me know if there are any other indicators or scripts you would like to see me publish!
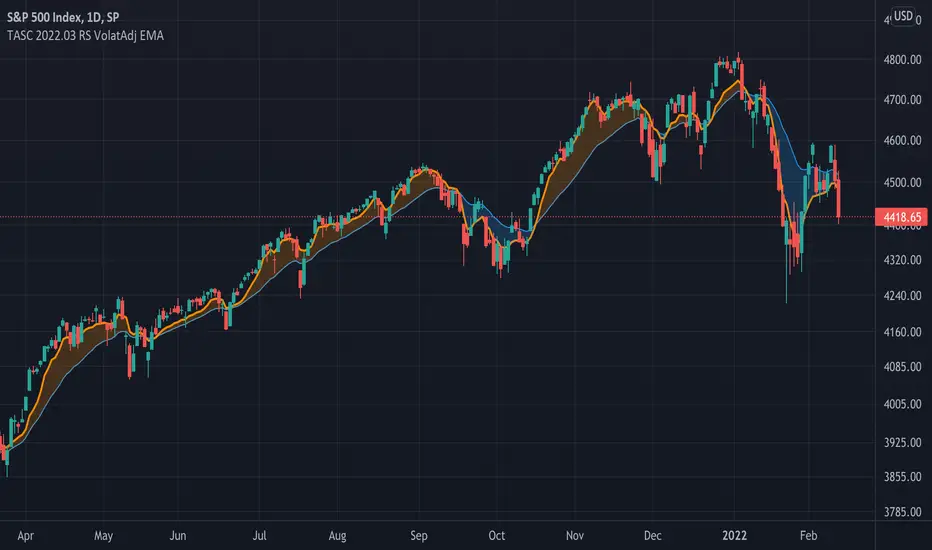
TASC 2022.03 Relative Strength Volatility-Adjusted EMA█ OVERVIEW
TASC's March 2022 edition of Traders' Tips includes the "Relative Strength Moving Averages - Part 3: The Relative Strength Volatility-Adjusted Exponential Moving Average" article authored by Vitali Apirine. This is the code that implements the "RS VolatAdj EMA" from the article.
█ CONCEPTS
In a three-part article series, Vitaly Apirine examines ways to filter price movements and define turning points by applying the Relative Strength concept to exponential moving averages . The resulting indicator is more responsive and is intended to account for the relative strength of volatility .
█ CALCULATIONS
The calculation process uses the following steps:
Select an appropriate volatility index (in our case it is VIX ).
Calculate up day volatility (UV) smoothed by a 10-day EMA.
Calculate down day volatility (DV) smoothed by a 10-day EMA.
Take the absolute value of the difference between UV and DV and divide by the sum of UV and DV. This is the Volatility Strength we need.
Calculate a MLTP constant - the weighting multiplier for an exponential moving average.
Combine Volatility Strength and MLTP to create an exponential moving average on current price data.
Join TradingView!
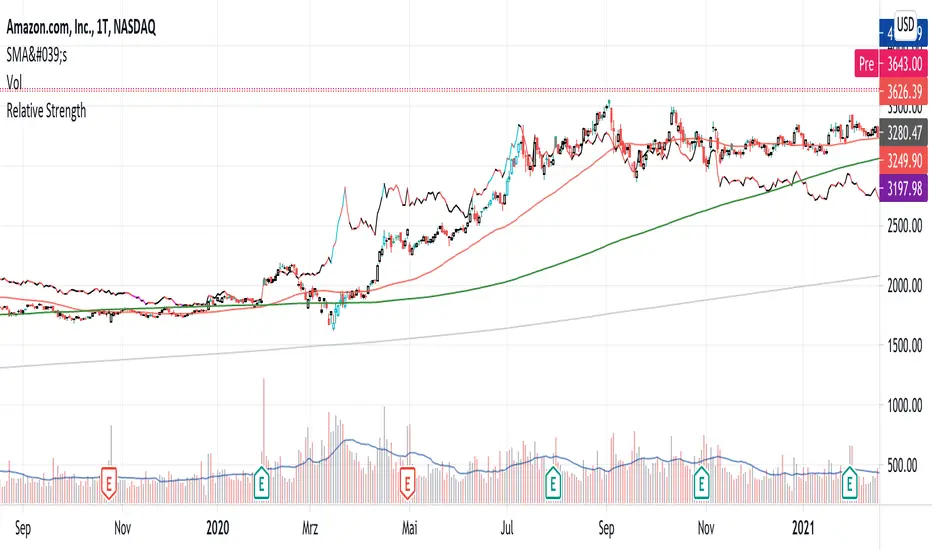
Linear Regression Relative Strength[image/x/iZvwDWEY/
Relative Strength indicator comparing the current symbol to SPY (or any other benchmark). It may help to pick the right assets to complement the portfolio build around core ETFs such as SPY.
The general idea is to show if the current symbol outperforms or underperforms the benchmark (SPY by default) when bought some certain time ago. Relative performance is displayed as percent and is calculated for three different time ranges - short (1 mo by default), mid (1 quarter), and long (half a year). To smooth the volatility, the script uses linear regression to estimate the trend and takes the start and the end points of the linear regression line to compute the relative strength.
It is important to remember that the script shows the gain relative to SPY (or other selected benchmark), not the asset's gain. Therefore, it may indicate that the asset is profitable, but it still may lose value if SPY is in downtrend.
Therefore, it is crucial to check other indicators before making a decision. In the example above, standard linear regression for one quarter is used to indicate the direction of the trend.

Relative Strength Volume Adjusted Exponential Moving Avg [CC]The Relative Strength Volume Adjusted Exponential Moving Average was created by Vitali Apirine (Stocks and Commodities Feb 2022 pgs 14-18) and this is very similar of course to the last Relative Strength Exponential Moving Average . It works under the same concept with using overbought and oversold methods to adjust the moving average and with this particular version you will notice that sudden drops or increases won't follow super closely so this can be useful along with the other as a good complementary indicator to use with each other to determine the short and medium term trend and to give good entry and exit points. I have strong buy and sell signals in addition to normal ones so darker colors are strong and lighter colors are normal. Buy when the indicator line turns green and sell when it turns red.
Let me know if there are any other indicators or scripts you would like to see me publish!
Relative Strength Exponential Moving Average [CC]The Relative Strength Exponential Moving Average was created by Vitali Apirine (Stocks and Commodities Jan 2022 pgs 22-25) and this is a handy moving average that combines a typical overbought/oversold mechanic with an overall trend indicator. Even though the typical length is so large it reacts extremely quickly when the stock becomes overbought or oversold. Because of this the indicator by itself doesn't work as well during choppy periods so Vitali recommends using a moving average crossover system during choppy so do one indicator with the default length of 50 and use a different length of 10 so when the shorter length crosses over the longer length then buy and vice versa you would sell. Generally speaking buy when the line turns green and sell when it turns red. I have used strong buy and sell signals in addition to normal signals so strong signals are darker in color and normal signals are lighter in color.
Let me know if there are any other scripts or indicators you would like me to publish!

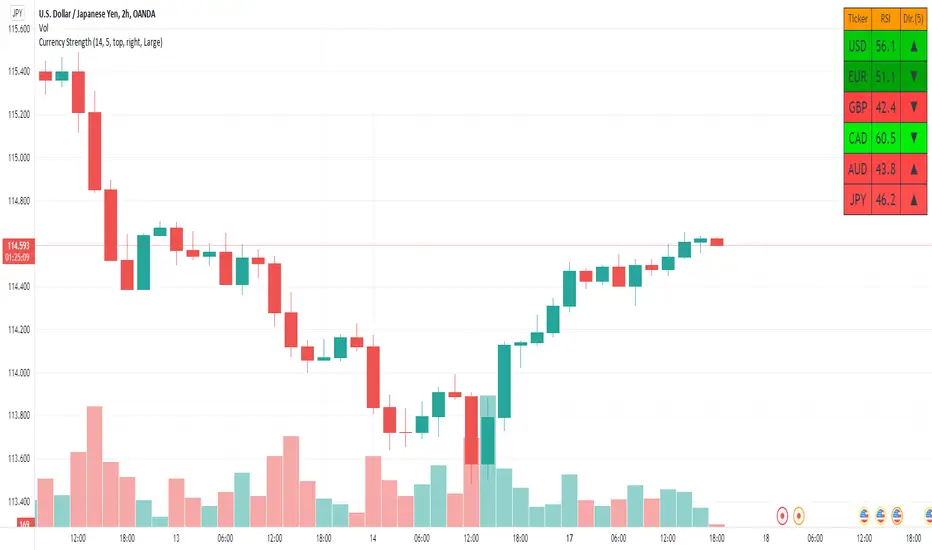
Currency StrengthThis script measures the strength of the 6 major currencies USD, EUR, GBP, CAD, AUD and JPY.
Simply, it averages the RSI values of a currency vs the 5 other currencies in the basket, and displays each average RSI value in a table with color coding to quickly identify the strongest and weakest currencies over the past 14 bars (or user defined length).
The Dir. value looks at the difference in average RSI value between current and X bars back (user defined), telling you whether the combined RSI value has gone up or down in the last X bars.
Using the average RSI allows us to get a sense of the currency strength vs an equally weighted basket of the other majors, as opposed to using Indexes which are heavily weighted to 1 or 2 currencies.
The table doesn't load super fast as we are making 15 Security requests to get the values for each pair (where possible we reverse the values of the pair to reduce Security requests, e.g. we don't need to request EURUSD and USDEUR, we reverse the value to calculate the USD RSI).
Relative Strength vs SPY - real time & multi TF analysisOne of the most requested features for TradingView is the ability to include custom indicators in the stock market scanner. While I am sure this feature is coming soon (seriously TV, PLEASE) I decided to use the amazing template provided by QuantNomad (), but I wanted to allow the user to modify the table a bit better so that a multi time frame analysis approach could be used.
The recommended way to use this indicator is to apply it three times to your chart. For each instance, assign it a plotting location (left, center, right) and choose the timeframe you wish to use for the RS analysis. By default, the relative strength of all 39 pre selected stocks will be compared against SPY, on the 5 min timeframe. I personally like having this chart on the left, then the 4 hour timeframe in the center, and the daily on the right. Not only does this setup allow you to see the relative strength/weakness of 39 stocks in real time (the one on the left), but you have all the information in front of you including how the stock has been performing relative to SPY on the 4H and D charts.
To make it easiest to read, you should disable all visual elements to the chart you are applying this indicator to. By minimizing the chart and putting it by your side, you can see the bigger picture on how all your stocks are behaving relative to the market.
If you wish to change any of the stocks I have pre selected, make sure to save your chart template. Otherwise you would need to do this every time you load the indicator to your chart which would be incredibly time consuming.

The M Score - Ultimate v5.0The M Score - Ultimate v5.0
*Introducing M score version 5.0*
Additions to the indicator:
1. 200 EMA Band (High-Low) added
2. Bottom left table - Shows All Time High/Lows (52 weeks) and % away we are from both. The values will not change in this table even if you change the timeframe.
3. Bottom center table - Performance matrix and a quick glance comparison with Nifty with different days of return. This will show if there outperformance or underperformance in the scripts and in which duration.
4. Top Right table - This indicator plots a table off to the right of the chart to help with determining timeframe continuity. A great edge is only taking trades where full timeframe continuity is in place (i.e. if you are going long, make sure other timeframes are also green).
Green candles have green colored boxes, red candles have red colored boxes.
Inside bars are represented by a circle - ⬤
Outside bars are represented by a tall rectangle - ▮
2-up bars are indicated by an up arrow - ▲
2-down bars are indicated by a down arrow - ▼
User defined options:
Pick any timeframe for the 4 boxes
Hope you will will like the efforts.

RVI Relative Volume IntradayRVI Relative Volume Intraday is a simple label next to the last bar that shows the relative volume as a percentage of the ratio of today's volume to the average volume for the same intraday time period of the last five days. Useful for break-out intraday strategies.

Relative Strength (IBD Style)This script is meant to give you a Relative Strength indication of the stock. The goal is to use a similar calculation as used by IBD.
It calculates the performance of the current stock for the last year (most recent quarter is weighted double) and compares it to the performance of a reference index or ticker (default is "SPY").
IBD would give you a value between 0 and 100 because this value is the percentile within all stocks. This is not possible with Pine Script at the moment.
So here you get a Relative Strength value that is >0 if the stock is stronger than the index and <0 if it is weaker than the index.
You can still compare the Relative Strength values between stocks (bigger is better) but you won't know which percentile it is right off the bat.

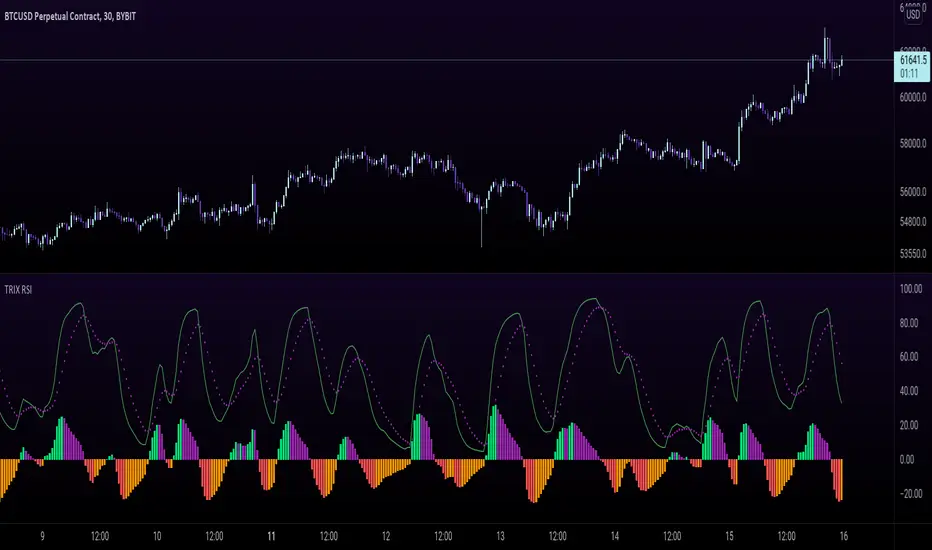
TRIX RSI - Tripple Exponetial Relative Strength (TRSI) This indicator applies the RSI formula over the TRIX indicator to get the TRIX RSI.
The EMA and the TRIX RSA cross gives you an indication for a trend change
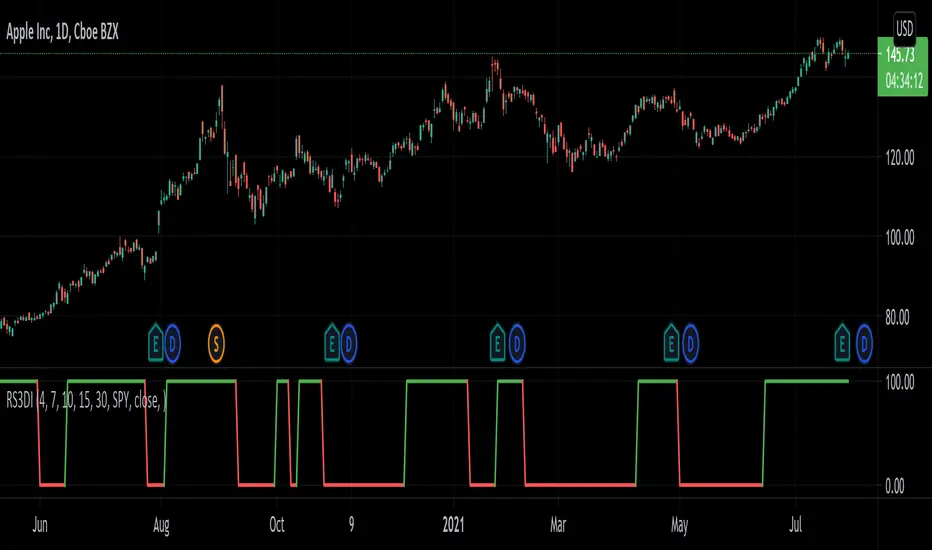
Relative Strength 3D Indicator [CC]This is a custom indicator of mine loosely based on the work by James Garofallou (Stocks and Commodities Sep 2020 pg 14) and this is meant for medium to long term trend confirmations. The idea behind this indicator is to capture 3 different dimensions of trend strength. The first dimension captures the overall strength of the underlying stock vs the market (in this case the S&P 500). The second dimension captures the overall trend strength by assigning a scoring system so when all faster moving averages are stronger than slower moving averages then it gets the max points. The final dimension is the strength of the overall strength of everything so far. Buy when the indicator line turns green and sell when it turns red.
Let me know if there are any other indicators or scripts you would like to see me publish!
Relative StrengthPowerful tool to calculate and display the strength of a security compared to another security.
Some Main purposes are:
- finding new leadership in a market correction
- comparing a market leader with a top competitor
- tracking rotation in the market
.. and so much more!
This tool is highly configurable, you can especially change:
- The reference symbol (SPY, QQQ, BTCUSD, ...)
- The time span to indicate a new High or Low in a certain time-frame
- Factorize your RS-Chart to make it fit to the original chart. (Moves the chart up or down)
- Option to repaint your candles / bars when a new RS High occurs in the given timeframe.
Enjoy and have a great day!
Powerful_Trading
Ultimate RSIsThis RSI script includes everything you could want on an RSI. There are multiple timeframes which will give context to market movement, as well as a highlight feature to make it easier to visualize overbought and oversold stocks.
Tip: Uncheck the 4 plots with no color in them to remove the extra headers on the indicator.

Screener: Alpha & Beta IndexThis is a Index Screener which can short list the major Sectors contributing to NIFTY movement that day.
This helps in sector based trading, in which we can trade in the stocks which falls under that particular sector.
No need to roam around all the stocks in the whole watchlist.
It is recommended to create sector wise watchlist of all sectors. It will be easier to concentrate in only one sector.
For example in IT sector index there are certain stocks which contribute to the movement of IT sector.
This will be available in NSE (or exchange website).
For detailed description check out the descriptions in my previous 2 Alpha and Beta indicators.
Combine and use this screener with my previous Alpha & Beta indicator.

Screener: Alpha & BetaThis is a Live Screener for my previous Alpha & Beta indicator, which filters stocks lively based on the given values.
Use 5min timeframe for Live Intraday.
The default stocks in the screener is selected based on high beta value from F&O listed stocks. It may include other stocks also.
User can input stocks of your choice either through the menu or through the Pine editor.
The maximum number of stocks inputs is only 40. The indicator includes only 20 stocks by default.
More number of stocks can be added but it makes the screener slower to load.
Open the indicator in a sperate tab or window to avoided the loading lag.
It is recommended to choose only 10 to 20 stocks based on the weightage from each sectors.
Beta values are dynamic. It changes from day to day based on the trend and sector.
Update the sock list weekly or twice a week or monthly.
Use investing.com screener(preferably) or TradingView screener for shortlisting beta stocks.
Remember that majority of indicators fails in a sideways market, also every indicator is not 100% accurate.
Alpha & BetaHow to use Alpha(α)?
If Alpha is positive the stock outperforms, if the value is negative means the stock underperforms.
α < 0: The investment has earned too little for its risk (or, was too risky for the return)
α = 0: The investment has earned a return adequate for the risk taken
α > 0: The investment has a return in excess of the reward for the assumed risk
How to use Beta(β)?
β = 1: Exactly as volatile as the index
β > 1: More volatile than the index
β < 1 > 0: Less volatile than the index
β = 0: Uncorrelated to the index
β < 0: Negatively correlated to the index
β > 2: Trending stock
Higher the β higher risk/reward
Example: If the beta is 1.1, the share price is like to move by 10% more than the index
Trading Tip
Choose a stock with Alpha greater than 0 and Beta greater than 1.9 for intraday in 5min timeframe for long positions
Remember that such stocks will have high risk and high reward
Shortlist stocks with Beta greater than 1.9 for next day in 5min timeframe
