MTF RSI — Centered at Zero# 🌟 **MTF RSI — Centered at Zero(英語版 Description)**
**A multi–timeframe RSI tool designed for trend-filtered entries and safer reversal timing.
This script transforms both the current timeframe RSI and the 4H RSI by centering them at zero (RSI − 50), giving a clean, intuitive regime view.**
---
## 🔍 **Core Concept**
Traditional RSI fluctuates between 0–100, but the true trend cue lies in the relationship to 50.
By centering RSI at zero, you instantly see:
* **Above 0 → bullish pressure**
* **Below 0 → bearish pressure**
On top of this, the script plots the **4H RSI as a histogram**, allowing you to visually confirm whether the market is in a BUY-ONLY or SELL-ONLY environment before taking any signals.
---
## 🎯 **What This Script Helps You Do**
* Avoid dangerous counter-trend trades
* Identify high-quality reversal points only when aligned with the 4H trend
* Enter pullbacks or bounces with noticeably higher accuracy
* Visually detect regime strength and extreme conditions (RSI >70 / <30)
Even during aggressive trending markets, the combined filter
**(4H regime + local RSI extreme + initial reversal signal)**
keeps you only in high-probability opportunities.
---
## 💡 **Color Logic**
### Vertical stripe (per-bar):
* 🔴 **Overbought (RSI >70)** — red / pink
* 🔵 **Oversold (RSI <30)** — blue
* Colors become stronger when the 4H and current RSI extremes align
* Option to show history or only the most recent bar
### Histogram (4H RSI – 50):
* Pink column above 0 → bullish bias
* Blue column below 0 → bearish bias
### Pivot Signals:
* 🟠 **Buy Signal**: RSI crosses up from local weakness *AND* 4H is BUY-ONLY
* 🔴 **Sell Signal**: RSI crosses down from local strength *AND* 4H is SELL-ONLY
These signals often align with classical **Granville #4 / #8** (deep pullback reversals).
---
## ⏱️ **Timeframe Usage**
Works well on:
* **5m** for active traders
* **15m** for conservative entries
* **1H** for swing confirmation
All of them rely on the same principle:
**“Let the 4H trend guide the direction, and take only high-probability reversals.”**
---
## 🚀 **Best Use Case**
Enter only when:
1. 4H histogram clearly shows BUY-ONLY or SELL-ONLY
2. Local RSI hits extreme zones
3. A bounce or breakdown occurs
4. Your stop-loss is clearly defined beneath the reversal structure
This combination creates consistently **small losses, larger wins** —
ideal for systematic short-term trading.
---
---
# 🌟 **MTF RSI — Centered at Zero(日本語版 Description)**
**RSIを 50 でセンタリングすることで、
“相場が上に傾いているのか / 下に傾いているのか” を一瞬で判別できる、
マルチタイムフレーム対応のRSIトレンド・フィルタースクリプトです。**
---
## 🔍 **スクリプトの核心**
RSIの本質は「50を境に強弱が決まる」ことにあります。
そこで **RSI − 50** を使い、
* **0より上 → 上昇バイアス**
* **0より下 → 下降バイアス**
となるように変換しています。
4時間足RSIも同様にゼロ基準でヒストグラム化するため、
**いま市場の“支配方向(BUY ONLY / SELL ONLY)”がひと目で分かる仕様** にしています。
---
## 🎯 **このスクリプトが解決する課題**
* トレンドに逆らった“危険な逆張り”を避けられる
* 4時間足トレンドと一致したときだけ反転シグナルが出る
* 押し目買い・戻り売りの精度が高まる
* 極端ゾーン(RSI >70 / <30)を自動で縦ストライプ表示
特に、
**4時間足のトレンド + 極端ゾーン + 初動シグナル(RSI反転)**
のセットアップは実戦での成功率が非常に高いです。
---
## 🎨 **カラーの意味**
### ◆ 縦ストライプ(バー単位)
* 🔴 RSI > 70 → オーバーボート(赤/ピンク)
* 🔵 RSI < 30 → オーバーソールド(青)
* 4Hも同方向の極端であれば濃く表示
* 「過去の塗りを消すモード」搭載(今バーのみ表示)
### ◆ 4時間足ヒストグラム(RSI − 50)
* ピンク:上昇圧力(BUY ONLY に近い)
* 青:下降圧力(SELL ONLY に近い)
### ◆ 反転シグナル
* 🟠 BUY:RSIが弱い領域から上抜け + 4H BUY ONLY
* 🔴 SELL:RSIが強すぎる領域から下抜け + 4H SELL ONLY
これはグランビルの4番/8番(深い押し・戻りの反転)にも一致します。
---
## 🕒 **推奨タイムフレーム**
* 5分足:素早くエントリーしたい人
* 15分足:最も安定
* 1時間足:ゆったり目線のスイング向け
---
## 🚀 **ベストな使い方**
以下の条件が揃ったとき、統計的に最も強いエントリーになります:
1. 4時間足RSIヒストグラムが BUY ONLY / SELL ONLY
2. 15分足RSIが極端ゾーンに到達
3. 反転初動のシグナルが点灯
4. 損切りラインが構築できている
(直近安値・高値のすぐ外側)
これにより、**損小利大でブレの少ないトレード** が可能になります。
相对强弱指数(RSI)

RSI ✶ YSTCThis is a Bonus Indicator from YSTC's Volume Profile Tools.
Relative Strength Index (RSI)
A momentum based oscillator which is used to measure the speed (velocity) as well as the change (magnitude) of directional price movements.
What Different about this RSI by YSTC.
You get Support and Resistance lines for RSI which are 20, 30, 40, 50, 60, 70, 80. as shown below.
It can also show RSI Candles as shown below.
For those who want all types of MA with MA Cross can play with this indicator. Below is MA Cross of 9, 21.
And for NEW user with untrained eyes who cant yet detect Divergence this indicator Saves you the trouble of finding.
Below is Regular Bullish and Bearish Divergence. Linewidth 2.
Below is Hidden Bullish and Bearish Divergence. Linewidth 1.
You can add this script to your chart by clicking "Add to favorites" button.
Have Questions ?
Contact: +91 9637070868.
Name: Yogesh Patil (YS Trading Coach).
Time: Monday to Saturday (10:00 AM - 06:00 PM).
Visit our website - YS Trading Coach .
FREE Self Study Yourself Course: Trading with Price Action Volume .
Free Stock Market Introduction Available here .
Paid Course: Trading with Price Action Volume
Paid Volume Profile Tools available here.

Bullish/Bearish Divergence DetectorUsuable on all time-frames
Indicates multiple divergences (up to 3) with the same start point/date of the divergence

Dynamic S/R Zones with Signal RatingZones are Main target, Signals are based on RSI , they are not nessry coreect but if they break useually price explode

TrendX Amila Bro
TrendX Fib + RSI Divergence is a modern trend-following + confluence-based trading tool designed to reduce false signals and improve accuracy.
It combines EMA crossover , RSI momentum , Fibonacci retracement zones , and RSI divergence to provide high-quality BUY/SELL signals.
---
🔥 Core Features
### ✅ 1. Trend Detection (EMA 9/21 by default)]
The script identifies trend shifts using fast and slow EMAs.
* BUY when Fast EMA crosses above Slow EMA + RSI confirmation
* SELL when Fast EMA crosses below Slow EMA + RSI confirmation
These are the Base Signals — always shown.
---
### ✅ 2. Fibonacci Confluence Filter (Optional)
Signals become stronger when price pulls back into key Fib zones:
* 0.5 retracement
* 0.618 golden ratio
This helps avoid chasing late entries and improves accuracy in trend pullbacks.
---
### ✅ 3. RSI Divergence Filter (Optional)
Detects both:
* Bullish Divergence → BUY
* Bearish Divergence → SELL
When divergence agrees with EMA trend shift, a Filtered BUY+/SELL+ signal is shown.
---
### ✅ 4. Two Types of Signals
✔ BUY / SELL
Base signals from EMA + RSI (appears even if filters are OFF)
✔ BUY+ / SELL+
Strong signals using
* EMA Trend
* RSI Confirmation
* Fibonacci Confluence
* RSI Divergence
These are rare but extremely high-probability entries.
---
### ✅ 5. Visual Elements
* EMAs
* Fibonacci 50% & 61.8% levels
* Divergence markers
* BUY / SELL arrows
* BUY+ / SELL+ arrows for filtered confluence entries
---
### ✅ 6. Alerts Included
You can set TradingView alerts for:
* BUY+ (strong long signal)
* SELL+ (strong short signal)
Great for mobile/Telegram alerts.
---
## 🎯 How Traders Use This
* Scalping (1m, 5m)
* Intraday (15m, 30m, 1H)
* Swing trading (4H, 1D)
Works on **Forex, Crypto, Indices, Metals, Stocks**.
---
## ⚠️ Disclaimer
No indicator guarantees 100% accuracy.
Always combine with proper risk management and market context.
---
## ⭐ Ideal For:
* Trend traders
* Pullback traders
* Divergence traders
* Anyone wanting cleaner, filtered BUY/SELL signals
---

MAG8 Breadth RSI This indicator is for my personal monitoring breadth of MAG 8 , including AVGO for use to trade spy/es and qqq/nq.
A green bar over 6 translates to 6 out of the 8 stocks have RSI's<30. Conversely a red indicator at 6 would indicate 6 out of 8 are overbought, RSI >70.
Extreme 6-8 of 8 either overbought (red) or oversold (green)
Moderate 4-5 of 8 either overbought (red) or oversold (green)
No Signal 0-3 of 8 either overbought (red) or oversold (green)
Not trading advice but thought I would share.


WTC Step Buy Step Edition CbyCarlo📊 WT Cross Modified – Step Buy Step Edition (v4)
WTC_StepBuyStep_Edition is an enhanced, practical, and optimized version of the classic WaveTrend (WT) Cross Indicator.
Developed for the Step Buy Step project, this tool helps traders identify market momentum shifts, structural price zones, and potential reversal areas with high clarity and precision.
🔍 Concept & Purpose
This indicator builds upon the established WaveTrend / LazyBear logic and extends it with additional structural intelligence.
The goal is to make overbought/oversold phases and trend reversals easier to spot — while also highlighting historically validated price zones where the market has previously reacted strongly.
⚙️ Key Features
1️⃣ WT Cross Signals
WT1 (yellow) and WT2 (purple) visualize market momentum.
A WT1 cross above WT2 while below the Oversold zone (−53) can indicate potential Long opportunities.
A WT1 cross below WT2 while above the Overbought zone (+53) can indicate potential Short opportunities.
Signals only confirm after candle close to prevent repainting.
2️⃣ Dynamic “WT SignalZone” Panel
Displayed in the top-right corner, this panel shows the last three valid price levels derived from WT signals:
🟢 LonLev – Buy support levels from previous WT Long signals
🔴 ShoLev – Sell resistance levels from previous WT Short signals
These zones act as objective support/resistance structures, based on historical momentum turning points — not subjective lines.
3️⃣ Flexible Calculation Modes
Choose how levels are derived from each WT signal:
Pullback 50% → Midpoint of the signal candle (high+low)/2
Close → Close price of the signal candle
Next Open → Open of the following bar (ideal for system testing)
📈 How to Interpret the Indicator
Market Condition WT Event Meaning
WT1 < −53 & CrossUp Long Signal Potential reversal / buy zone
WT1 > +53 & CrossDown Short Signal Potential exhaustion / sell zone
Price revisits LonLev Support Re-entry or bounce zone
Price revisits ShoLev Resistance Profit-taking or short setup zone
This makes the tool highly effective for:
Swing traders
Zone-based trading strategies
Systematic re-entries
Identifying structural turning points
🧠 Advantages
No repainting (signals confirmed only after bar close)
Works on all timeframes (from intraday to weekly)
Clean overview without clutter or excessive chart markers
Excellent as a filter to confirm market context
💬 Best Use Case
Use WTC_StepBuyStep_Edition as a contextual confirmation tool.
It does not replace a full trading system — but it gives you objective, repeatable, and statistically relevant zones where the market has reacted before.
Combine it with price action, volume analysis, or trend tools for even stronger setups.
© Step Buy Step • Step-Buy-Step.com
Educational trading tool intended for market analysis.
Not financial advice.

RSI Maniac
RSI Maniac
A powerful, fully-customizable RSI indicator designed for traders who want deeper insight into momentum across multiple timeframes. This indicator enhances the traditional RSI by adding multi-timeframe analysis, multi-timeframe moving averages, and optional Bollinger Bands applied directly on the RSI curve.
----- Key Features -----
1️⃣ Multi-Timeframe RSI (HTF RSI) : Analyse higher-timeframe momentum while staying on your current chart.
Enable/Disable HTF RSI
Select any timeframe (1m → 1M)
Dedicated RSI length & source for HTF
Great for spotting:
Trend confirmation or divergence between LTF & HTF momentum
2️⃣ Multi-Timeframe Moving Averages : A powerful addition for traders using higher timeframe confirmation.
Enable/Disable HTF MAs
Independent Fast & Slow MA settings
Separate HTF timeframe
Separate MA type for HTF (EMA or HMA)
Great for spotting:
HTF RSI trend direction
HTF momentum overlays on LTF RSI
Cross-timeframe momentum alignment
🎛️ Clean & Organized User Interface : The indicator organizes settings into intuitive groups.
Current Timeframe RSI
Current Timeframe MA
Higher Timeframe RSI
Higher Timeframe MA
Bollinger Bands Settings
Traders can toggle any component independently.
How to trade ?
Based on my approach, I don’t use RSI to catch reversals. Instead, I use it to trade continuations—when the lower timeframe (LTF) RSI aligns with the higher timeframe (HTF) trend. I simply wait for the LTF RSI to move in the same direction as the HTF RSI and then take the continuation trade. Please check the snapshots for a clearer understanding of how these trades work.
Trade less, trade better!

AURORA LEGACY INDICATOR
The AURORA LEGACY is an advanced indicator developed in Pine Script v6 for the TradingView platform, designed to integrate multiple approaches of technical analysis into a single modular and customizable system. Its architecture combines classic elements, such as exponential moving averages (EMA Ribbon), RSI, and ATR, with modern tools inspired by Smart Money Concepts (SMC), including Supply & Demand zones, Break of Structure (BOS), and Points of Interest (POI).
The indicator is structured to provide traders with flexibility, offering pre-configured trading profiles (Scalper, Day Trade, Swing Trade, Sniper) or full manual customization of moving averages. The dynamic Ribbon serves as the core of trend analysis, supported by additional confluences through secondary moving averages (VWMA, LWMA, SMMA) and volatility filters based on ATR.
Key features include:
Trend & Signal System: detection of reversals and trend confirmations through Ribbon color alignment, with automated buy/sell alerts.
Automated Risk Management: dynamic calculation of entry levels, Stop Loss (SL), and multiple Take Profits (TPs), displayed on chart with labels and risk-reward ratio (R:R).
Multi-Timeframe (MTF) Trend Table: consolidated overview of trend, RSI, and volatility (ATR) across different timeframes (5M, 15M, 1H, 4H, Daily).
Smart Money Concepts Integration: automatic detection and marking of Supply & Demand zones, BOS, market structure zigzag, and points of interest.
Complementary Tools: customizable RSI signals by profile, daily support and resistance levels, CPR levels, and visual session markers (London, New York) including overlap zones.
This system was designed to provide a holistic trading approach, combining price action, volatility, indicator confluence, and institutional concepts to support traders of different profiles in making clearer and more precise decisions.

Enhanced Multi-Indicator StrategyEnhanced Multi-Indicator Strategy v7 is a trend-following confirmation tool that combines several classic indicators into one clear “voting system.”
Instead of relying on a single signal, this script counts how many indicators agree on a bullish or bearish bias and only fires when the majority lines up and the trend is strong.
It’s designed to help you:
Filter out low-quality signals
Avoid trading against the dominant trend
Get clean, one-time BUY/SELL markers instead of noisy spam signals
How it Works
The indicator evaluates up to 10 components on each bar:
Trend & Structure
Moving Average (MA 50)
EMA Fast (20) vs EMA Slow (50)
Momentum
RSI (14)
MACD (12/26/9)
KDJ
Volatility & Price Location
Bollinger Bands (20, 2)
VWAP
Volume
Volume vs Volume MA (20)
Trend Strength & Direction
ADX + DMI (trend strength and up/down direction)
Optional
Ichimoku Cloud (price vs Senkou A/B)
Each indicator votes bullish or bearish.
The script then:
Counts how many are bullish → bullish_count
Counts how many are bearish → bearish_count
Requires at least Min Indicators for Entry (user-defined) to agree in one direction
Requires ADX above a threshold (default 20) to confirm trend strength
(Optionally) forces entries to follow the DMI trend:
Longs only in uptrends
Shorts only in downtrends
Only when these conditions are met does the script consider a valid long zone or short zone.
Signals: 1x Fire + Cooldown
To keep the chart clean and prevent over-trading:
A BUY arrow is plotted only on the first bar when price enters a new bullish zone.
A SELL arrow is plotted only on the first bar when price enters a new bearish zone.
A cooldown (in bars) can be configured separately for BUY and SELL so the script will not fire again in the same direction too frequently.
Background colors (optional):
Green background = bullish zone (majority indicators bullish + strong trend)
Red background = bearish zone (majority indicators bearish + strong trend)
This makes it easy to see when the “environment” is favorable for longs or shorts, while the arrows highlight the first opportunity in each zone.
Inputs & Tuning
Key inputs:
Min Indicators for Entry – how many indicators must agree (e.g. 5–7 for stricter filtering)
Strict Trend Filter – if enabled, entries must follow DMI trend (recommended for trend-following)
Cooldown BUY / SELL – minimum number of bars before a new signal in the same direction
Toggles to enable/disable each component (MA, EMA, RSI, MACD, KDJ, BB, Volume, VWAP, ADX, Ichimoku)
General ideas:
Increase Min Indicators for Entry and/or cooldown to reduce the number of signals and focus on stronger trends.
Lower values will make the indicator more active, suitable for shorter-term trading or scalping.
Important Note
This is an indicator, not a full trading system:
It does not manage entries/exits, position sizing, or risk by itself.
Always combine it with your own risk management, stop-loss / take-profit rules, and higher-timeframe context.
Use it as a confirmation / regime tool:
Trade only in the direction of the active zone,
Take BUY signals during bullish regimes,
Take SELL signals during bearish regimes.

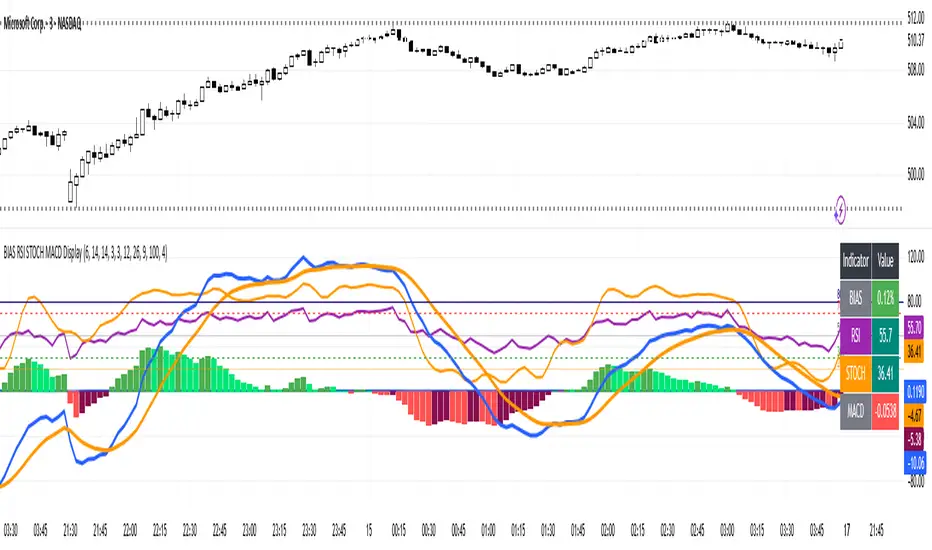
BIAS RSI STOCH MACD Displaysimple but effective to prevent chart clutter.
Hi Traders! Today I’m showing you a **custom indicator** that combines **BIAS, RSI, Stochastic, and MACD** in one easy-to-read panel. Let’s break it down:
1️⃣ **BIAS** – Shows how far the price is from its moving average.
* Positive BIAS → price is above the average.
* Negative BIAS → price is below the average.
2️⃣ **RSI (Relative Strength Index)** – Measures momentum.
* Above 70 → overbought
* Below 30 → oversold
* **50 line added** → midpoint for trend direction
3️⃣ **Stochastic (STOCH)** – Confirms momentum like RSI.
* Above 80 → overbought
* Below 20 → oversold
4️⃣ **MACD (Moving Average Convergence Divergence)** – Shows trend and momentum.
* Histogram colors indicate strength
* Lines show trend direction
5️⃣ **Visual Table** – On the top right, you can see all current indicator values at a glance, with color coding for easy interpretation.
6️⃣ **Plots & Levels** –
* BIAS, RSI, Stoch are plotted clearly
* RSI has **midline at 50** for trend reference
* Standard overbought/oversold levels highlighted
✅ **How to Use:**
* Look for RSI or Stoch crossing midline or extreme levels for potential entries.
* Check MACD histogram and lines for confirmation of trend strength.
* Use BIAS to see if price is stretched from the moving average.
This indicator is perfect for **momentum, trend, and mean-reversion traders**, giving multiple signals in one pane without clutter.
---
Smart TP Manager - FREE Edition📘 Smart TP Manager - User Guide
🎯 Parameter Adaptation by Timeframe
IMPORTANT: Default parameters are optimized for M5 (5 minutes). If you trade on other timeframes, you MUST adapt the parameters for better results.
📊 Recommended Settings Table
M1 (1 minute) - Ultra Scalping
ATR SL Multiplier: 1.5 - 1.8
Number of TPs: 3 - 4
Base RR: 0.4 - 0.5
Confirmation Bars: 2
Cooldown: 3 - 5 bars
Breakeven: Enable after TP1
Profile: Very fast trades, immediate exits, tight SL
M5 (5 minutes) - Scalping ✅ DEFAULT
ATR SL Multiplier: 1.8 - 2.0
Number of TPs: 4 - 5
Base RR: 0.5 - 0.6
Confirmation Bars: 2 - 3
Cooldown: 5 - 8 bars
Breakeven: Enable after TP1 or TP2
Profile: Standard scalping, balance between speed and security
M15 (15 minutes) - Intraday
ATR SL Multiplier: 2.0 - 2.2
Number of TPs: 5 - 6
Base RR: 0.6 - 0.8
Confirmation Bars: 3
Cooldown: 8 - 10 bars
Breakeven: Enable after TP2
Profile: Intraday trading, 3-8 trades per day
H1 (1 hour) - Swing
ATR SL Multiplier: 2.2 - 2.5
Number of TPs: 5 - 6
Base RR: 0.8 - 1.0
Confirmation Bars: 3 - 4
Cooldown: 10 - 15 bars
Breakeven: Enable after TP2 or TP3
Profile: Swing trading, 1-3 trades per day
H4 (4 hours) - Position
ATR SL Multiplier: 2.5 - 3.0
Number of TPs: 6
Base RR: 1.0 - 1.2
Confirmation Bars: 4 - 5
Cooldown: 15 - 20 bars
Breakeven: Enable after TP3
Profile: Position trading, multi-day trades
🔍 Adaptation Logic
General Rule:
LOWER Timeframe → TIGHTER Parameters
HIGHER Timeframe → WIDER Parameters
Why Adapt?
1. ATR SL Multiplier
M1: Very volatile market, fast moves → Tight SL (1.5-1.8)
H4: Slow moves, breathing room needed → Wide SL (2.5-3.0)
2. Number of TPs
M1: Quick exits before reversal → 3-4 TPs
H4: Let profits run → 6 TPs
3. Base RR
M1: Close targets, quick exits → 0.4-0.5
H4: Ambitious targets, patience → 1.0-1.2
4. Confirmation Bars
M1: Fast entry, 2 candles enough
H4: Strong confirmation needed, 4-5 candles
5. Cooldown
M1: Multiple trades per hour possible → 3-5 bars
H4: Important spacing between trades → 15-20 bars
6. Breakeven
M1: Immediate protection after TP1
H4: Let trade breathe, BE after TP3
💡 Real Examples
Example 1: Gold M1 Scalping
Goal: 10-20 trades/day, ultra-fast exits
Recommended Parameters:
- ATR SL: 1.6
- TPs: 4
- Base RR: 0.5
- Confirmation: 2
- Cooldown: 5
- BE: ON after TP1
Expected Results:
- Winrate: 40-50%
- Net P/L: +3 to +6R per day
- SL: 10-15 pips
- TP1: 5-8 pips (quick exit)
Example 2: Gold M15 Day Trading
Goal: 3-6 trades/day, let it breathe
Recommended Parameters:
- ATR SL: 2.1
- TPs: 5
- Base RR: 0.7
- Confirmation: 3
- Cooldown: 10
- BE: ON after TP2
Expected Results:
- Winrate: 50-60%
- Net P/L: +5 to +10R per day
- SL: 20-30 pips
- TP1: 14-21 pips
Example 3: Gold H1 Swing Trading
Goal: 1-2 trades/day, maximum patience
Recommended Parameters:
- ATR SL: 2.4
- TPs: 6
- Base RR: 0.9
- Confirmation: 4
- Cooldown: 12
- BE: ON after TP2
Expected Results:
- Winrate: 55-65%
- Net P/L: +8 to +15R per week
- SL: 40-60 pips
- TP1: 36-54 pips
⚠️ Common Mistakes to Avoid
❌ MISTAKE #1: Using same parameters on all timeframes
M1 with ATR SL 2.5 → SL too wide, huge losses
H4 with ATR SL 1.5 → SL too tight, constant stop outs
❌ MISTAKE #2: Too many TPs on low timeframe
M1 with 6 TPs → Impossible to reach all TPs
❌ MISTAKE #3: Too long confirmation on M1
M1 with 5 confirmation bars → Misses all fast moves
❌ MISTAKE #4: Too short cooldown on H4
H4 with 3 bars cooldown → Overtrading, too many poor-quality trades
🎯 Testing Methodology
Step 1: Start with recommended values
Use the table above according to your timeframe
Step 2: Backtest on minimum 100 trades
Observe:
Winrate
Net P/L in R
Number of BE hits
Trade frequency
Step 3: Adjust based on results
If too many SL hits:
↑ Increase ATR SL Multiplier by +0.2
↑ Increase Confirmation Bars by +1
If not enough trades:
↓ Reduce Cooldown by -2
↓ Reduce Confirmation Bars by -1
If TPs never reached:
↓ Reduce Number of TPs by -1
↓ Reduce Base RR by -0.1
If too many BE but no real wins:
↑ Increase Base RR by +0.1
Disable BE temporarily
📈 Performance Tracking
Key indicators by timeframe:
TFTrades/DayMin WinrateNet P/L/DayAvg SL (pips)M110-2040%+3R10-15M55-1245%+4R15-20M153-850%+5R20-30H11-455%+3R40-60H40.5-260%+2R80-120
🚀 Final Advice
DO NOT USE THE SAME PARAMETERS ON DIFFERENT TIMEFRAMES!
Each timeframe has its own dynamics. Adapting parameters is not optional, it's MANDATORY for optimal results.
Different timeframe = Different parameters = Different results
Quick Reference Chart
M1 → AGGRESSIVE (tight SL, few TPs, quick BE)
M5 → BALANCED (default settings)
M15 → MODERATE (wider SL, more TPs)
H1 → PATIENT (wide SL, max TPs, late BE)
H4 → CONSERVATIVE (very wide SL, all TPs, very late BE)
📝 Best Practices
Always backtest on your specific timeframe before live trading
Start conservative - use higher ATR multipliers first
Track your stats - Wins, Losses, BE, Net P/L
Adjust gradually - change one parameter at a time
Respect your timeframe - don't force H4 parameters on M1
Use breakeven wisely - protect profits but don't choke trades
Monitor cooldown - too many trades = lower quality
🎓 Understanding the Strategy
EMA 9/21 Crossover
BUY: EMA9 crosses above EMA21
SELL: EMA9 crosses below EMA21
RSI Filter
Avoids overbought (>70) for longs
Avoids oversold (<30) for shorts
Confirmation System
Requires X consecutive candles meeting conditions
Reduces false signals
Take Profit Structure
Non-linear TP levels
TP1: 0.5R (default)
TP2: 1.0R
TP3: 1.5R
TP4: 2.0R
TP5: 2.5R
Risk Management
ATR-based stop loss (adapts to volatility)
Optional breakeven after specified TP
Cooldown prevents overtrading
🌟 Pro Tips
Gold (XAUUSD) specific: Use tighter parameters than forex pairs
NY Session: More volatility, tighter SL recommended
Asian Session: Lower volatility, consider skipping or wider SL
News events: Increase cooldown before/after major news
Trending markets: Increase Number of TPs
Ranging markets: Decrease Number of TPs, faster exits
Happy Trading! 🎯
Remember: Past performance does not guarantee future results. Always use proper risk management and never risk more than you can afford to lose.

Multitimeframe Stochastic RSIIndicator is Combining 4 different timeframe Stochastic RSI and show buy signal when all of them are oversold and sell signal when all of them are overbought.
Default settings are set up for 15 minute timeframe:
K1 - 15M (period = 14)
K2 - 30M (period = 28)
K3 - 1H (period = 56)
K4 - 2H (period = 112)
It indicates top and bottoms of given period.
Its good to use as a confirmation indicator.
Feel free to comment and use it.
Greetings!

Market Extreme Zones IndexThe Market Extreme Zones Index is a new mean reversion (valuation) tool focused on catching long term oversold/overbought zones. Combining an enhanced RSI with a smoothed Z-score this indicator allows traders to find oppurtunities during highly oversold/overbought zones.
I will separate the explanation into the following parts:
1. How does it work?
2. Methodologies & Concepts
3. Use cases
How does it work?
The indicator attempts to catch highly unprobable events in either direction to capture reversal points over the long term. This is done by calculating the Z-Score of an enhanced RSI.
First we need to calculate the Enhanced RSI:
For this we need to calculate 2 additional lengths:
Length1 = user defined length
Length2 = Length1/2
Length3 = √Length
Now we need to calculate 3 different RSIs:
1st RSI => uses classic user defined source and classic user defined length.
2nd RSI => uses classic user defined source and Length 2.
3rd RSI => uses RSI 2 as source and Length 2
Now calculate the divergence:
RSI_base => 2nd RSI * 3 - 1st RSI - 3rd RSI
After this we need to calculate the median of the RSI_base over √Length and make a divergence of these 2:
RSI => RSI_base*2 - median
All that remains now is the Z-score calculations:
We need:
Average RSI value
Standard Deviation = a measure of how dispersed or spread out a set of data values are from their average
Z-score = (Current Value - Average Value) / Standard Deviation
After this we just smooth the Z-score with a Weighted Moving average with √Length
Methodology & Concepts
Mean Reversion Methodology:
The methodology behind mean reversion is the theory that asset prices will eventually return to their long-term average after deviating significantly, driven by the belief that extreme moves are temporary.
Z-Score Methodology:
A Z-score, or standard score, is a statistical measure that indicates how many standard deviations a data point is from the mean of a dataset. A positive z-score means the value is above the mean, a negative score means it's below, and a score of zero means the value is equal to the mean.
You might already be able to see where I am going with this:
Z-Score could be used for the extreme moves to capture reversal points.
By applying it to the RSI rather than the Price, we get a more accurate measurement that allow us to get a banger indicator.
Use Cases
Capturing reversal points
Trend Direction
- while the main use it for mean reversion, the values can indicate whether we are in an uptrend or a downtrend.
Advantages:
Visualization:
The indicator has many plots to ensure users can easily see what the indicator signals, such as highlighting extreme conditions with background colors.
Versatility:
This indicator works across multiple assets, including the S&P500 and more, so it is not only for crypto.
Final note:
No indicator alone is perfect.
Backtests are not indicative of future performance.
Hope you enjoy Gs!
Good luck!

Swing Trade BUY/SELL + SCORING +COLOUR FIXBUY/SELL labels now appear with a score (1–3) next to them.
Color coding visually distinguishes signal strength:
BUY → 1 yellow, 2 light green, 3 dark green
SELL → 1 orange, 2 red, 3 burgundy
This allows you to instantly see the signal strength both numerically and visually.

Swing Trade AL/SAT + Güç Derecesi_huğurlu
Weak signal → MACD crossover only.
Moderate signal → MACD crossover + RSI confirmation.
Strong signal → MACD crossover + RSI + Stoch RSI confirmation.
BUY/SELL labels appear on the chart in different colors and sizes.
This way, you can instantly see which signal is more reliable.
Zayıf sinyal → sadece MACD kesişim var
Orta sinyal → MACD kesişim + RSI teyidi.
Güçlü sinyal → MACD kesişim + RSI + Stoch RSI teyidi.

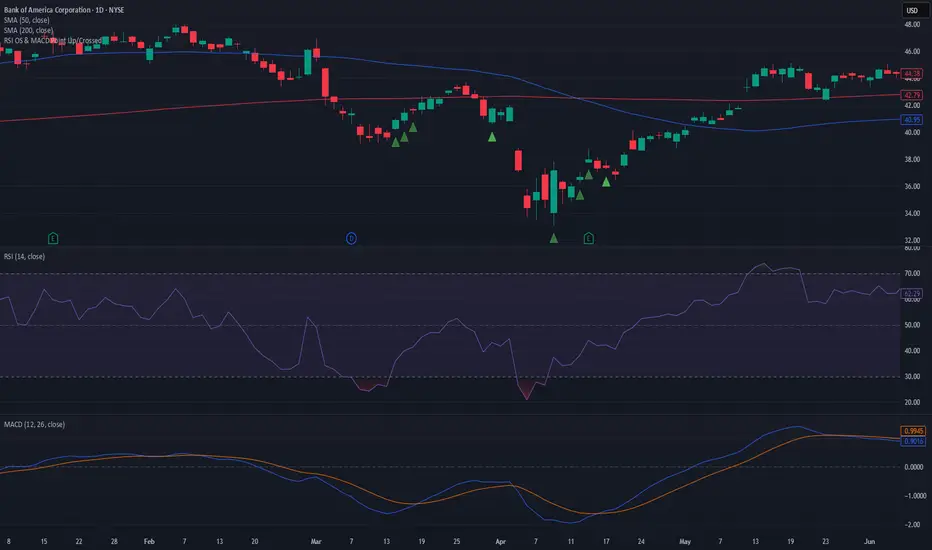
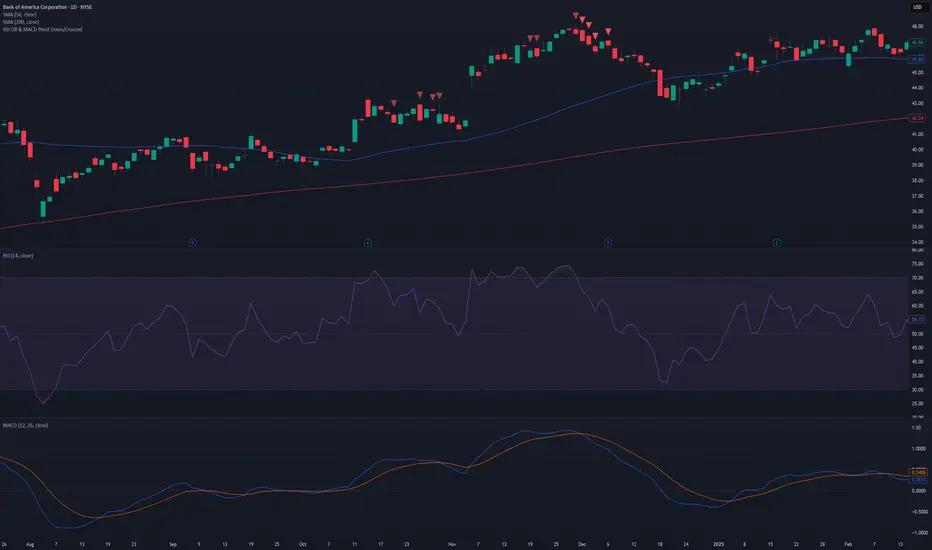
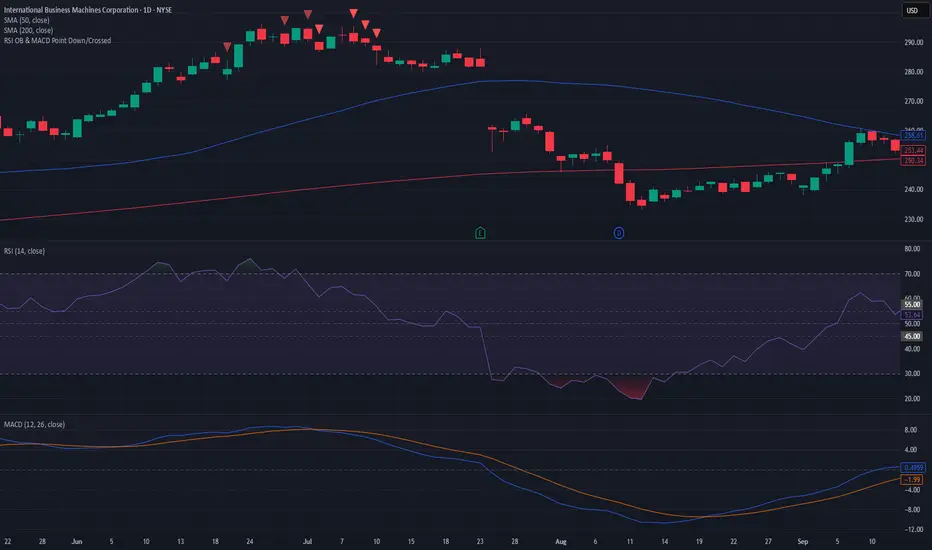
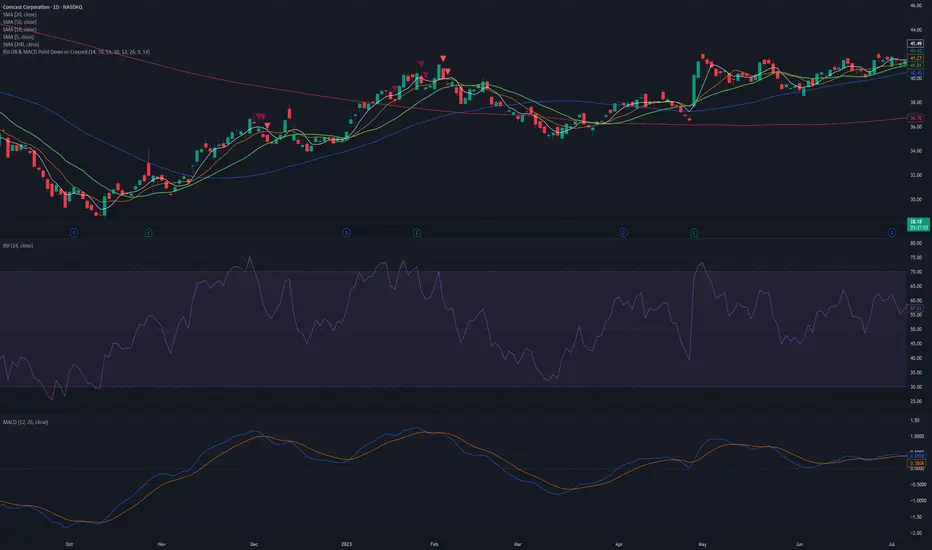
RSI OB & MACD Point Down or Crossed - PSPine script screener indicator for RSI OB and MACD point down or cross.

Hidden Bullish Divergence - B166erThis script will paint a line on the chart when hidden bullish divergence is occurring.