Trend Finder - Buy/Sell (Anuj Edition)Renko Trend Finder – Anuj Edition is a powerful trend-following tool designed to detect market direction using Renko logic instead of traditional candlesticks.
Renko filtering removes market noise, making trends clearer and reversals easier to identify.
This indicator internally builds Renko-style price movement and generates clean, high-quality Buy and Sell signals without repainting.
Renko

Renko ScalperWhat it is-
A lightweight Renko Scalper that combines Renko brick direction with an internal EMA trend filter and MACD confirmation to signal high-probability short-term entries. EMAs are used internally (hidden from the chart) so the visual remains uncluttered.
Signals-
Buy arrow: Renko direction turns bullish AND EMA trend up AND MACD histogram positive.
Sell arrow: Renko direction turns bearish AND EMA trend down AND MACD histogram negative.
Consecutive same-direction signals are suppressed (only one arrow per direction until opposite signal).
Visuals-
Buy / Sell arrows (large) above/below bars.
Chart background tints green/red after the respective signal for easy glance recognition.
Inputs:-
Renko Box Size (points)
EMA Fast / EMA Slow
MACD fast/slow/signal lengths
How to use-
Add to chart
Use smaller Renko box sizes for scalping, larger for swing-like entries.
Confirm signal with price action and volume—this indicator is a signal generator, not a full automated system.
Use alerts (built in) to receive Buy / Sell arrow notifications.
Alerts-
Buy Arrow — buySignal
Sell Arrow — sellSignal
Buy Background / Sell Background — background-color state alerts
Recommended settings-
Timeframes: 1m–15m for scalping, 5m for balanced intraday.
Symbols: liquid futures/currency pairs/major crypto.
Disclaimer
This script is educational and not financial advice. Backtest and forward test on a demo account before live use. Past performance is not indicative of future results. Use proper risk management.

Superior-Range Bound Renko - Alerts - 11-29-25 - Signal LynxSuperior-Range Bound Renko – Alerts Edition with Advanced Risk Management Template
Signal Lynx | Free Scripts supporting Automation for the Night-Shift Nation 🌙
1. Overview
This is the Alerts & Indicator Edition of Superior-Range Bound Renko (RBR).
The Strategy version is built for backtesting inside TradingView.
This Alerts version is built for automation: it emits clean, discrete alert events that you can route into webhooks, bots, or relay engines (including your own Signal Lynx-style infrastructure).
Under the hood, this script contains the same core engine as the strategy:
Adaptive Range Bounding based on volatility
Renko Brick Emulation on standard candles
A stack of Laguerre Filters for impulse detection
K-Means-style Adaptive SuperTrend for trend confirmation
The full Signal Lynx Risk Management Engine (state machine, layered exits, AATS, RSIS, etc.)
The difference is in what we output:
Instead of placing historical trades, this version:
Plots the entry and RM signals in a separate pane (overlay = false)
Exposes alertconditions for:
Long Entry
Short Entry
Close Long
Close Short
TP1, TP2, TP3 hits (Staged Take Profit)
This makes it ideal as the signal source for automated execution via TradingView Alerts + Webhooks.
2. Quick Action Guide (TL;DR)
Best Timeframe:
4H and above. This is a swing-trading / position-trading style engine, not a micro-scalper.
Best Assets:
Volatile but structured markets, e.g.:
BTC, ETH, XAUUSD (Gold), GBPJPY, and similar high-volatility majors or indices.
Script Type:
indicator() – Alerts & Visualization Only
No built-in order placement
All “orders” are emitted as alerts for your external bot or manual handling
Strategy Type:
Volatility-Adaptive Trend Following + Impulse Detection
using Renko-like structure and multi-layer Laguerre filters.
Repainting:
Designed to be non-repainting on closed candles.
The underlying Risk Management engine is built around previous-bar data (close , high , low ) for execution-critical logic.
Intrabar values can move while the bar is forming (normal for any advanced signal), but once a bar closes, the alert logic is stable.
Recommended Alert Settings:
Condition: one of the built-in signals (see section 3.B)
Options: “Once Per Bar Close” is strongly recommended for automation
Message: JSON, CSV, or simple tokens – whatever your webhook / relay expects
3. Detailed Report: How the Alerts Edition Works
A. Relationship to the Strategy Version
The Alerts Edition shares the same internal logic as the strategy version:
Same Adaptive Lookback and volatility normalization
Same Range and Close Range construction
Same Renko Brick Emulator and directional memory (renkoDir)
Same Fib structures, Laguerre stack, K-Means SuperTrend, and Baseline signals (B1, B2)
Same Risk Management Engine and layered exits
In the strategy script, these signals are wired into strategy.entry, strategy.exit, and strategy.close.
In the alerts script:
We still compute the final entry/exit signals (Fin, CloseEmAll, TakeProfit1Plot, etc.)
Instead of placing trades, we:
Plot them for visual inspection
Expose them via alertcondition(...) so that TradingView can fire alerts.
This ensures that:
If you use the same settings on the same symbol/timeframe, the Alerts Edition and Strategy Edition agree on where entries and exits occur.
(Subject only to normal intrabar vs. bar-close differences.)
B. Signals & Alert Conditions
The alerts script focuses on discrete, automation-friendly events.
Internally, the main signals are:
Fin – Final entry decision from the RM engine
CloseEmAll – RM-driven “hard close” signal (for full-position exits)
TakeProfit1Plot / 2Plot / 3Plot – One-time event markers when each TP stage is hit
On the chart (in the separate indicator pane), you get:
plot(Fin) – where:
+2 = Long Entry event
-2 = Short Entry event
plot(CloseEmAll) – where:
+1 = “Close Long” event
-1 = “Close Short” event
plot(TP1/TP2/TP3) (if Staged TP is enabled) – integer tags for TP hits:
+1 / +2 / +3 = TP1 / TP2 / TP3 for Longs
-1 / -2 / -3 = TP1 / TP2 / TP3 for Shorts
The corresponding alertconditions are:
Long Entry
alertcondition(Fin == 2, title="Long Entry", message="Long Entry Triggered")
Fire this to open/scale a long position in your bot.
Short Entry
alertcondition(Fin == -2, title="Short Entry", message="Short Entry Triggered")
Fire this to open/scale a short position.
Close Long
alertcondition(CloseEmAll == 1, title="Close Long", message="Close Long Triggered")
Fire this to fully exit a long position.
Close Short
alertcondition(CloseEmAll == -1, title="Close Short", message="Close Short Triggered")
Fire this to fully exit a short position.
TP 1 Hit
alertcondition(TakeProfit1Plot != 0, title="TP 1 Hit", message="TP 1 Level Reached")
First staged take profit hit (either long or short). Your bot can interpret the direction based on position state or message tags.
TP 2 Hit
alertcondition(TakeProfit2Plot != 0, title="TP 2 Hit", message="TP 2 Level Reached")
TP 3 Hit
alertcondition(TakeProfit3Plot != 0, title="TP 3 Hit", message="TP 3 Level Reached")
Together, these give you a complete trade lifecycle:
Open Long / Short
Optionally scale out via TP1/TP2/TP3
Close remaining via Close Long / Close Short
All while the Risk Management Engine enforces the same logic as the strategy version.
C. Using This Script for Automation
This Alerts Edition is designed for:
Webhook-based bots
Execution relays (e.g., your own Lynx-Relay-style engine)
Dedicated external trade managers
Typical setup flow:
Add the script to your chart
Same symbol, timeframe, and settings you use in the Strategy Edition backtests.
Configure Inputs:
Longs / Shorts enabled
Risk Management toggles (SL, TS, Staged TP, AATS, RSIS)
Weekend filter (if you do not want weekend trades)
RBR-specific knobs (Adaptive Lookback, Brick type, ATR vs Standard Brick, etc.)
Create Alerts for Each Event Type You Need:
Long Entry
Short Entry
Close Long
Close Short
TP1 / TP2 / TP3 (optional, if your bot handles partial closes)
For each:
Condition: the corresponding alertcondition
Option: “Once Per Bar Close” is strongly recommended
Message:
You can use structured JSON or a simple token set like:
{"side":"long","event":"entry","symbol":"{{ticker}}","time":"{{timenow}}"}
or a simpler text for manual trading like:
LONG ENTRY | {{ticker}} | {{interval}}
Wire Up Your Bot / Relay:
Point TradingView’s webhook URL to your execution engine
Parse the messages and map them into:
Exchange
Symbol
Side (long/short)
Action (open/close/partial)
Size and risk model (this script does not position-size for you; it only signals when, not how much.)
Because the alerts come from a non-repainting, RM-backed engine that you’ve already validated via the Strategy Edition, you get a much cleaner automation pipeline.
D. Repainting Protection (Alerts Edition)
The same protections as the Strategy Edition apply here:
Execution-critical logic (trailing stop, TP triggers, SL, RM state changes) uses previous bar OHLC:
open , high , low , close
No security() with lookahead or future-bar dependencies.
This means:
Alerts are designed to fire on states that would have been visible at bar close, not on hypothetical “future history.”
Important practical note:
Intrabar: While a bar is forming, internal conditions can oscillate.
Bar Close: With “Once Per Bar Close” alerts, the fired signal corresponds to the final state of the engine for that candle, matching your Strategy Edition expectations.
4. For Developers & Modders
You can treat this Alerts script as an ”RM + Alert Framework” and inject any signal logic you want.
Where to plug in:
Find the section:
// BASELINE & SIGNAL GENERATION
You’ll see how B1 and B2 are built from the RBR stack and then combined:
baseSig = B2
altSig = B1
finalSig = sigSwap ? baseSig : altSig
To use your own logic:
Replace or wrap the code that sets baseSig / altSig with your own conditions:
e.g., RSI, MACD, Heikin Ashi filters, candle patterns, volume filters, etc.
Make sure your final decision is still:
2 → Long / Buy signal
-2 → Short / Sell signal
0 → No trade
finalSig is then passed into the RM engine and eventually becomes Fin, which:
Drives the Long/Short Entry alerts
Interacts with the RM state machine to integrate properly with AATS, SL, TS, TP, etc.
Because this script already exposes alertconditions for key lifecycle events, you don’t need to re-wire alerts each time — just ensure your logic feeds into finalSig correctly.
This lets you use the Signal Lynx Risk Management Engine + Alerts wrapper as a drop-in chassis for your own strategies.
5. About Signal Lynx
Automation for the Night-Shift Nation 🌙
Signal Lynx builds tools and templates that help traders move from:
“I have an indicator” → “I have a structured, automatable strategy with real risk management.”
This Superior-Range Bound Renko – Alerts Edition is the automation-focused companion to the Strategy Edition. It’s designed for:
Traders who backtest with the Strategy version
Then deploy live signals with this Alerts version via webhooks or bots
While relying on the same non-repainting, RM-driven logic
We release this code under the Mozilla Public License 2.0 (MPL-2.0) to support the Pine community with:
Transparent, inspectable logic
A reusable Risk Management template
A reference implementation of advanced adaptive logic + alerts
If you are exploring full-stack automation (TradingView → Webhooks → Exchange / VPS), keep Signal Lynx in your search.
License: Mozilla Public License 2.0 (Open Source).
If you build improvements or helpful variants, please consider sharing them back with the community.

Renko Open Range delta
Delta Renko-Style Indicator Guide (NQ Focus)
This indicator takes inspiration from the Renko Chart concept and is optimized for the RTH session (New York time zone), specifically applied to the Nasdaq futures (NQ) product.
If you’re unfamiliar with Renko charts, it may help to review their basics first, as this indicator borrows their clean, block-based perspective to simplify price interpretation.
⸻
🔧 How the Indicator Works
• At market open (9:30 AM EST), the indicator plots a horizontal open price line, referred to as 0 delta.
• From this anchor, it plots 10 incremental levels (deltas) both above and below the open, each spaced by 62.5 NQ points.
Why 62.5?
• With NQ currently trading in the 23,000–24,000 range, a 62.5-point move represents roughly 0.26% of the daily average range.
• This makes each delta step significant enough to capture movement while filtering out smaller noise.
A mini table (location adjustable) displays:
• Current delta zone
• Last touched delta level
This gives you a quick snapshot of where price sits relative to the open.
⸻
📈 How to Read the Market
• At the open, price typically oscillates between 0 and +1 / -1 delta.
• A break beyond this zone often signals stronger directional intent:
• Trending day: price can push into +2, +3, +4, +5 (or the inverse for downside).
• Range day: expect price to bounce between +1, 0, -1 deltas.
⚠️ Note: This is a visualization tool, not a trading system. Its purpose is to help you quickly recognize range vs. trend conditions.
⸻
📊 Example
• In this case, NQ reached +1 delta shortly after open.
• A retest of 0 delta followed, and price later surged to +5/+6 deltas (helped by Fed news).
⸻
🛠️ Practical Uses
This indicator can help you:
• Define profit targets
• Place hard stop levels
• Gauge whether a counter-trend trade is worth the risk
⚠️ Caution: Avoid counter-trend trades if price is aggressively pushing toward +5/+6 or -5/-6 deltas, as trend exhaustion usually hasn’t set in yet.
⸻
🔄 Adapting for ES (S&P Futures)
• On NQ, 62.5 points ≈ $1,250 per contract.
• For ES, this translates to 25 points.
• Since 1 NQ contract ≈ 2 ES contracts in dollar terms, an optimized ES delta step would be 12.5 points.
You may also experiment with different delta values (e.g., 50 or 31.25 for NQ) to align with your risk profile and trading style.
⸻
🧪 Extending Beyond NQ
You can experiment with applying this indicator to ES or even stocks, but non-futures assets may require additional calibration and testing.
⸻
✅ Bottom line: This tool provides a clean, Renko-inspired framework for quickly gauging trend vs. range conditions, setting realistic profit targets, and avoiding poor counter-trend setups.

Universal Renko Bars by SiddWolfUniversal Renko Bars or UniRenko Bars is an overlay indicator that applies the logic of Renko charting directly onto a standard candlestick chart. It generates a sequence of price-driven bricks, where each new brick is formed only when the price moves a specific amount, regardless of time. This provides a clean, price-action-focused visualization of the market's trend.
WHAT IS UNIVERSAL RENKO BARS?
For years, traders have faced a stark choice: the clean, noise-free world of Renko charts, or the rich, time-based context of Candlesticks. Choosing Renko meant giving up your favorite moving averages, volume profiles, and the fundamental sense of time. Choosing Candlesticks meant enduring the market noise that often clouds true price action.
But what if you didn't have to choose?
Universal Renko Bars is a revolutionary indicator that ends this dilemma. It's not just another charting tool; it's a powerful synthesis that overlays the pure, price-driven logic of Renko bricks directly onto your standard candlestick chart. This hybrid approach gives you the best of both worlds:
❖ The Clarity of Renko: By filtering out the insignificant noise of time, Universal Renko reveals the underlying trend with unparalleled clarity. Up trends are clean successions of green bricks; down trends are clear red bricks. No more guesswork.
❖ The Context of Candlesticks: Because the Renko logic is an overlay, you retain your time axis, your volume data, and full compatibility with every other time-based indicator in your arsenal (RSI, MACD, Moving Averages, etc.).
The true magic, however, lies in its live, Unconfirmed Renko brick. This semi-transparent box is your window into the current bar's real-time struggle. It grows, shrinks, and changes color with every tick, showing you exactly how close the price is to confirming the trend or forcing a reversal. It’s no longer a lagging indicator; it’s a live look at the current battle between buyers and sellers.
Universal Renko Bars unifies these two powerful charting methods, transforming your chart into a more intelligent, noise-free, and predictive analytical canvas.
HOW TO USE
To get the most out of Universal Renko Bars, here are a few tips and a full breakdown of the settings.
Initial Setup for the Best Experience
For the cleanest possible view, it's highly recommended that you hide the body of your standard candlesticks, that shows only the skelton of the candle. This allows the Renko bricks to become the primary focus of your chart.
→ Double click on the candles and uncheck the body checkbox.
Settings Breakdown
The indicator is designed to be powerful yet intuitive. The settings are grouped to make customization easy.
First, What is a "Tick"?
Before we dive in, it's important to understand the concept of a "Tick." In Universal Renko, a Tick is not the same as a market tick. It's a fundamental unit of price movement that you define. For example, if you set the Tick Size to $0.50, then a price move of $1.00 is equal to 2 Ticks. This is the core building block for all Renko bricks. Tick size here is dynamically determined by the settings provided in the indicator.
❖ Calculation Method (The "Tick Size" Engine)
This section determines the monetary value of a single "Tick."
`Calculation Method` : Choose your preferred engine for defining the Tick Size.
`ATR Based` (Default): The Tick Size becomes dynamic, based on market volatility (Average True Range). Bricks will get larger in volatile markets and smaller in quiet ones. Use the `ATR 14 Multiplier` to control the sensitivity.
`Percentage` : The Tick Size is a simple percentage of the current asset price, controlled by the `Percent Size (%)` input.
`Auto` : The "set it and forget it" mode. The script intelligently calculates a Tick Size based on the asset's price. Use the `Auto Sensitivity` slider to make these automatically calculated bricks thicker (value > 1.0) or thinner (value < 1.0).
❖ Parameters (The Core Renko Engine)
This group controls how the bricks are constructed based on the Tick Size.
`Tick Trend` : The number of "Ticks" the price must move in the same direction to print a new continuation brick. A smaller value means bricks form more easily.
`Tick Reversal` : The number of "Ticks" the price must move in the opposite direction to print a new reversal brick. This is typically set higher than `Tick Trend` (e.g., double) to filter out minor pullbacks and market noise.
`Open Offset` : Controls the visual overlap of the bricks. A value of `0` creates gapless bricks that start where the last one ended. A value of `2` (with a `Tick Reversal` of 4) creates the classic 50% overlap look.
❖ Visuals (Controlling What You See)
This is where you tailor the chart to your visual preference.
`Show Confirmed Renko` : Toggles the solid-colored, historical bricks. These are finalized and will never change. They represent the confirmed past trend.
`Show Unconfirmed Renko` : This is the most powerful visual feature. It toggles the live, semi-transparent box that represents the developing brick. It shows you exactly where the price is right now in relation to the levels needed to form the next brick.
`Show Max/Min Levels` : Toggles the horizontal "finish lines" on your chart. The green line is the price target for a bullish brick, and the red line is the target for a bearish brick. These are excellent for spotting breakouts.
`Show Info Label` : Toggles the on-chart label that provides key real-time stats:
🧱 Bricks: The total count of confirmed bricks.
⏳ Live: How many chart bars the current live brick has been forming. These bars forms the Renko bricks that aren't confirmed yet. Live = 0 means the latest renko brick is confirmed.
🌲 Tick Size: The current calculated value of a single Tick.
Hover over the label for a tooltip with live RSI(14), MFI(14), and CCI(20) data for additional confirmation.
TRADING STRATEGIES & IDEAS
Universal Renko Bars isn't just a visual tool; it's a foundation for building robust trading strategies.
Trend Confirmation: The primary use is to instantly identify the trend. A series of green bricks indicates a strong uptrend; a series of red bricks indicates a strong downtrend. Use this to filter out trades that go against the primary momentum.
Reversal Spotting: Pay close attention to the Unconfirmed Brick . When a strong trend is in place and the live brick starts to fight against it—changing color and growing larger—it can be an early warning that a reversal is imminent. Wait for the brick to be confirmed for a higher probability entry.
Breakout Trading: The `Max/Min Levels` are your dynamic breakout zones. A long entry can be considered when the price breaks and closes above the green Max Level, confirming a new bullish brick. A short entry can be taken when price breaks below the red Min Level.
Confluence & Indicator Synergy: This is where Universal Renko truly shines. Overlay a moving average (e.g., 20 EMA). Only take long trades when the green bricks are forming above the EMA. Combine it with RSI or MACD; a bearish reversal brick forming while the RSI shows bearish divergence is a very powerful signal.
A FINAL WORD
Universal Renko Bars was designed to solve a fundamental problem in technical analysis. It brings together the best elements of two powerful methodologies to give you a clearer, more actionable view of the market. By filtering noise while retaining context, it empowers you to make decisions with greater confidence.
Add Universal Renko Bars to your chart today and elevate your analysis. We welcome your feedback and suggestions for future updates!
Follow me to get notified when I publish New Indicator.
~ SiddWolf

MestreDoFOMO RENKO Sushy System v6🔍 What is this script?
The MestreDoFOMO RENKO Sushy System is a visual tool developed to help traders better interpret the market trend based on a Renko logic adapted to traditional candlestick charts.
It does not use TradingView's native Renko chart, but rather a simulation of Renko behavior, calculated dynamically in real time, adapting to the percentage movement of the price.
🧠 How does it work?
The script uses a Renko simulation with an adjustable percentage base (Renko Size), allowing the trader to define the size of the virtual "blocks" or "bricks" in % of the price. This logic creates a dynamic trend line that changes direction only when there is a sufficient variation in the price — filtering out noise and helping to focus on the prevailing direction.
When a change in direction occurs, a visual signal is displayed on the chart:
💲 Buy signal, when the trend changes from bearish to bullish
👹 Sell signal, when the trend changes from bullish to bearish
These signals are not automatic trading alerts, but rather visual periodic signals based on the internal logic of the system.
📈 Why do we include EMAs (20, 50 and 200)?
Exponential moving averages (EMAs) are widely used in technical analysis as supporting tools for understanding market structure:
EMA 20: A short-term indicator, useful for capturing recent movements.
EMA 50: Considered an interactive trend average, often used as dynamic support/resistance.
EMA 200: A long-term reference, often used to identify the "bigger direction" of the market.
EMAs are indicated in the script and can be enabled or disabled according to the user's preference. They are not part of the signal logic — they serve only as visual and contextual support to assist the trader's manual analysis.
📋 Included features
✅ Renko logic adapted to the candlestick chart, with sensitivity control in %
✅ Trend line based on the current Renko direction
✅ Visual signals of trend change (buy/sell)
✅ Option to enable/disable EMAs 20, 50 and 200
✅ Information panel with trend status, EMA values and current parameters
✅ Customizable trend change alerts
✅ Background color to strengthen the direction (green = high, red = low)
🛠 How to use?
Choose the timeframe: Works best on timeframes longer than 1 hour (e.g. 1H, 4H, Daily).
Adjust the Renko size (%): Try starting with 1% and adjusting according to the asset (crypto, forex, etc.).
Decide whether to use EMAs: Only activate if you want additional context.
Observe the signals and the trend line: They are useful for detecting possible reversals or confirmations of movement.
Combine with other elements: This system is a support tool. For best results, use it in conjunction with price action, liquidity zones or other complementary indicators.
⚠️ Important notice
This script does not execute orders or make automatic decisions. It is an educational and visual tool created to help read the trend in a clean and simple way.
No guarantee of past or future performance is provided. Use is at the sole risk of the user.

[RenkoCore] PublicWhen it comes the Renko chart, we all know it has its advantages & disadvantages compared to the candle-stick chart. My aim of this was to alleviate some of the disadvantages by providing some sort of structure on Renko chart. These set of tools may hopefully help your trading journey on Renko chart.
Helpful tips:
a) Enable wicks on your Renko settings, this indicator needs wicks to work.
b) Choose correct size (I recommend traditional size option) for your Renko chart as well as for your instrument.
c) Keep it on 1-second time frame, anything other than that doesn't work on TradingView's Renko. This is important as price will not repaint.
d) If you want to see bigger picture (like 4hr/daily on candle-stick chart), just increase your Renko size, but still keep it on 1-second timeframe.
This toolset includes couple different methods to provide some structures as explained below:
1. 📌 Balance | Price Action Equilibrium Zones
Overview
The Balance is a visual framework designed to evaluate directional bias and internal structure in price action. It measures net bullish/bearish momentum within a configurable rolling window, while highlighting key structural turning points based on multiple custom sensitivity levels. This tool helps traders stay in sync with market rhythm by emphasizing balance, imbalance, and inflection zones.
🔧 How It Works:
Inflection Tiers
Three customizable rounds of pivot-based divergence detection—labeled as 1°, 2°, and 3°—automatically identify regular bullish and regular bearish pivot structures. Though may not be always accurate, these structural signals are intended to keep user's focus to continually reflect emerging internal market shifts.
Balance Limit
Monitors directional bar disparity within a customizable retrospective span. When the net balance exceeds ±50% of the range, the line turns green to suggest strong directional bias. A red fill zone between these thresholds indicates equilibrium or no-trade conditions.
Volatility Based Reversal (Candle Reversal Detector)
This tool scans for extreme price movements relative to local volatility baselines, helping traders detect possible tops and bottoms before major price reversals or pauses. Compares current price action to the lowest recent volatility anchor or if price sharply dips below the highest recent volatility anchor.
🧠 Use Case Recommendations:
Discretionary trading to visually confirm balance and momentum shifts.
Confluence strategies, combining the balance counter with trend indicators or support/resistance levels.
Structure mapping, to highlight exhaustion zones or emerging reversals based on internal divergences.
Avoid using this tool in isolation. It is most effective when combined with broader market context or other confirmation layers.
2. 📌 Primary Level Detection
Overview
This is a precision tool for detecting dynamic price zones where significant market reversals may begin. Using a blend of momentum, price tension, and volatility structure, it identifies potential top and bottom areas — and tracks them with adaptive channel levels that evolve in real time.
🔧 How It Works:
Combines price action, RSI-based bias, and volatility deviation to identify moments when price is overextended.
Reacts only to major changes — reducing false positives in choppy markets.
Levels persist on the chart until a new valid reversal is confirmed, giving you visual structure and actionable areas to work with.
🧠 Use Case Recommendations:
Trading reversals, reversion-to-mean, or liquidity sweeps
Confirming entries from other indicators (like divergence, order blocks, or support/resistance)
Analyzing volatile markets where rapid direction changes are common (e.g., crypto, futures, scalping)
3. 📌 Secondary Level Detection
Overview
This tool highlights where price may be overextended and due for a short-term reversal, based on recent price structure.
🔧 How It Works:
It uses dynamic bar-count and swing conditions to identify potential price turning points after extended directional moves or strong sequence of bars in same direction.
Levels persist on the chart until a new valid reversal is confirmed, giving you visual structure and actionable areas to work with.
🧠 Use Case Recommendations:
Trading reversals, reversion-to-mean, or liquidity sweeps
Confirming entries from other indicators (like divergence, order blocks, or support/resistance)
⚠️ Important Notes:
This indicator does not repaint. All pivots and plots are based on closed candles and verified conditions.
This tool does not provide trade signals. It is a structural analysis tool intended to assist in discretionary decision-making. This indicator is for informational and educational purposes only. Use in combination with your own trading strategy, risk management, and market context. The signals generated do not guarantee outcomes and should not be used in isolation.
It is not intended to be financial advice or a recommendation to buy or sell any security or asset. Trading involves risk. Always do your own research and consult with a licensed financial advisor before making any trading decisions. Past performance is not indicative of future results.
The author is not responsible for any losses incurred from the use of this script.

MestreDoFOMO MACD VisualMasterDoFOMO MACD Visual
Description
MasterDoFOMO MACD Visual is a custom indicator that combines a unique approach to MACD with stochastic logic and simulated Renko-based direction signals. It is designed to help traders identify entry and exit opportunities based on market momentum and trend changes, with a clear and intuitive visualization.
How It Works
Stylized MACD with Stochastic: The indicator calculates the MACD using EMAs (exponential moving averages) normalized by stochastic logic. This is done by subtracting the lowest price (lowest low) from a defined period and dividing by the range between the highest and lowest price (highest high - lowest low). The result is a MACD that is more sensitive to market conditions, magnified by a factor of 10 for better visualization.
Signal Line: An EMA of the MACD is plotted as a signal line, allowing you to identify crossovers that indicate potential trend reversals or continuations.
Histogram: The difference between the MACD and the signal line is displayed as a histogram, with distinct colors (fuchsia for positive, purple for negative) to make momentum easier to read.
Simulated Renko Direction: Uses ATR (Average True Range) to calculate the size of Renko "bricks", generating signals of change in direction (bullish or bearish). These signals are displayed as arrows on the chart, helping to identify trend reversals.
Purpose
The indicator combines the sensitivity of the Stochastic MACD with the robustness of Renko signals to provide a versatile tool. It is ideal for traders looking to capture momentum-based market movements (using the MACD and histogram) while confirming trend changes with Renko signals. This combination reduces false signals and improves accuracy in volatile markets.
Settings
Stochastic Period (45): Sets the period for calculating the Stochastic range (highest high - lowest low).
Fast EMA Period (12): Period of the fast EMA used in the MACD.
Slow EMA Period (26): Period of the slow EMA used in the MACD.
Signal Line Period (9): Period of the EMA of the signal line.
Overbought/Oversold Levels (1.0/-1.0): Thresholds for identifying extreme conditions in the MACD.
ATR Period (14): Period for calculating the Renko brick size.
ATR Multiplier (1.0): Adjusts the Renko brick size.
Show Histogram: Enables/disables the histogram.
Show Renko Markers: Enables/disables the Renko direction arrows.
How to Use
MACD Crossovers: A MACD crossover above the signal line indicates potential bullishness, while below suggests bearishness.
Histogram: Fuchsia bars indicate bullish momentum; purple bars indicate bearish momentum.
Renko Arrows: Green arrows (upward triangle) signal a change to an uptrend; red arrows (downward triangle) signal a downtrend.
Overbought/Oversold Levels: Use the levels to identify potential reversals when the MACD reaches extreme values.
Notes
The chart should be set up with this indicator in isolation for better clarity.
Adjust the periods and ATR multiplier according to the asset and timeframe used.
Use the built-in alerts ("Renko Up Signal" and "Renko Down Signal") to set up notifications of direction changes.
This indicator is ideal for day traders and swing traders who want a visually clear and functional tool for trading based on momentum and trends.

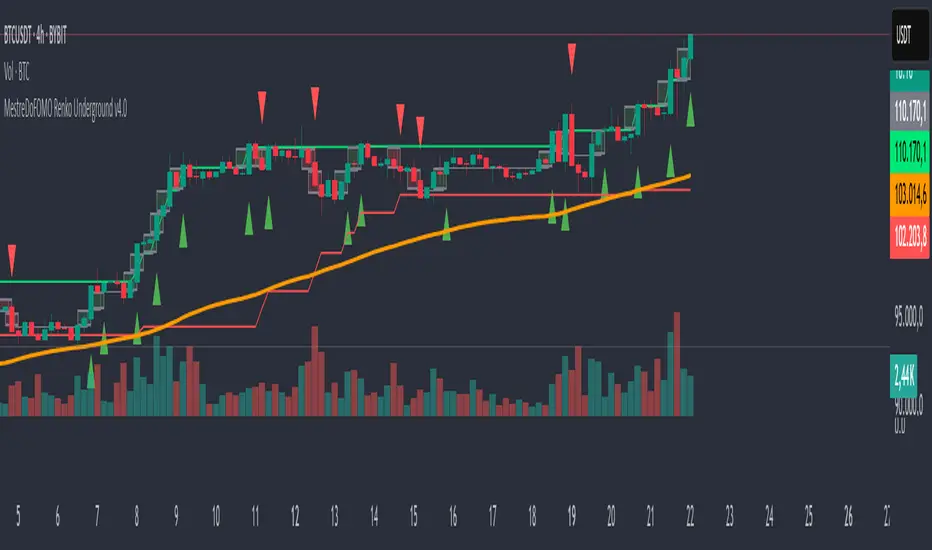
MestreDoFOMO Renko Underground v4.0Description:
The "MestreDoFOMO Renko Underground v4.0" is a custom indicator for TradingView that creates a dynamic Renko chart to help identify trends and reversal points in the market. Unlike traditional candlestick charts, Renko focuses solely on significant price movements, ignoring time and market noise. This script includes advanced features like support and resistance channels, moving averages, and alerts to assist with your trading decisions.
How It Works:
Dynamic Renko Bricks:
The brick size (price units to form each "box" on the chart) is calculated automatically using the ATR (Average True Range) with an adjustable multiplier. This means the size adapts to the asset's volatility (e.g., BTC/USDT). When the price moves up or down by the brick size, a new brick is created (green for up, red for down).
Reversal Signals:
Green triangles (🔼) appear below bars when the trend shifts to bullish, and red triangles (🔽) appear above when it shifts to bearish. These signals only appear on direction changes, reducing false signals.
Renko Channel:
The script draws two lines (green for resistance and red for support) based on the highs and lows of the last 10 bricks (or the value you set). This helps identify key price zones.
Moving Average on Bricks:
An orange line shows the moving average (EMA or SMA, your choice) of the last 20 bricks, helping confirm the overall trend.
Alerts:
You can set up alerts in TradingView to be notified when the trend shifts to bullish or bearish, perfect for active trading.
Visualization:
A gray dashed line shows the level of the last brick, providing a clear reference for the next expected move.
How to Use:
Add the indicator to your chart (e.g., BTC/USDT 1D).
Adjust parameters like the ATR multiplier, channel length, and moving average type in the settings menu.
Watch the bricks and signals to identify trends, and use the channels and moving average to plan entries and exits.
Enable alerts to receive real-time notifications.
Tip:
Test on different timeframes (1H, 4H, 1D) and adjust the ATR multiplier to match the volatility of the asset you're trading. Combine with other indicators (like RSI) for better results!
HKM - Renko Emulator with EMA TrendThis is a Renko based Emulator to plot on any chart type which prints the box as printed on a Renko charts and is a Non-Repaint version. You can use either Traditional or ATR Method on current chart Timeframe. Option to plot an EMA Line is provided with Trend indication.

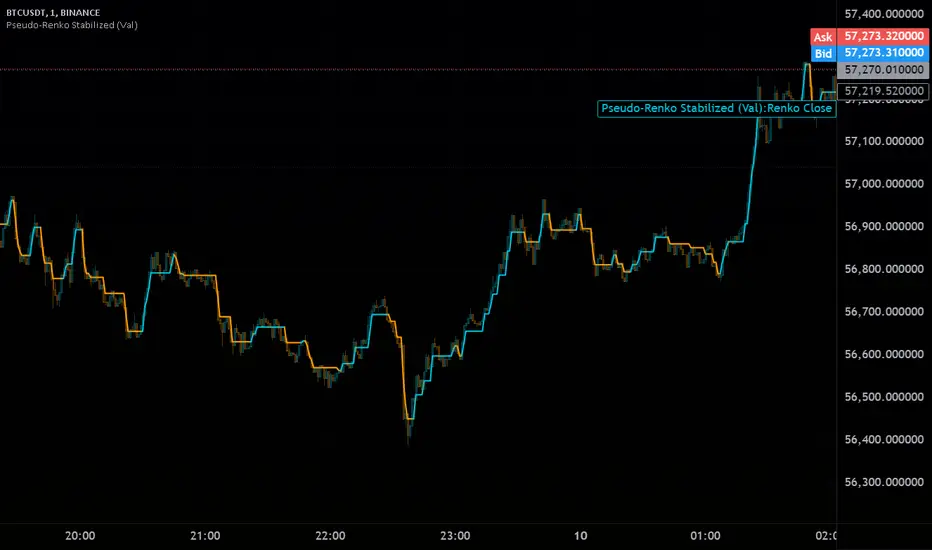
Pseudo-Renko Stabilized (Val)█ CALCULATE PSEUDO-RENKO VALUE
Calculates and returns the Pseudo-Renko Stabilized value (or close price) based on a given input value, along with the direction of the current Renko brick. This function adapts the traditional Renko brick size dynamically based on the volatility of the input value using a combination of SMA and EMA calculations. The calculated price represents the closing price of the most recent Pseudo-Renko brick, while the direction indicates the trend ( 1 for uptrend, -1 for downtrend).
Parameters:
* `val` :
* Type: ` float `
* Description: The input value upon which the Pseudo-Renko calculations are performed. You can use any price series or custom value as input.
* `sensitivity` :
* Type: ` float `
* Default Value: ` 1.0 `
* Description: Controls the sensitivity of the brick size to the volatility of the `val`. Higher values lead to larger bricks, resulting in a smoother Renko chart. Lower values produce smaller bricks, leading to a more reactive chart.
* Possible Values: Any positive float.
* `length` :
* Type: ` int `
* Default Value: ` 7 `
* Description: The length used for calculating the EMA and SMA in the dynamic brick size calculation. It influences how quickly the brick size adapts to changing volatility of the `val`.
* Possible Values: Any positive integer.
Return Values:
* `lastRenkoClose` :
* Type: ` float `
* Description: The closing price of the last completed Pseudo-Renko brick based on the `val`.
* `renkoDirection` :
* Type: ` int `
* Description: The direction of the current Pseudo-Renko brick based on the `val`:
* ` 1 `: Uptrend
* ` -1 `: Downtrend
* ` 0 `: No change (initially, or no brick change since the previous bar)
Example Usage:
//@version=5
indicator("Pseudo-Renko Stabilized (Val)", overlay=true)
// Get user inputs
sensitivityInput = input.float(0.1, "Sensitivity",0.01,step=0.01)
lengthInput = input.int(5, "Length",2)
// Example usage with the 'close' price as the input value
= pseudo_renko(math.avg(close,open), sensitivityInput, lengthInput)
// Plot the Renko close price
plot(renkoClose, "Renko Close", renkoDirection>0?color.aqua:color.orange,2)
// You can also use other values as input, such as:
// = pseudo_renko(high, sensitivityInput, lengthInput)
// = pseudo_renko(low, sensitivityInput, lengthInput)
This example demonstrates how to use the `pseudo_renko` function within an indicator. It takes user inputs for `sensitivity` and `length`, then calculates the Pseudo-Renko values using the average of the `close` and `open` prices as the `val`. The resulting `renkoClose` price is plotted on the chart, with a color change based on the `renkoDirection`. It also illustrates how you can use other values, like `high` and `low`, as input to the function.
Note: The Pseudo-Renko algorithm is based on adapting the Renko brick size dynamically based on the input `val`. This provides more flexibility compared to the normal, but is experimental. The `sensitivity` and `length` parameters, along with the choice of the `val`, offer further customization to tune the algorithm's behavior to your preference and trading style.
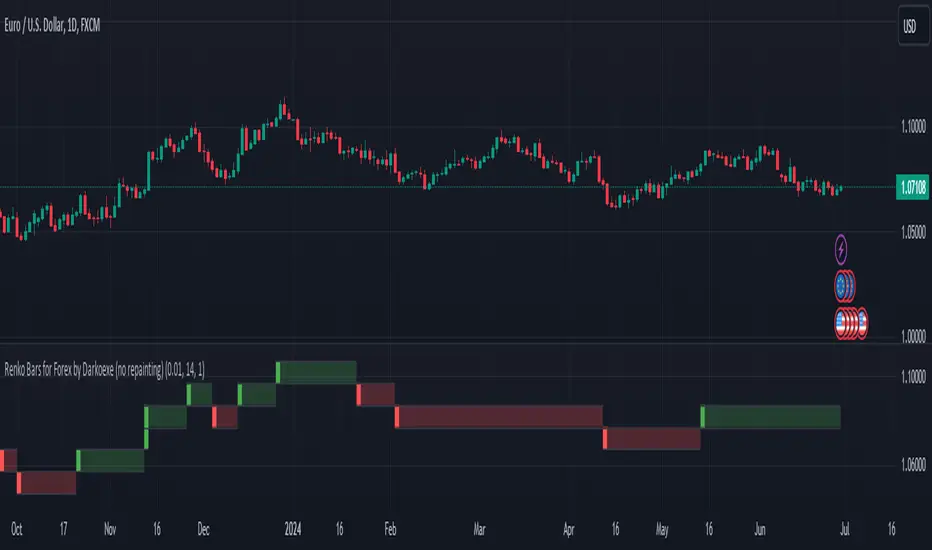
Renko Bars for Forex by Darkoexe (no repainting)This indicator achieves plotting Renko bars with no repainting by resetting the open of the first Renko bar every market open after the FOREX market close. The indicator displays Renko bars for a timeframe chart which means multiple Renko bars can appear in the same timeframe as a single chart candle. This is because Renko bars aren't time bound, they are formed based on price movement. Whenever multiple Renko bars would appear in the timeframe of a single chart candle, the Renko bars will be displayed in a stacked manner meaning the Renko bars will be stacked on top of each other. If the Renko bars stacked are green, the top Renko bar close is the Renko close price of the timeframe. Whenever there's no Renko price movement for a specific candles timeframe, there will be a shadow of the color of the previous Renko bar displayed. These shadows can go on for a while if there's no significant price movement or if the Renko brick size input parameter is set too high.
There's 2 ways to calculate the size of each Renko bar. The first way (the default way) uses a fixed fixed brick size where you can choose the size of each brick. The second way uses a dynamic brick size which just uses the ATR with whatever length you would like to determine the brick size for each Renko bar. The dynamic option also has a factor input which would be multiplied with the calculated ATR to determine the brick size. To use the dynamic option, just check the box in the inputs section labeled "Dynamic Renko Box Size (uses the ATR for renko box size)".
Enjoy!!!
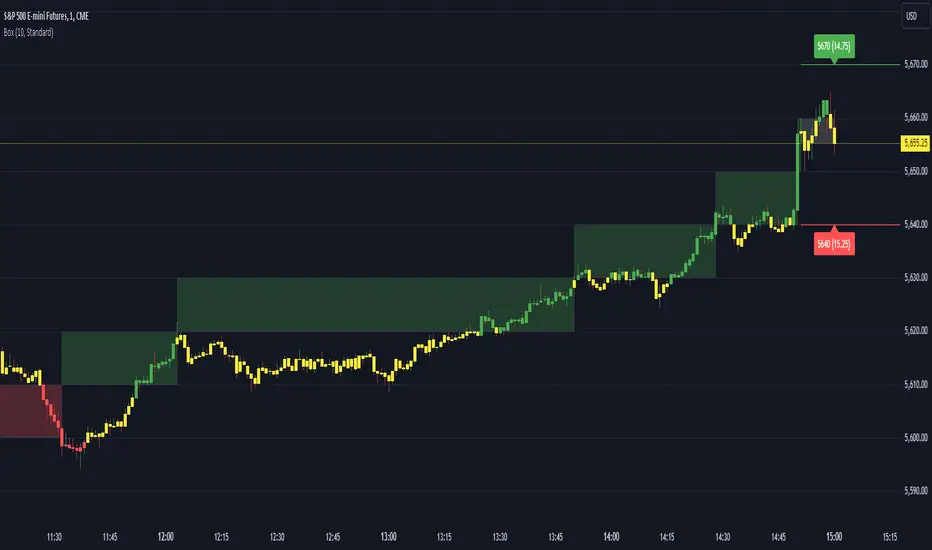
Renko Box Chart Overlay by BDThis is Renko chart overlay for Candles chart. You can use it to identify market direction and potential key points.
To use it simply select box size and any timeframe you want.
With this overlay you can be sure that you'll see every brick on a chart showing general market direction with all the details of a candles chart.
Alternatives Renko overlay charts:
If you don't have access to 1s timeframe or you don't want to use low TF here is the situation with built in Renko chart on 5m TF:
This Renko boxes are linked to chart by time(candle) and price. It will draw a box even if price didn't close above(or below) of box level:
But be careful when setting box size too small because it will produce bad results:
The issue is known and I'll work on fixing it in next update, for now use box size at least the size of a body of a candle, after all renko is for general market movement and not for marking up every tick.
Let me know if you want to see any additions.
Customizable Moving Average RibbonThis indicator is a highly customizable moving average ribbon with some unique features.
This script can utilize multiple unique sources, including a non-repainting renko closing price. Renko charts focus solely on price movement and minimize the impacts of time and the extra noise time creates. Employing the renko close helps smooth out the MA ribbon. Insignificant price movements will not cause a change in the plotted lines of the indicator unless a new threshold is breached or a "brick" is created. This is highly useful for quickly identifying consolidation areas or overall flat price movement.
There are two methods for selecting the box size when utilizing the renko source. Box size is critical for the overall function and efficacy of the plots you will visually see with this indicator. Box size is set automatically using the Average True Range "ATR" or manually using the "Traditional" setting. The simplest way to determine a manual box size is to take the ATR of the given instrument and round it to the nearest decimal place. As an example, if the ATR for the asset is 0.18, you would round that number to 0.2 and utilize this as your traditional box size.
The MA ribbon contains eleven adjustable moving average lines. Users can choose to turn off as many as they would like. Users can also adjust the length of the individual moving averages and the source for all moving averages. There are nine types of moving averages to choose from for the ribbon. The MA options are:
Exponential Moving Average = 'EMA'
Double Exponential Moving Average= 'DEMA'
Triple Exponential Moving Average = 'TEMA'
Simple Moving Average = 'SMA'
Relative Moving Average = 'RMA'
Volume Weighted Moving Average = 'VWMA'
Weighted Moving Average = 'WMA'
Smoothed Simple Moving Average = 'SSMA'
Hull Moving Average = 'HULL'
We believe that the ribbons features, including the line color change, help quickly identify trends and give users optimum customization. Users can select from five different color schemes including:
Green/Red
Purple/White
White/Blue
Silver / Orange
Teal/ Orange

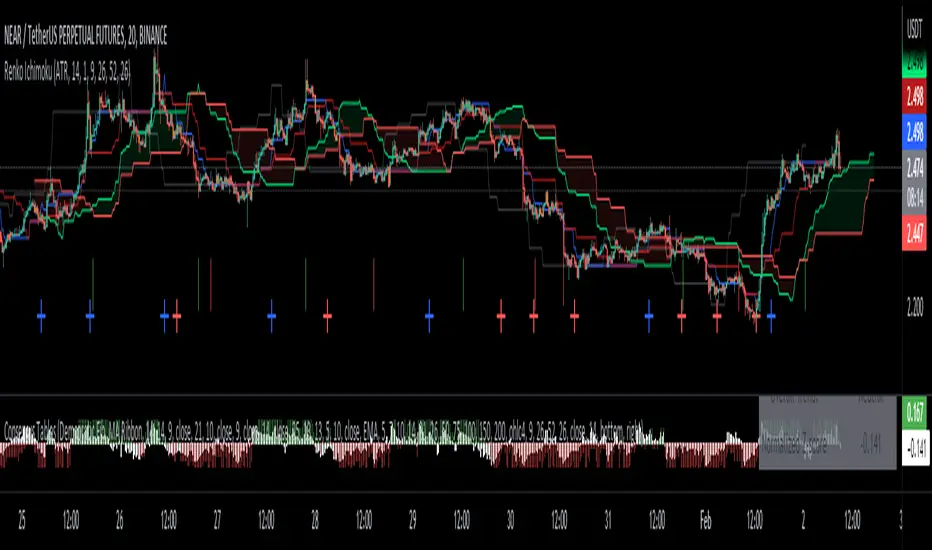
Renko Ichimoku CloudThis script utilizes its source from a non-repainting renko closing price. Renko charts focus solely on price movement and minimize the impacts of time and the extra noise time creates. Employing the renko close helps smooth out the Ichimoku Cloud. Insignificant price movements will not cause a change in the plotted lines of the indicator unless a new threshold is breached or a "brick" is created.
This Ichmoku Cloud includes all standard lines with standard lengths. These include:
Tenken Sen
Kiju Sen
Senkou A/B
Chikou Span
We have also included plotted marks for when there is a Tenken Sen/ Kiju Sen cross and for the Kumo cloud twist.
There are two methods for selecting the box size. Box size is critical for the overall function and efficacy of the plots you will visually see with this indicator. Box size is set automatically using the Average True Range "ATR" or manually using the "Traditional" setting. The simplest way to determine a manual box six is to take the ATR of the given instrument and round it to the nearest decimal place. As an example, if the ATR for the asset is 0.017, you would round that number to 0.02 and utilize this as your traditional box size.
Renko Stop and GoSimilar to crossover systems, this indicator uses the renko calculation of the brick open position instead of the slow average in a crossover system, it also generates a signal marker on the crossover of the price and renko lines, both can be smoothed in the optional parameters.
update version to V5 for this script:

Numbers RenkoRenko with Volume and Time in the box was developed by David Weis (Authority on Wyckoff method) and his student.
I like this style (I don't know what it is officially called) because it brings out the potential of Wyckoff method and Renko, and looks beautiful.
I can't find this style Indicator anywhere, so I made something like it, then I named "Numbers Renko" (数字 練行足 in Japanese).
Caution : This indicator only works exactly in Renko Chart.
////////// Numbers Renko General Settings //////////
Volume Divisor : To make good looking Volume Number.
ex) You set 100. When Volume is 0.056, 0.05 x 100 = 5.6. 6 is plotted in the box (Decimal are round off).
Show Only Large Renko Volume : show only Renko Volume which is larger than Average Renko Volume (it is calculated by user selected moving average, option below).
Show Renko Time : "Only Large Renko Time" show only Renko Time which is larger than Average Renko Time (it is calculated by user selected moving average, option below).
EMA period for calculation : This is used to calculate Average Renko Time and Average Renko Volume (These are used to decide Numbers colors and Candles colors). Default is EMA, You can choice SMA.
////////// Numbers Renko Coloring //////////
The Numbers in the box are color coded by compared the current Renko Volume with the Average Renko Volume.
If the current Renko Volume is 2 times larger than the ARV, Color2 will be used. If the current Renko Volume is 1.5 times larger than the ARV, Color1.5 will be used. Color1 If the current Renko Volume is larger than the ARV . Color0.5 is larger than half Athe RV and Color0 is less than or equal to half the ARV. Color1, Color1.5 and Color2 are Large Value, so only these colored Numbers are showed when use "Show Only ~ " option.
Default is Renko Volume based Color coding, You can choice Renko Time based Color coding. Therefore you can use two type coloring at the same time. ex) The Numbers Colors are Renko Volume based. Candle body, border and wick Colors are Renko Time based.
////////// Weis Wave Volume //////////
Show Effort vs Result : Weis Wave Volume divided by Wave Length.
ex) If 100 Up WWV is accumulated between 30 Up Renko Box, 100 / 30 = 3.33... will be 3.3 (Second decimal will be rounded off).
No Result Ratio : If current "Effort vs Result" is "No Result Ratio" times larger than Average Effort vs Result, Square Mark will be show. AEvsR is calculated by 5SMA.
ex) You set 1.5. If Current EvsR is 20 and AEvsR is 10, 20 > 10 x 1.5 then Square Mark will be show.
If the left and right arrows are in the same direction, the right arrow is omitted.
Show Comparison Marks : Show left side arrow by compare current value to previous previous value and show right side small arrow by compare current value to previous value.
ex) Current Up WWV is 17 and Previous Up WWV (previous previous value) is 12, left side arrow is Up. Previous Dn WWV is 20, right side small arrow is Dn.
Large Volume Ratio : If current WWV is "Large Volume Ratio" times larger than Average WWV, Large WWV color is used.
Sample layout

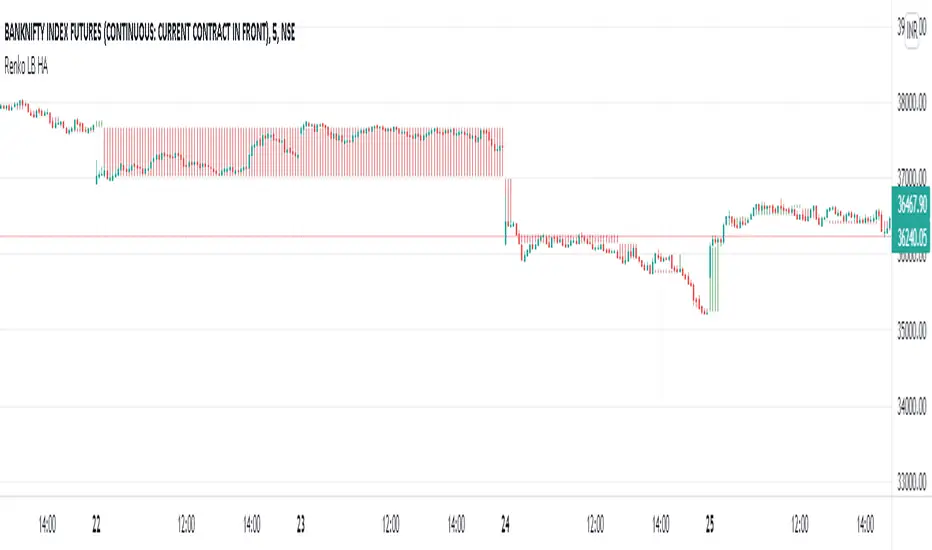
Renko LineBreak HeikinAshi background & MTFWe can have all the 3 types of candle plots (bar styles) over normal candles in the same chart.
We will have better picture on whats happening in specific chart candle type / bar style.
Option provided to turn off/on specific bar type.
Multi time frame is enabled.
Specific time frame can be chosen for individual bar style.
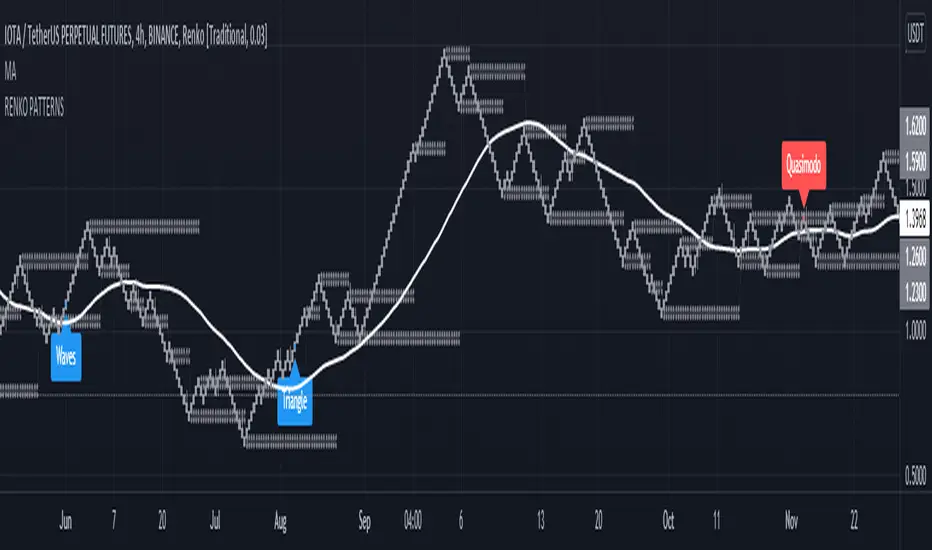
Head and Shoulders - Quasimodo etc Pattern Recognition RENKODisclaimer: Only use this pattern recognition on a RENKO chart. Renko charts plot different than traditional candles and therefore do not represent all price moves. There is a possibility of repainting while using ATR based renko charts so past results are not a 100% accurate representation of future results. Use this indicator as a part of your strategy and not as your only means of obtaining gains in the market.
Hello traders, it has been said time and time again that algorithmic software is unable to identify complex market structure like head and shoulders, quasimodo, triangle patterns and other methods humans use to base their trading decisions on. With this indicator I intend to completely crush that assumption and prove that it actualy is possible. Ofcourse an indicator is less likely to find all variation on a chart pattern and a human is probably still your best bet in finding these patterns early.
That is wy this indicator does not only use textbook patterns and has 7 variation on head and shoulders build into it. I will keep updating this indicator if I see it missed some crucial patterns. Right now it has a total of 38 patterns build into it with them being grouped under specific names. Feel free to turn off any pattern you do not like to see.
Renko patterns solve the problem of time and chaos in the markets which have been the biggest hurdle in pattern recognition software as the amount of variations to account for is just too great a number. With this script using renko it will soon be able to identify any pattern in the market and I plan to add Wyckoff to it in the future, right now I have a beta version of Wyckoff build into it but planning to add better version of it in the future. The amount of variations on Wyckoff is quite extreme so it will take a very long time to get an optimised Wyckoff identification system.
If you do not want to miss patterns I recommend to use a multi chart aproach so that you can find patterns in multiple renko brick sizes at the same time to find more entrys.
Feel free to comment any pattern you want me to add and let's make the most dedicated pattern recognition software on this platform.
Regards
HonestCowboy
Protervus RenkoWelcome to Protervus Renko!
After over two years of research and development, I'm thrilled to present you with my take on Renko in overlay mode.
Key features
Four Renko Types: Classic, Median, Geometric, Turbo
Brick size methods: Traditional, Percentage, ATR
Renko Wicks
Higher Time-Frame selection
No repainting, all data is consolidated and obtained from regular candles
Output mode: pass Protervus Renko data to other indicators
Built-in settings validator
Renko Statistics
Bricks reversal
Complete style and color customization
Tooltips in the settings panel explaining available options
Alerts
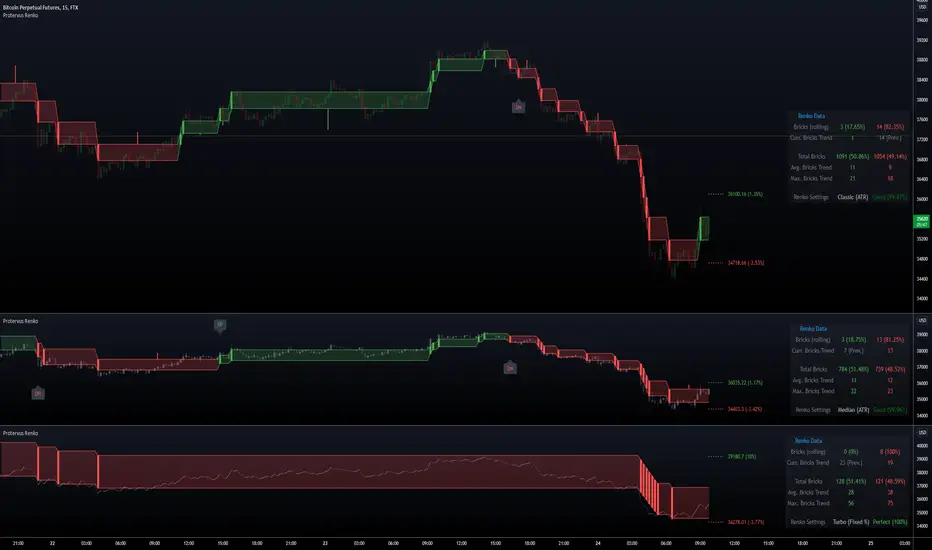
Renko Types: Classic, Median, Geometric, Turbo
Show Candles, Levels, or Both - along with Wicks
Note: when levels are disabled Wicks are shown on the actual Renko bricks, while when enabled they are shown in the middle of the Renko level.
Understanding Renko Output
In Real Mode, the output only contains data on the Renko brick, while in Normalized mode the values are repeated for the whole Renko level.
Example with Bollinger Bands:
In Real Mode, Bollinger Bands will be calculated exclusively on the Renko Bricks. Had we used Normalized Mode instead, the output wouldn't make sense as the values are carried over on each candle.
Other indicators (like RSI, for example) would work better with Normalized output though:
Automatic settings validation
Note: if settings are Unreliable, the script will not show any Renko candles or levels. The Output can still be used on external indicators, if needed (e.g. for a more granular RSI output).
Renko Data Panel
Data Panel shows two types of statistics: Rolling and Barset. Rolling data is referring to "last X time" and can be defined in the indicator's settings (in this example it's set to one week) while "Total Bricks" are considered over the whole available barset (since the beginning of the chart).
Besides seeing Renko Bricks trends at a glance, it's also possible to spot interesting areas when Rolling bricks are coming close to either the Total Average or Total Maximum Bricks, signaling a possible reversal or continuation.
Bricks Reversal
Show reversals: configure how many opposite bricks are needed to trigger a reversal, as well as limiting their number to avoid strong opposite movements.
Tip: more conservative Traders might want to receive a signal if the minimum is close to the Average Bricks Trend, but not over the Maximum Bricks Trend.
Moving the Indicator to a separate pane and overlay price
Credits
yatrader2 (lengths in time or bars function), allanster (Heikin Ashi function)
Special thanks go to PineCoders community for their incredible efforts and learning material to help mastering PineScript!
Renko Candles OverlayHello All,
For long time I got many request for Renko Candles and now here it's, Renko Candles Overlay . I tried to make almost everything optional, so you can play with the options as you want.
Let see the options:
Method: the option for brick scaling method: ATR, ATR/2, ATR/4, Percent, Traditional
- ATR Period: period for Average True Range and it's valid if the method is ATR
- ATR/2 Period: period for Average True Range and it's valid if the method is ATR/2
- ATR/4 Period: period for Average True Range and it's valid if the method is ATR/4
- Traditional: User-defined brick size, it's valid if the method is Traditional
- Percent: Percent of Close price, it's valid if the method is Percent
if the method is not Traditional (fixed brick size) then Brick size is calculated/updated when new bricks added. so The box sizes may be different because of the calculation is dynamic.
Levels & Lines for new Bricks: if you enable this option then the script shows the levels for new brick
Change Bar Color: optionally the script changes the bar color by using direction of the bricks
and some other options for coloring.
The script shows the bricks for visible area, which is approximately 280 candles. so if you change the width and number of the bricks then number of bricks that is shown is adjusted automatically to fit the screen. you can see the examples below:
The script shows the levels to new brick as a line and label:
Because of real-time bar is not confirmed until the candle close, the script shows the bricks as Unconfirmed , and unconfirmed bricks shown in different color:
You can change the width of the bricks (width is 10 in following example):
Optionally candle colors are changde by the direction of the bricks:
If you have any recommendation then please drop a comment under the script ;)
Enjoy!

st_renkoThe indicator has two parameters: the period and the number of splits. For the selected period, the maximum and minimum are calculated, and the scope of the market is determined by the difference between the maximum and minimum. The scope is divided by the number of partitions, thereby determining the step of the levels. If the average price (ohlc4) falls within the range between levels, this range is drawn. A simpler analogy: we have a local minimum. and the local maximum for the selected period, we build a ladder between them, the number of steps of which is equal to the number of splits, and if the price is on some step of this ladder, then this step is drawn, so we can see how many steps separate us from the maximum and minimum.

MM CHEATCODE V2The Best Renko system out there. The second coming to the original Cheatcode Algo we made
with options to use Tradition point calculations or ATR values for price measurement
- Select up to 3 tp levels
- ATR Risk calculator
- Strategy presets for easy setting selection for certain assets
- A trailing Ma for stint entries filters
- Volatility bands (BB, Kentler,Donchain)
- ATR super trend for added trend & trade filter
- MTF filter (up to 3)
- Added Session display as well as strict filter to only trade during that session(s) selected
- Full signal Alerts (meaning the full signal will send Entry, TP, Sl )
- added MM Capo volatility filter
Also Have Automation Version Available
How to use
You can use a setting preset in for the asset selected and the settings will automatically adjust but won't apply to your setting screen. (Tradingview limitations)
For the most part the buy signal will plot when the ATR moves in up/down direction
Filter your trades with the various trend detections indicators added when they all line up you have the best probability for the trade.
Renko is the best way to trade basic market structure and now with all the confirmation you need.
ALL Links below or PM us for access to this indicator Happy Trading
