Reversal

Smart Envelope - Running Away From The TrendIntroduction
Envelopes indicators consist in displaying one upper and one lower extremity on the price chart. They are most of the time built by adding/subtracting a volatility estimator (rolling stdev, atr, range...etc) to a central tendency estimator (SMA, EMA, LSMA...etc) . Their interpretation is often subject to debate amongst technical analyst, some will use a support and resistance methodology, where price will start a downtrend once it cross the upper extremity, and a down trend once it cross the lower one. Others will prefer a breakout methodology, where price will reach higher highs once it cross the upper extremity, and lower lows when it cross the lower one. Because of price non stationarity its hard to select the best methodology, the support and resistance one will mostly work on ranging markets, while the breakout methodology mostly work on trending ones.
Therefore new methods where proposed, instead of using moving averages with a high lag, faster filters where used, such as the least squares moving average or zero lag exponential moving average, other band indicators where also created using adaptive filters, but improvements remain relatively low. The most difficult task would be to make extremities with the ability to return accurate support and resistances levels, and today i want to provide a new way to construct such extremities by using the recursive bands framework that allow extremely creative and efficient indicators.
The Main Idea
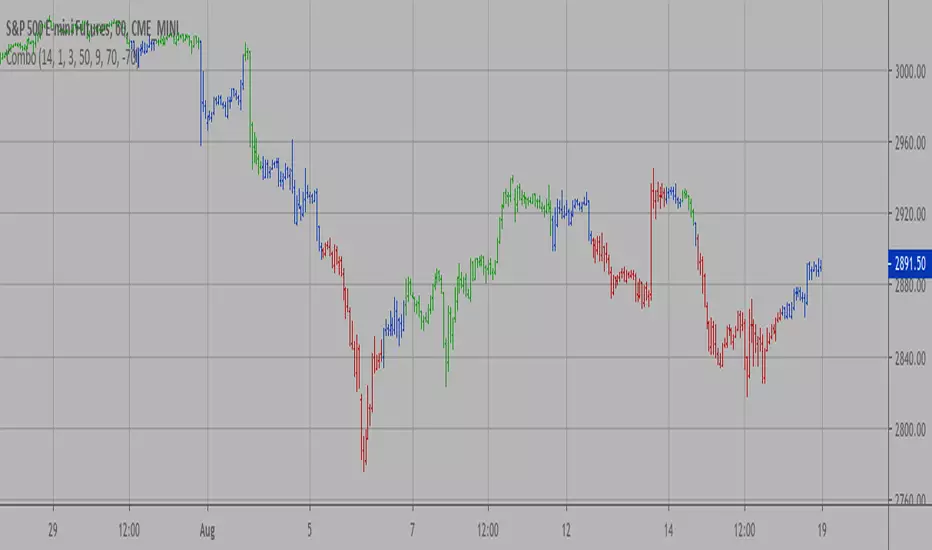
With classical bands indicators, the upper and lower extremity will still be correlated with the main trend, the problem behind such method is that we can't use a support and resistance methodology with trending markets, the fact that reversals exist tells us that our extremities will always be crossed by the main trend, here is an example :
Here the support is correlated with the main trend, in order for it to be accurate we must assume the trend will go on for ever, and will only detect higher lows, this is what we expect with the orange line, but we can see that a severe down trend totally destroy our plan.
In short we need to give some headroom to our extremities, and thus one extremity can't be correlated with the main trend.
The proposed Indicator
We want to minimize the correlation between the extremities, so if the upper extremity rise, the lower one must fall. This allow to give some headroom and allow the user to anticipate larger movements, this is how bands seeking to give support and resistances points should work.
The indicator has a length setting that control the wideness of the extremities, unlike other indicators low values such as 14 can still create really wide bands, take that into account.
length = 5. Lower length values allow for more motion from the extremities, but does not necessarily involve detecting shorter terms support and resistances levels. The factor setting is not that important, but it allow to return extremities with more motion when high, and really wide bands when below 1 and greater than 0.
Central Tendency Estimator
Something fun with the recursive band framework is that the bands are no longer based on the central tendency estimator but its the central tendency estimator who is based on the bands. The central tendency estimator can also provide support and resistances points with the price, like classical moving averages, altho its lack of motion is this time a downside.
Conclusion
Altho the extremities are more accurate than other band indicators, the problem remain the same, larger trend will always break the extremities and continue creating higher/lower highs/lows, at this point our stop loss would certainly be triggered. This is a huge downsides of contrarian strategy, we sure might anticipate reversals earlier, but we are exposed to larger price movements, therefore the risk is extreme.
But the proposed methodology might still prove useful to develop more robust support and resistances levels based on envelopes indicators.
Thanks for reading !

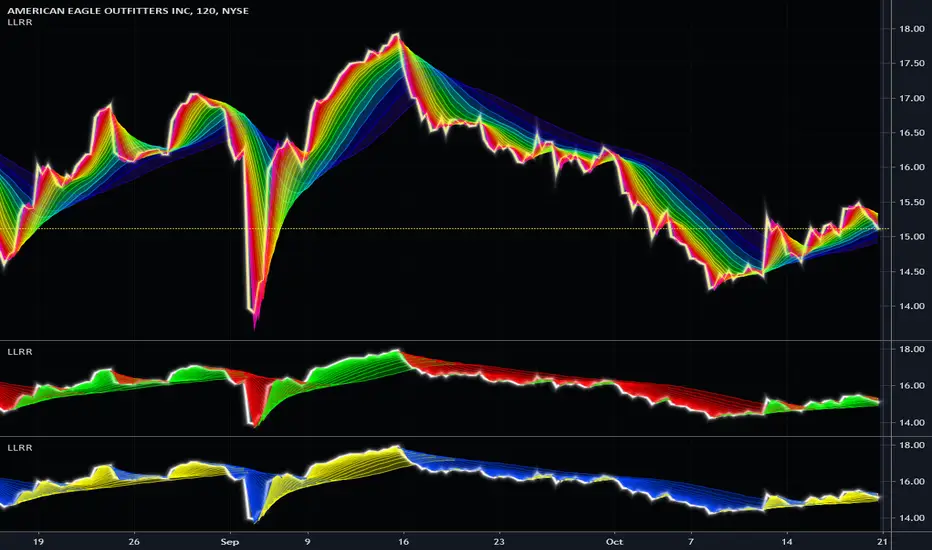
Lag-Less Rainbow RibbonThis is my polychromatic "Lag-Less Rainbow Ribbon" indicator using Pine Script version 4.0. I'm sure you may noticed by now, this indicator is truly an astounding rainbow to witness upon encountering it initially. It's jaw dropping beauty is the first of it's kind on TV, but will continue to shine here, or on your chart, so long as TV exists. This one isn't disappearing into non-existence any time soon.
It's extremely easy to use having only one input() to control the entire ribbon and it's lag. I couldn't make it any simpler to use, and that's one unique yet powerful feature of this elegant indicator. Another unique characteristic of deploying this in rainbow fashion is it provides very clear indications of when and where a significant reversal has occurred. Afterwards, trend direction following a large reversal is quickly established.
This script uses all 64 of the available plottable series TV will allow currently, so adding features to it may be impossible in the future. Yet the cloud handles it with ease and speed I have never encountered in a ribbon indicator before. The Pine Script in this indicator is highly optimized, coming in at a light weight 120+ lines of code, probably contributing to it's efficiency.
Lastly, with this flagship indicator, I included a multi-color "neon source" line to view close, hl2, etc... Any one of the two indicators may actually be enabled/disabled independently.
In the demonstration chart, you will witness the other color schemes available. I provided multiple color schemes for those of you who may have color blindness vision impairments. You may contact me in private, if these color schemes are not suitable for your diagnosed visual impairment, and you wish to contribute to seeing the color schemes improved along with other future indicators I shall release.
I.P.O.C.S.: "Initial Public Offering Clean Start" proprietary technology. Firstly, many of my other indicators already possess this capability. It allows suitable plotting from day one, minute one of IPO, remedying visually delayed signal analysis. It's basically accurate plotting from the very first bar (bar_index==0) on Tradingview. If you don't know what this is, most people don't, go back to the VERY beginning of any stock on the "All" chart and compare it to other similar indicators. What's so special about this? It is extremely difficult to get a healthy plot from bar_index==0 on any platform. However, I have become exceedingly talented performing this feat in most cases, but not all depending on the algorithm. This indicator is a successful accomplishment implementing IPOCS. It's inherent value is predominantly for IPO traders who in the past have had to wait 20, 50, and 150 bars before they obtain a precise indicator measurement for the simplest of algorithms in order to make a properly informed decision to potentially invest in an asset. How is this achieved? It's a highly protected secret of mine... but I will say I rarely use Pine built-in functions at all. When I do, I use them scarcely due to currently existing Pine language limitations.
Features List Includes:
I.P.O.C.S.(Initial Public Offering Clean Start) Technology
Enable/disable dark background for enhanced visibility
One "Lag Factor" adjustment to adjust them all
Color schemes
"Transparency" control
Independent "Source" options
This is not a freely available indicator, FYI. To witness my Pine poetry in action, properly negotiated requests for unlimited access, per indicator, may ONLY be obtained by direct contact with me using TV's "Private Chats" or by "Message" hidden in my member name above. The comments section below is solely just for commenting and other remarks, ideas, compliments, etc... regarding only this indicator, not others. When available time provides itself, I will consider your inquiries, thoughts, and concepts presented below in the comments section if you do have any questions or comments regarding this indicator. When my indicators achieve more prevalent use by TV members, I will implement more ideas when they present themselves as worthy additions. As always, "Like" it if you simply just like it with a proper thumbs up, and also return to my scripts list occasionally for additional postings. Have a profitable future everyone!
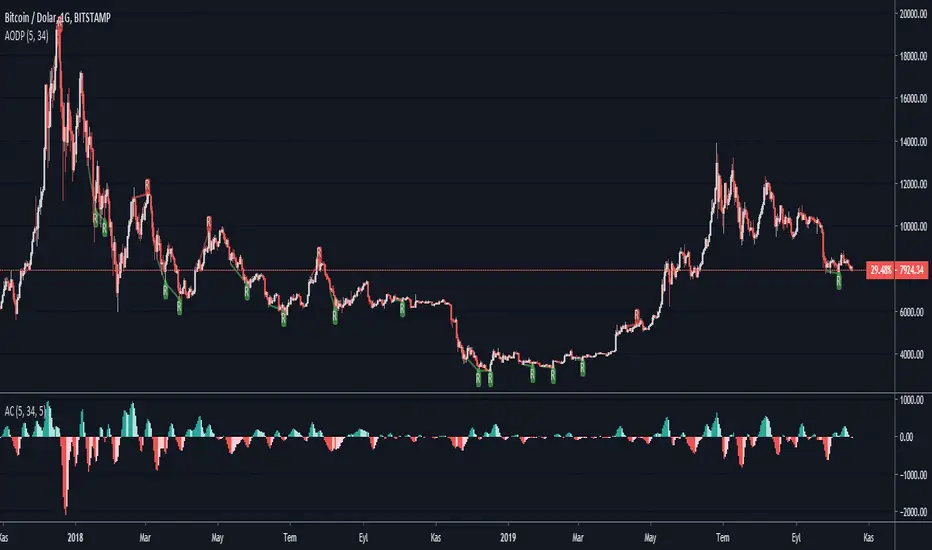
Accelerator Oscillator Divergence PointerThis script points regular and optionally hidden types of bullish and bearish Accelerator Oscillator divergences on the chart by drawing the divergence lines and optionally labels.
Hidden divergence is disabled by default, it can be enabled over settings window.
Regular divergence is enabled by default, it can be disabled over settings window.
There is an option to display the price channel additionally.
Alerts for all types of divergences.
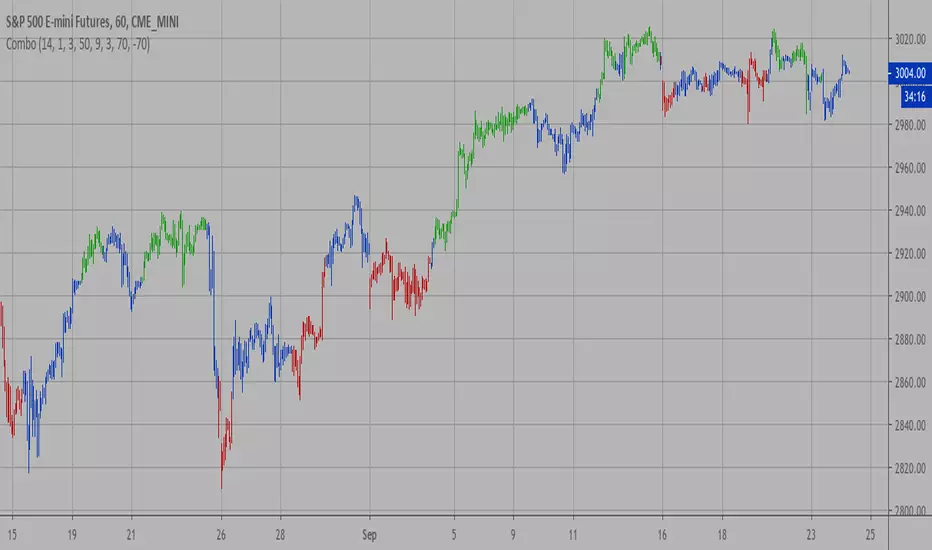
Combo Strategy 123 Reversal & EMA & Volume Weighting This is combo strategies for get a cumulative signal.
First strategy
This System was created from the Book "How I Tripled My Money In The
Futures Market" by Ulf Jensen, Page 183. This is reverse type of strategies.
The strategy buys at market, if close price is higher than the previous close
during 2 days and the meaning of 9-days Stochastic Slow Oscillator is lower than 50.
The strategy sells at market, if close price is lower than the previous close price
during 2 days and the meaning of 9-days Stochastic Fast Oscillator is higher than 50.
Second strategy
The related article is copyrighted material from Stocks & Commodities 2009 Oct
WARNING:
- For purpose educate only
- This script to change bars colors.

Combo Strategy 123 Reversal & DMI & Moving Average This is combo strategies for get a cumulative signal.
First strategy
This System was created from the Book "How I Tripled My Money In The
Futures Market" by Ulf Jensen, Page 183. This is reverse type of strategies.
The strategy buys at market, if close price is higher than the previous close
during 2 days and the meaning of 9-days Stochastic Slow Oscillator is lower than 50.
The strategy sells at market, if close price is lower than the previous close price
during 2 days and the meaning of 9-days Stochastic Fast Oscillator is higher than 50.
Second strategy
The related article is copyrighted material from Stocks & Commodities Aug 2009
Combining DMI And Moving Average Trading System
WARNING:
- For purpose educate only
- This script to change bars colors.

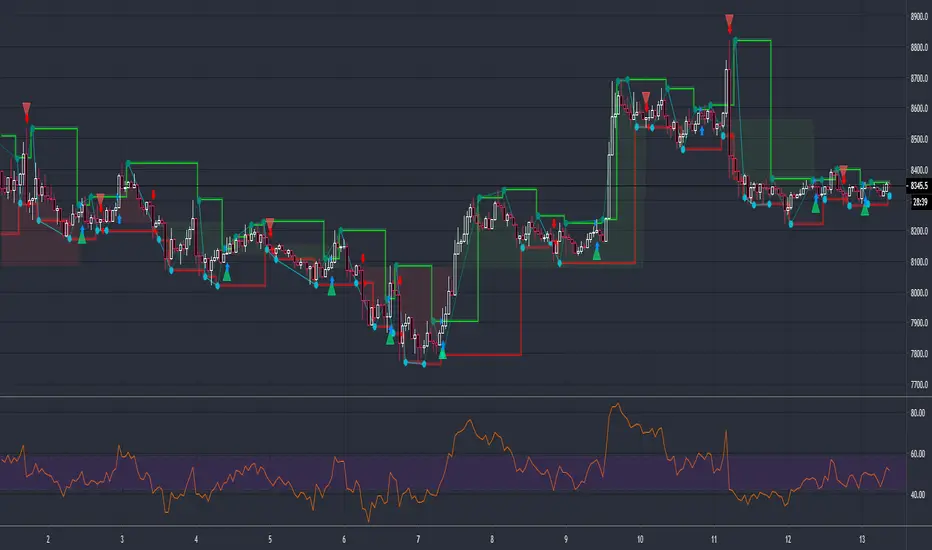
Pivot Reversal Strategy + RSIPivot Reversal Strategy + RSI
A modified version of the standard PRS with an RSI overbought/oversold filter
Comment/uncomment "Study/Strategy" to easily switch to strategy() mode
As long as it is used in the study() version, the indicator is compatible with the Risk Management Wrapper
Separate Alerts for Buy & Sell signals
Single Alert for both Buy & Sell signals - it can also be used by another indicator as a source
FUSIONGAPS V5Market bullish/bearish phase indicator , with trend-reversal and golden/death cross indicators.
This the re-implementation of my old script, now allowing the selection between different moving-averaging modes.
Note: In no way is this intended as a financial/investment/trading advice. You are responsible for your own investment decisions and/or trades.
~ JuniAiko
(=^~^=)v~

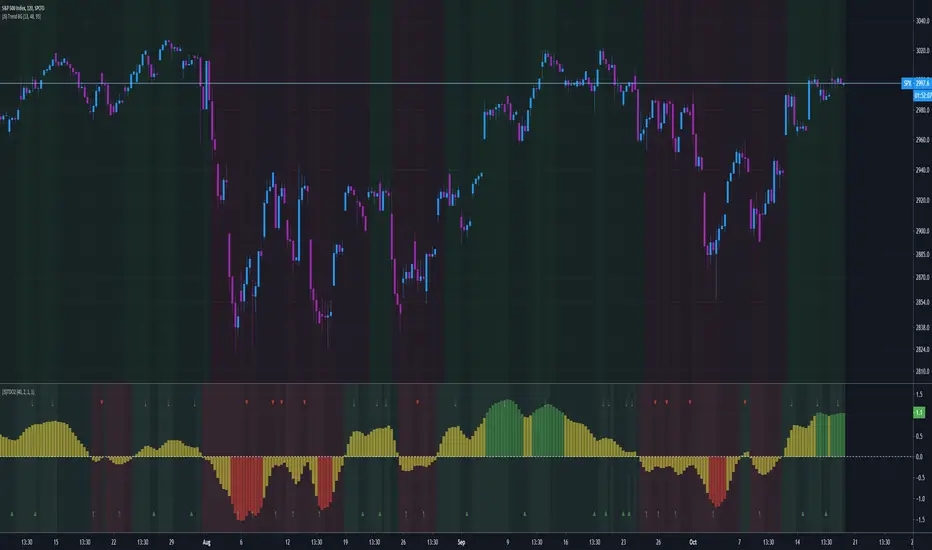
MS MONEY CCI SQUEEZEAbout
I have used this indicator to find many lucrative opportunities. This indicator takes the moving average of CCI in custom, volatility-specific conditions. CCI measures "overbought" in the red-shaded region and "Oversold" in the green-shaded region. The shaded regions do not constitute a buy/sell signal alone, the MS CCI Squeeze is best used when market conditions agree and is best used when the user has fundamental reasoning for "reversal-like" situations to align. The MS CCI Squeeze will soon have a synergistic partner called "MS RSI Squeeze" indicator that will look similar to help better measure volatility and strength trend.
About the Commodity Channel Index (CCI)
The commodity channel index (CCI) is an oscillator originally introduced by Donald Lambert in 1980. Since its introduction, the indicator has grown in popularity and is now a very common tool for traders in identifying cyclical trends not only in commodities, but also equities (stocks) and currency trading.
How to set an Alert
If the user wants to set an alert , click on one of the support/ resistance lines (black-dashed) near the zero mark. Clicking on the horizontal line above or below the zero line will populate a yellow arrow which will allow you to set alerts when wanted.
Please Read For Better Efficiency
When using this indicator, keep an eye out for harmonic patterns, both bullish and bearish head and shoulders patterns for "HIDDEN" breakout opportunities.
Please like, follow and share and I will continue building better indicators.

(JS) Tip-and-Dip Oscillator 2.0I am going to start taking requests to open source my indicators and this is the first one I decided to do. They will also be updated to Version 4 of Pinescript.
I went through and added notes on what each area of the code is, and in this particular case I added color schemes as a way to improve upon the original code.
Link to original:
Original Description:
"Let me start by saying I know that the name is goofy lol
This is an oscillator that that looks at price action vs. standard deviation in order to illustrate the trend. This thing looks like an Awesome Oscillator but the math behind this and the Awesome Oscillator are totally different (which is pretty interesting, given they look a lot alike). I included the Awesome Oscillator on the chart here so you can look at them and see where they are different.
So the Tip-and Dip Oscillator is meant to help you pinpoint tops and bottoms. I even added arrows where the top and bottom signals are given.
The oscillator itself has 3 colors, an up, down, and neutral color that come as green, red, and yellow. Since the readings given by the oscillator can greatly vary depending on the chart resolution, I included an option to edit the range to fit your chart.
Also - I have 4 different smoothing options that you can use depending on what your preference is. The default setting is the most sensitive so it will identify tops and bottoms more frequently, but it is the most accurate when pinpointing the correct reversal candle. As you smooth it out, the arrows will appear less, but my be slightly delayed and give a later reading. I personally prefer the default, but going up to the second setting in smoothing works nicely as well.
Enjoy!"
Combo Strategy 123 Reversal & CMOfilt This is combo strategies for get a cumulative signal.
First strategy
This System was created from the Book "How I Tripled My Money In The
Futures Market" by Ulf Jensen, Page 183. This is reverse type of strategies.
The strategy buys at market, if close price is higher than the previous close
during 2 days and the meaning of 9-days Stochastic Slow Oscillator is lower than 50.
The strategy sells at market, if close price is lower than the previous close price
during 2 days and the meaning of 9-days Stochastic Fast Oscillator is higher than 50.
Second strategy
This indicator plots a CMO which ignores price changes which are less
than a threshold value. CMO was developed by Tushar Chande. A scientist,
an inventor, and a respected trading system developer, Mr. Chande developed
the CMO to capture what he calls "pure momentum". For more definitive
information on the CMO and other indicators we recommend the book The New
Technical Trader by Tushar Chande and Stanley Kroll.
The CMO is closely related to, yet unique from, other momentum oriented
indicators such as Relative Strength Index, Stochastic, Rate-of-Change, etc.
It is most closely related to Welles Wilder`s RSI, yet it differs in several ways:
- It uses data for both up days and down days in the numerator, thereby directly
measuring momentum;
- The calculations are applied on unsmoothed data. Therefore, short-term extreme
movements in price are not hidden. Once calculated, smoothing can be applied to the
CMO, if desired;
- The scale is bounded between +100 and -100, thereby allowing you to clearly see
changes in net momentum using the 0 level. The bounded scale also allows you to
conveniently compare values across different securities.
WARNING:
- For purpose educate only
- This script to change bars colors.
Combo Strategy 123 Reversal & CMOavThis is combo strategies for get a cumulative signal.
First strategy
This System was created from the Book "How I Tripled My Money In The
Futures Market" by Ulf Jensen, Page 183. This is reverse type of strategies.
The strategy buys at market, if close price is higher than the previous close
during 2 days and the meaning of 9-days Stochastic Slow Oscillator is lower than 50.
The strategy sells at market, if close price is lower than the previous close price
during 2 days and the meaning of 9-days Stochastic Fast Oscillator is higher than 50.
Second strategy
This indicator plots average of three different length CMO's. This indicator
was developed by Tushar Chande. A scientist, an inventor, and a respected
trading system developer, Mr. Chande developed the CMO to capture what he
calls "pure momentum". For more definitive information on the CMO and other
indicators we recommend the book The New Technical Trader by Tushar Chande
and Stanley Kroll.
The CMO is closely related to, yet unique from, other momentum oriented
indicators such as Relative Strength Index, Stochastic, Rate-of-Change, etc.
It is most closely related to Welles Wilder?s RSI, yet it differs in several ways:
- It uses data for both up days and down days in the numerator, thereby directly
measuring momentum;
- The calculations are applied on unsmoothed data. Therefore, short-term extreme
movements in price are not hidden. Once calculated, smoothing can be applied to
the CMO, if desired;
- The scale is bounded between +100 and -100, thereby allowing you to clearly see
changes in net momentum using the 0 level. The bounded scale also allows you to
conveniently compare values across different securities.
WARNING:
- For purpose educate only
- This script to change bars colors.
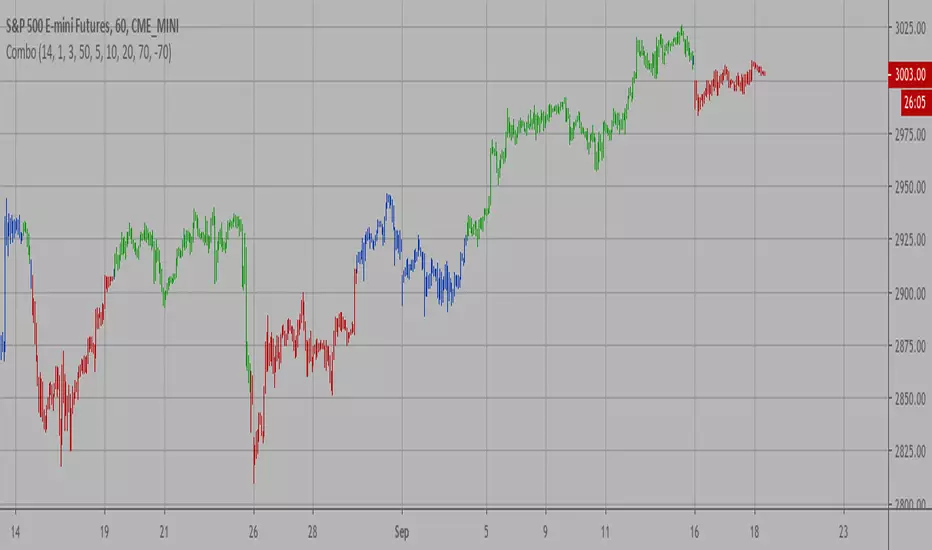
Combo Strategy 123 Reversal & CMOabs This is combo strategies for get a cumulative signal.
First strategy
This System was created from the Book "How I Tripled My Money In The
Futures Market" by Ulf Jensen, Page 183. This is reverse type of strategies.
The strategy buys at market, if close price is higher than the previous close
during 2 days and the meaning of 9-days Stochastic Slow Oscillator is lower than 50.
The strategy sells at market, if close price is lower than the previous close price
during 2 days and the meaning of 9-days Stochastic Fast Oscillator is higher than 50.
Second strategy
This indicator plots the absolute value of CMO. CMO was developed by Tushar
Chande. A scientist, an inventor, and a respected trading system developer,
Mr. Chande developed the CMO to capture what he calls "pure momentum". For
more definitive information on the CMO and other indicators we recommend the
book The New Technical Trader by Tushar Chande and Stanley Kroll.
The CMO is closely related to, yet unique from, other momentum oriented indicators
such as Relative Strength Index, Stochastic, Rate-of-Change, etc. It is most closely
related to Welles Wilder`s RSI, yet it differs in several ways:
- It uses data for both up days and down days in the numerator, thereby directly
measuring momentum;
- The calculations are applied on unsmoothed data. Therefore, short-term extreme
movements in price are not hidden. Once calculated, smoothing can be applied to
the CMO, if desired;
- The scale is bounded between +100 and -100, thereby allowing you to clearly see
changes in net momentum using the 0 level. The bounded scale also allows you to
conveniently compare values across different securities.
WARNING:
- For purpose educate only
- This script to change bars colors.


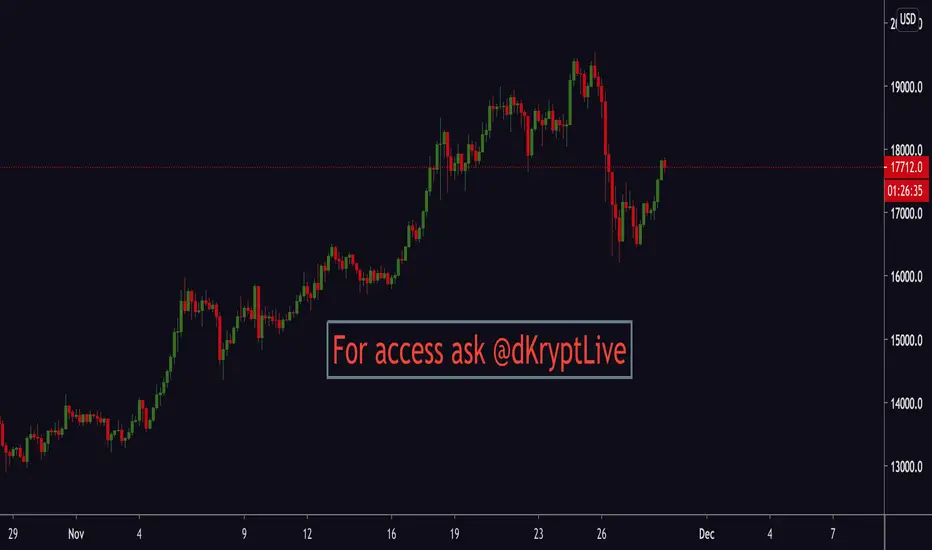
Magick CloudA leading indicator that predicts future price action and shows support and resistance.
Magick Cloud projects 21 bars into the future and uses Fibonacci to predict the targets.
A refreshed version of sKrypt Cloud made by @writner.
Created after testing ~8693 script versions in total and a month of hard work.
SWING POINTS HOUNDTry's to find possible swing points and reversal points using mutli time frame moving averages and Fibonacci retracement with multiple lengths. Can be used to gauge trends and find potential entry points for trend following strategies. Can also be used to find potential price reversal points and areas of heavy resistance/support.

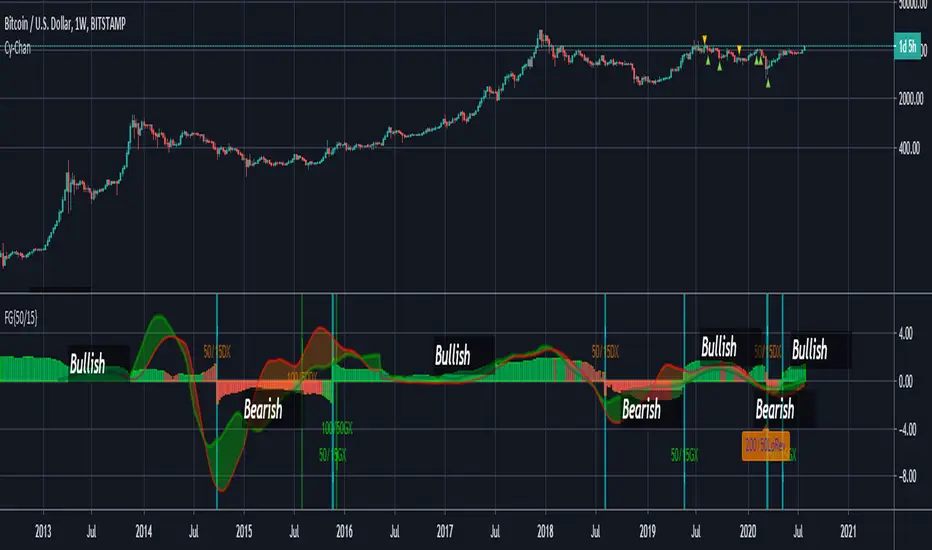
FUSIONGAPS V4 {50/15-Series}Base on the FUSIONGAPS oscillator series, but Only the 50/15 oscillator is plotted, and with Momentum and Acceleration oscillators added.
The thickest line is the FG oscillator: Red/Green coloring indicates if the market is in a Bearish/Bullish period.
The green colored line is the DFG oscillator (DIFFERENTIAL FUSIONGAPS: Price Momentum)
The red colored line is the D2FG oscillator (DOUBLE-DIFFERENTIAL FUSIONGAPS: Price Acceleration)
Indicators:
DeathCrosses ( DX ) and GoldenCrosses ( GX )
Momentum Reversal indicators (D2FG based filter applied to reduce false-positives, but can be manually disabled.)
~ * ~ * ~ * ~ * ~ * ~ * ~ * ~ * ~ * ~ * ~ * ~ * ~ * ~ * ~ * ~ * ~ * ~ * ~ * ~ * ~
Note:
In no way is this intended as a financial/investment/trading advice. You are responsible for your own investment decisions and trades.
Please exercise your own judgement for your own trades base on your own risk-aversion level and goals as an investor or a trader. The use of OTHER indicators and analysis in conjunction (tailored to your own style of investing/trading) will help improve confidence of your analysis, for you to determine your own trade decisions.
~ * ~ * ~ * ~ * ~ * ~ * ~ * ~ * ~ * ~ * ~ * ~ * ~ * ~ * ~ * ~ * ~ * ~ * ~ * ~ * ~
Please check out my other indicators sets and series, e.g.
LIVIDITIUM (dynamic levels),
AEONDRIFT (multi-levels standard deviation bands),
FUSIONGAPS (MA based oscillators),
MAJESTIC (Momentum/Acceleration/Jerk Oscillators),
PRISM (pSAR based oscillator, with RSI/StochRSI as well as Momentum/Acceleration/Jerk indicators),
PDF (parabolic SAR /w HighLow Trends Indicator/Bar-color-marking + Dynamic Fib Retrace and Extension Level)
and more to come.
Constructive feedback and suggestions are welcome.
~ JuniAiko
(=^~^=)v~
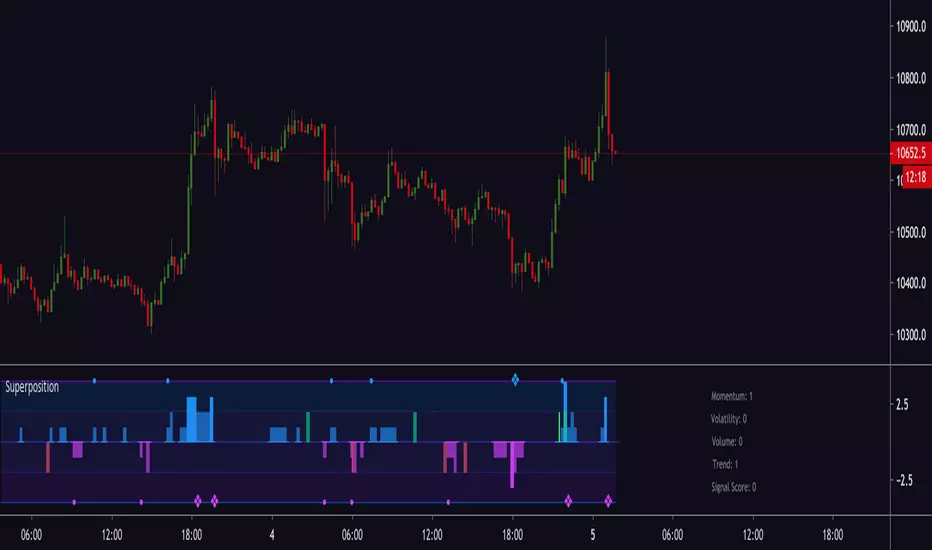
Magick SuperpositionExperimental histogram based on multi indicator signals.
Generates a score based on:
Trend
Volatility
Momentum
Price and volume changes
Candlestick patterns
and many more.
Can be used to detect top and bottoms, reversals, trend, best moments to enter a trade and more.
Invite-only.
Trial available.
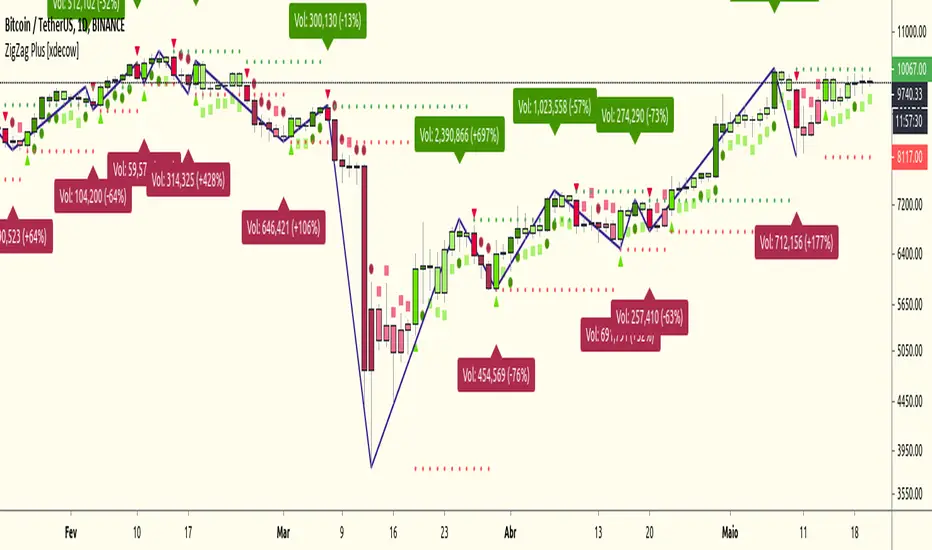
ZigZag Plus [xdecow]A ZigZag Like based on candle close.
A lot of options that can be hide in options.
Triangle/bright - reversal confirmation candle
Circle/dark - higher/lower candle breakout
Square/light - Insidebar
Combo Strategy 123 Reversal & CMO & WMA This is combo strategies for get a cumulative signal.
First strategy
This System was created from the Book "How I Tripled My Money In The
Futures Market" by Ulf Jensen, Page 183. This is reverse type of strategies.
The strategy buys at market, if close price is higher than the previous close
during 2 days and the meaning of 9-days Stochastic Slow Oscillator is lower than 50.
The strategy sells at market, if close price is lower than the previous close price
during 2 days and the meaning of 9-days Stochastic Fast Oscillator is higher than 50.
Second strategy
This indicator plots Chandre Momentum Oscillator and its WMA on the
same chart. This indicator plots the absolute value of CMO.
The CMO is closely related to, yet unique from, other momentum oriented
indicators such as Relative Strength Index, Stochastic, Rate-of-Change,
etc. It is most closely related to Welles Wilder?s RSI, yet it differs
in several ways:
- It uses data for both up days and down days in the numerator, thereby
directly measuring momentum;
- The calculations are applied on unsmoothed data. Therefore, short-term
extreme movements in price are not hidden. Once calculated, smoothing
can be applied to the CMO, if desired;
- The scale is bounded between +100 and -100, thereby allowing you to clearly
see changes in net momentum using the 0 level. The bounded scale also allows
you to conveniently compare values across different securities.
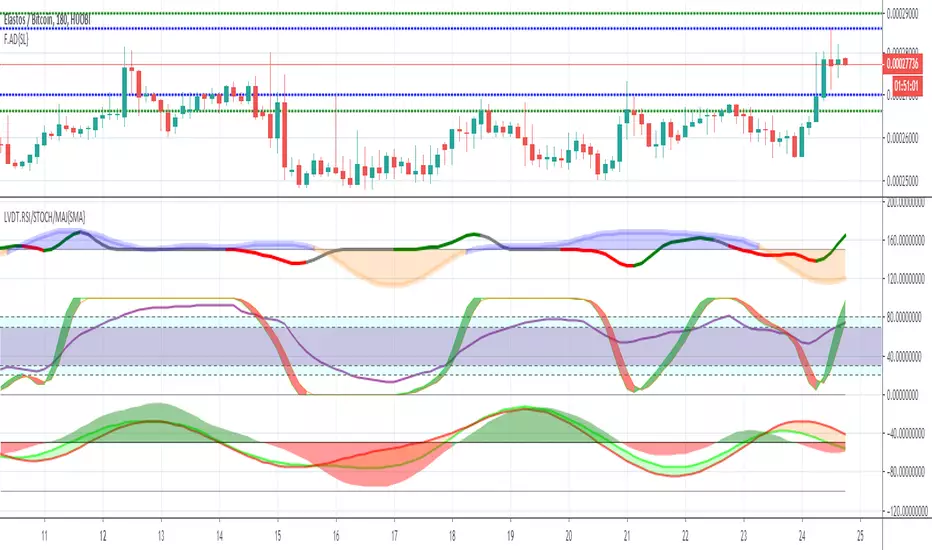
LIVIDITIUM RSI/STOCH/MAJ Oscillator Set {SMA}LVDT RSI oscillator
LVDT STOCHASTIC-RSI oscillator
LVDT MAJ (Momentum/Acceleration/Jerk) oscillators + signals ( Default = Disabled)
~JuniAiko
(=^~^=)v~
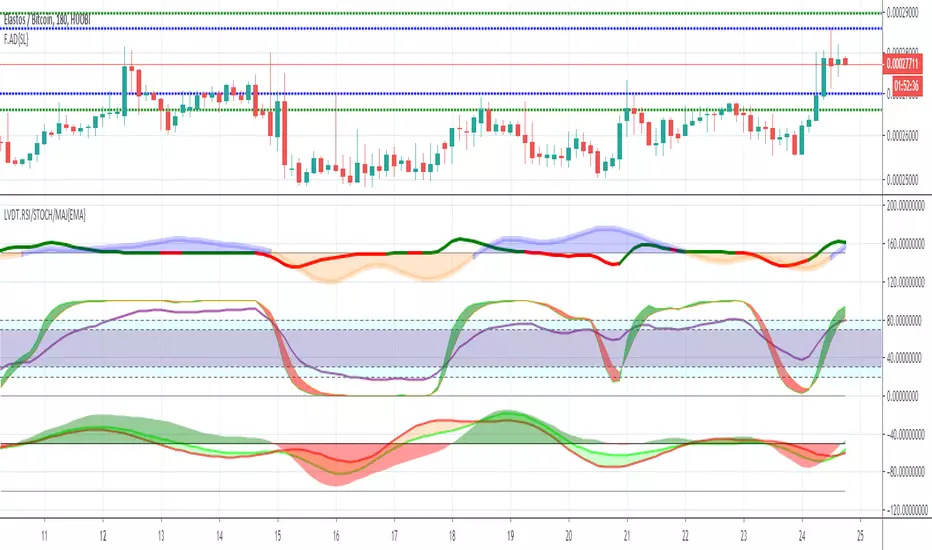
LIVIDITIUM RSI/STOCH/MAJ Oscillator Set {EMA}LVDT RSI oscillator
LVDT STOCHASTIC-RSI oscillator
LVDT MAJ (Momentum/Acceleration/Jerk) oscillators + signals ( Default = Disabled)
~JuniAiko
(=^~^=)v~
Combo Strategy 123 Reversal & Chande Momentum OscillatorThis is combo strategies for get a cumulative signal.
First strategy
This System was created from the Book "How I Tripled My Money In The
Futures Market" by Ulf Jensen, Page 183. This is reverse type of strategies.
The strategy buys at market, if close price is higher than the previous close
during 2 days and the meaning of 9-days Stochastic Slow Oscillator is lower than 50.
The strategy sells at market, if close price is lower than the previous close price
during 2 days and the meaning of 9-days Stochastic Fast Oscillator is higher than 50.
Second strategy
This indicator plots Chande Momentum Oscillator. This indicator was
developed by Tushar Chande. A scientist, an inventor, and a respected
trading system developer, Mr. Chande developed the CMO to capture what
he calls "pure momentum". For more definitive information on the CMO and
other indicators we recommend the book The New Technical Trader by Tushar
Chande and Stanley Kroll.
The CMO is closely related to, yet unique from, other momentum oriented
indicators such as Relative Strength Index, Stochastic, Rate-of-Change,
etc. It is most closely related to Welles Wilder`s RSI, yet it differs
in several ways:
- It uses data for both up days and down days in the numerator, thereby
directly measuring momentum;
- The calculations are applied on unsmoothed data. Therefore, short-term
extreme movements in price are not hidden. Once calculated, smoothing
can be applied to the CMO, if desired;
- The scale is bounded between +100 and -100, thereby allowing you to
clearly see changes in net momentum using the 0 level. The bounded scale
also allows you to conveniently compare values across different securities.
WARNING:
- For purpose educate only
- This script to change bars colors.