HTF Fibonacci on intraday ChartThis indicator plots Higher Timeframe (HTF) Fibonacci retracement levels directly on your intraday chart, allowing you to visualize how the current price action reacts to key retracement zones derived from the higher timeframe trend.
Concept
Fibonacci retracement levels are powerful tools used to identify potential support and resistance zones within a price trend.
However, these levels are often calculated on a higher timeframe (like Daily or Weekly), while most traders execute entries on lower timeframes (like 15m, 30m, or 1H).
This indicator bridges that gap — it projects the higher timeframe’s Fibonacci levels onto your current intraday chart, helping you see where institutional reactions or swing pivots might occur in real time.
How It Works
Select the Higher Timeframe (HTF)
You can choose which higher timeframe the Fibonacci structure is derived from — default is Daily.
Define the Lookback Period
The script looks back over the chosen number of bars on the higher timeframe to find the highest high and lowest low — the base for Fibonacci calculations.
Plots Key Fibonacci Levels Automatically:
0% (Low)
23.6%
38.2%
50.0%
61.8%
78.6%
100% (High)
Dynamic Labels
Each Fibonacci level is labelled on the latest bar, updating in real time as new data forms on the higher timeframe.
Best Used For
Intraday traders who want to align lower-timeframe entries with higher-timeframe structure.
Swing traders confirming price reactions around major Fibonacci retracement zones.
Contextual analysis for pullback entries, breakout confirmations, or retests of key levels.
Recommended Settings
Higher Timeframe: Daily (for intraday analysis)
Lookback: 50 bars (adjust based on volatility)
Combine with MACD, RSI, CPR, or Pivots for confluence.
License & Credits
Created and published for educational and analytical purposes.
Inspired by standard Fibonacci analysis practices.
Reversalzone

3 Bar Reversal3 Bar Reversal
This pattern is described in John Carter's "Mastering the Trade"
The 3 Bar Reversal indicator is a simple but effective price action tool designed to highlight potential short-term reversals in market direction. It monitors consecutive bar behavior and identifies turning points based on a three-bar pattern. This tool can assist traders in spotting trend exhaustion or early signs of a reversal, particularly in scalping or short-term trading strategies.
How It Works
This indicator analyzes the relationship between consecutive bar closes:
It counts how many bars have passed since the price closed higher than the previous close (barssince(close >= close )) — referred to as an "up streak".
It also counts how many bars have passed since the price closed lower than the previous close (barssince(close <= close )) — known as a "down streak".
A reversal condition is met when:
There have been exactly 3 bars in a row moving in one direction (up or down), and
The 4th bar closes in the opposite direction.
When this condition is detected, the script performs two actions:
Plots a triangle on the chart to signal the potential reversal:
A green triangle below the bar for a possible long (buy) opportunity.
A red triangle above the bar for a possible short (sell) opportunity.
Triggers an alert condition so users can set notifications for when a reversal is detected.
Interpretation
Long Signal: The market has printed 3 consecutive lower closes, followed by a higher close — suggesting bullish momentum may be emerging.
Short Signal: The market has printed 3 consecutive higher closes, followed by a lower close — indicating possible bearish momentum.
These patterns are common in market retracements and can act as confirmation signals when used with other indicators such as RSI, MACD, support/resistance, or volume analysis.
Usage Examples
Scalping: Use the reversal signal to quickly enter short-term trades after a short-term exhaustion move.
Swing Trading: Combine this with trend indicators (e.g., moving averages) to time pullbacks within larger trends.
Confirmation Tool: Use this indicator alongside candlestick patterns or support/resistance zones to validate entry or exit points.
Alert Setup: Enable alerts based on the built-in alertcondition to receive instant notifications for potential trade setups.
Limitations
The 3-bar reversal logic does not guarantee a trend change; it signals potential reversals, which may need confirmation.
Best used in conjunction with broader context such as trend direction, market structure, or other technical indicators.

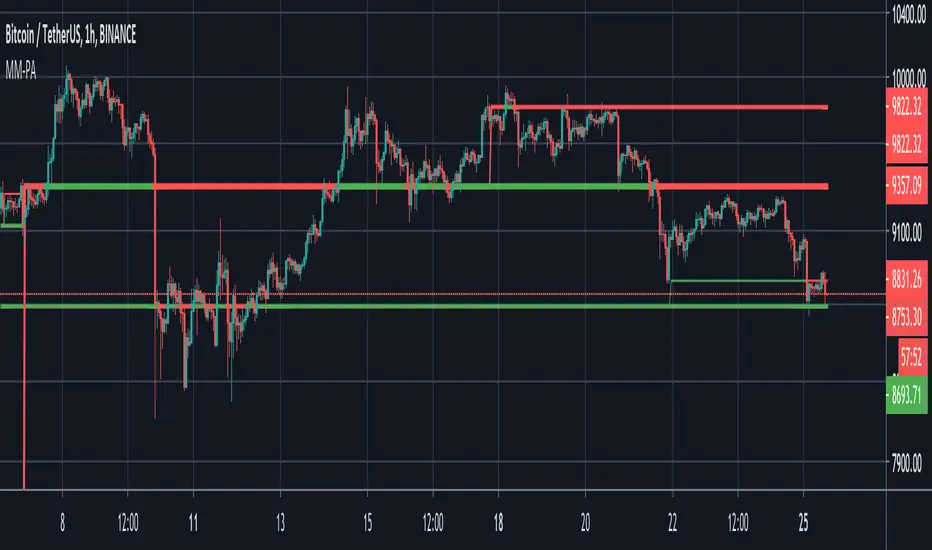
Cluster Reversal Zones📌 Cluster Reversal Zones – Smart Market Turning Point Detector
📌 Category : Public (Restricted/Closed-Source) Indicator
📌 Designed for : Traders looking for high-accuracy reversal zones based on price clustering & liquidity shifts.
🔍 Overview
The Cluster Reversal Zones Indicator is an advanced market reversal detection tool that helps traders identify key turning points using a combination of price clustering, order flow analysis, and liquidity tracking. Instead of relying on static support and resistance levels, this tool dynamically adjusts to live market conditions, ensuring traders get the most accurate reversal signals possible.
📊 Core Features:
✅ Real-Time Reversal Zone Mapping – Detects high-probability market turning points using price clustering & order flow imbalance.
✅ Liquidity-Based Support/Resistance Detection – Identifies strong rejection zones based on real-time liquidity shifts.
✅ Order Flow Sensitivity for Smart Filtering – Filters out weak reversals by detecting real market participation behind price movements.
✅ Momentum Divergence for Confirmation – Aligns reversal zones with momentum divergences to increase accuracy.
✅ Adaptive Risk Management System – Adjusts risk parameters dynamically based on volatility and trend state.
🔒 Justification for Mashup
The Cluster Reversal Zones Indicator contains custom-built methodologies that extend beyond traditional support/resistance indicators:
✔ Smart Price Clustering Algorithm: Instead of plotting fixed support/resistance lines, this system analyzes historical price clustering to detect active reversal areas.
✔ Order Flow Delta & Liquidity Shift Sensitivity: The tool tracks real-time order flow data, identifying price zones with the highest accumulation or distribution levels.
✔ Momentum-Based Reversal Validation: Unlike traditional indicators, this tool requires a momentum shift confirmation before validating a potential reversal.
✔ Adaptive Reversal Filtering Mechanism: Uses a combination of historical confluence detection + live market validation to improve accuracy.
🛠️ How to Use:
• Works well for reversal traders, scalpers, and swing traders seeking precise turning points.
• Best combined with VWAP, Market Profile, and Delta Volume indicators for confirmation.
• Suitable for Forex, Indices, Commodities, Crypto, and Stock markets.
🚨 Important Note:
For educational & analytical purposes only.

3 Drive Harmonic Pattern [TradingFinder] Three Drive Reversal🔵 Introduction
The Three Drive harmonic pattern closely resembles other price structures such as Wedge Pattern and Three Push Pattern, yet it stands out due to its precise use of Fibonacci ratios and symmetrical price movements.
This pattern comprises three consecutive and symmetrical price drives, each validated by key Fibonacci ratios (1.27 and 1.618), which help identify critical Potential Reversal Zones (PRZ).
Unlike the Wedge, which relies on converging trend lines and can indicate either continuation or reversal, and the Three Push, which lacks defined Fibonacci ratios and symmetry, the Three Drive pattern defines PRZ with greater accuracy, providing traders with high-probability trading opportunities.
This pattern appears in both bullish and bearish trends. After the completion of the third drive (Drive 3), it signals the market's readiness to reverse direction. The PRZ in this pattern serves as a crucial zone where price is highly likely to reverse, offering a strategic point for entering or exiting trades. Professional traders utilize the Three Drive pattern and PRZ as essential tools for analyzing and capitalizing on potential market reversals.
Bullish Pattern :
Bearish Pattern :
🔵 How to Use
The Three Drive harmonic pattern is an effective tool for identifying potential reversal points in the market. By utilizing Fibonacci extension levels (1.27 and 1.618) and focusing on the pattern’s symmetry, traders can pinpoint Potential Reversal Zones (PRZ) where the price is likely to change direction. This pattern works in both bearish and bullish scenarios, each with distinct characteristics and trading opportunities.
🟣 Bullish Three Drive Pattern
The bullish Three Drive pattern develops during a downtrend, indicating a potential reversal to the upside. Similar to its bearish counterpart, this pattern features three consecutive downward price movements (drives) with retracements in between. The third drive concludes within the PRZ, which serves as a strong support zone where the price is expected to reverse upwards.
The first drive begins with a downward movement, followed by a retracement to the 0.618 Fibonacci level. The second drive continues downward to reach a 1.27 or 1.618 Fibonacci extension of the retracement. Finally, the third drive aligns with the PRZ, where a confluence of Fibonacci levels creates a high-probability support zone.
In the PRZ, traders look for bullish confirmation signals such as bullish candlestick patterns (e.g., bullish engulfing or pin bars) or increasing trading volume. Once confirmation is observed, the PRZ becomes an ideal entry point for a buy position. Stop-loss orders are placed slightly below the PRZ to minimize risk, while take-profit targets are set at key resistance levels or Fibonacci retracement levels.
🟣 Bearish Three Drive Pattern
The bearish Three Drive pattern forms during an uptrend, signaling a potential reversal to the downside. This pattern consists of three consecutive upward price movements (drives) and intermediate retracements. Each drive aligns with Fibonacci extension levels, and the third drive ends within the PRZ, indicating a high probability of a bearish reversal.
In the first drive, the price moves upward and then retraces to approximately the 0.618 Fibonacci retracement level, forming the base for the second drive. The second drive then extends upward to the 1.27 or 1.618 Fibonacci extension of the preceding retracement. This process repeats for the third drive, which reaches the PRZ, typically defined by the convergence of Fibonacci levels from previous drives.
Once the PRZ is identified, traders look for confirmation signals such as bearish candlestick patterns (e.g., bearish engulfing or pin bars) or declining trading volume. If confirmation is present, the PRZ becomes an optimal zone for entering a sell position. Stop-loss levels are typically placed slightly above the PRZ to protect against pattern failure, and take-profit targets are set at key support levels or Fibonacci retracement levels of the overall structure.
🟣 Three Drive Vs Wedge Pattern Vs 3 Push pattern
The Three Drive, Wedge, and Three Push patterns are all used to identify potential price reversal points, but they differ significantly in structure and application. The Three Drive pattern is based on three consecutive and symmetrical price movements, validated by precise Fibonacci ratios (1.27 and 1.618), to define Potential Reversal Zones (PRZ).
In contrast, the Wedge pattern relies on converging trend lines and does not require Fibonacci ratios; it can act as either a reversal or continuation pattern. Meanwhile, the Three Push pattern shares similarities with Three Drive but lacks precise symmetry and Fibonacci-based validation.
Instead of a PRZ, Three Push focuses on identifying areas of support and resistance, often signaling weakening momentum in the current trend. Among these, the Three Drive pattern is more reliable for pinpointing high-probability reversal zones due to its strict Fibonacci-based and symmetrical structure.
🔵 Setting
🟣 Logical Setting
ZigZag Pivot Period : You can adjust the period so that the harmonic patterns are adjusted according to the pivot period you want. This factor is the most important parameter in pattern recognition.
Show Valid Format : If this parameter is on "On" mode, only patterns will be displayed that they have exact format and no noise can be seen in them. If "Off" is, the patterns displayed that maybe are noisy and do not exactly correspond to the original pattern.
Show Formation Last Pivot Confirm : if Turned on, you can see this ability of patterns when their last pivot is formed. If this feature is off, it will see the patterns as soon as they are formed. The advantage of this option being clear is less formation of fielded patterns, and it is accompanied by the latest pattern seeing and a sharp reduction in reward to risk.
Period of Formation Last Pivot : Using this parameter you can determine that the last pivot is based on Pivot period.
🟣 Genaral Setting
Show : Enter "On" to display the template and "Off" to not display the template.
Color : Enter the desired color to draw the pattern in this parameter.
LineWidth : You can enter the number 1 or numbers higher than one to adjust the thickness of the drawing lines. This number must be an integer and increases with increasing thickness.
LabelSize : You can adjust the size of the labels by using the "size.auto", "size.tiny", "size.smal", "size.normal", "size.large" or "size.huge" entries.
🟣 Alert Setting
Alert : On / Off
Message Frequency : This string parameter defines the announcement frequency. Choices include: "All" (activates the alert every time the function is called), "Once Per Bar" (activates the alert only on the first call within the bar), and "Once Per Bar Close" (the alert is activated only by a call at the last script execution of the real-time bar upon closing). The default setting is "Once per Bar".
Show Alert Time by Time Zone : The date, hour, and minute you receive in alert messages can be based on any time zone you choose. For example, if you want New York time, you should enter "UTC-4". This input is set to the time zone "UTC" by default.
🔵 Conclusion
The Three Drive pattern is a highly effective harmonic tool for identifying potential reversal points in the market. By leveraging its symmetrical structure and precise Fibonacci ratios (1.27 and 1.618), this pattern provides traders with clear entry and exit signals, enhancing the accuracy of their trades.
Whether in bullish or bearish scenarios, the identification of the Potential Reversal Zone (PRZ) serves as a critical aspect of this pattern, enabling traders to anticipate price movements with greater confidence.
Compared to similar patterns like Wedge and Three Push, the Three Drive pattern stands out for its stringent reliance on Fibonacci levels and symmetrical price movements, making it a more robust choice for forecasting reversals. However, as with any technical analysis tool, its effectiveness increases when combined with confirmation signals, such as candlestick patterns, volume analysis, and broader market context.
Mastering the Three Drive pattern requires practice and attention to detail, especially in accurately defining the PRZ and ensuring the pattern adheres to its criteria. Traders who consistently apply this pattern as part of a comprehensive trading strategy can capitalize on high-probability opportunities and improve their overall performance in the market.

Deep Crab Harmonic Pattern [TradingFinder] Reversal Zones🔵 Introduction
The Deep Crab pattern is a 5-point extension harmonic structure (X-A-B-C-D) used in technical analysis to identify potential reversal points in financial markets. Like the original Crab pattern, it heavily relies on a 1.618 XA projection to form the Potential Reversal Zone (PRZ).
However, the key difference lies in the B point, which must be an 0.886 retracement of the XA leg. The D point in this pattern typically extends beyond the X point, signaling a strong potential reversal in price movement.
Bullish Deep Crab :
The Bullish Deep Crab is a pattern used in technical analysis to spot potential trend reversals. It signals a shift from a downtrend to an uptrend. Traders enter a buy position at the D point and set a stop-loss below point X, anticipating a price increase.
Bearish Deep Crab :
The Bearish Deep Crab is a reversal pattern that indicates the potential end of an uptrend. Traders enter a sell position at point D and set a stop-loss above point X, expecting the price to fall afterward.
🟣 Crab Vs Deep Crab
The Crab and Deep Crab patterns are both used to identify reversal points in technical analysis, but they differ in terms of correction depth :
Crab : The B point retraces between 38.2% to 61.8% of the XA leg, and point D extends beyond X, indicating a price reversal after a smaller correction.
Deep Crab : The B point retraces more deeply, around 88.6% of the XA leg, and point D has a stronger extension, signaling a reversal after a deeper correction.
The Deep Crab is more suited for identifying stronger price movements.
🔵 How to Use
To effectively use the Deep Crab pattern, it’s essential to correctly identify its five key points (X, A, B, C, and D) based on Fibonacci retracements and extensions. Traders look for a deep retracement at point B, followed by an extended move to point D, which typically signals a strong price reversal.
Once these points are established, traders can strategically enter positions at point D with appropriate stop-loss and take-profit levels, capitalizing on the anticipated market reversal. Proper use of Fibonacci tools is crucial for accurate pattern identification.
🟣 Bullish Deep Crab
To use the Bullish Deep Crab pattern, a trader identifies point D as the key price reversal point in a downtrend. Using Fibonacci tools, points X, A, B, and C are identified, with point B showing an 88.6% retracement of XA, and CD extending 1.618% of XA.
The trader enters a buy position at point D and sets a stop-loss below X, expecting a reversal from a downtrend to an uptrend.
🟣 Bearish Deep Crab
In the Bearish Deep Crab pattern, point D acts as the reversal point in an uptrend. After identifying points X, A, B, and C, D extends 1.618% of XA. Point B retraces 88.6% of XA. Traders enter a sell position at point D and place a stop-loss above X, anticipating a drop in price.
🔵 Setting
🟣 Logical Setting
ZigZag Pivot Period : You can adjust the period so that the harmonic patterns are adjusted according to the pivot period you want. This factor is the most important parameter in pattern recognition.
Show Valid Forma t: If this parameter is on "On" mode, only patterns will be displayed that they have exact format and no noise can be seen in them. If "Off" is, the patterns displayed that maybe are noisy and do not exactly correspond to the original pattern.
Show Formation Last Pivot Confirm : if Turned on, you can see this ability of patterns when their last pivot is formed. If this feature is off, it will see the patterns as soon as they are formed. The advantage of this option being clear is less formation of fielded patterns, and it is accompanied by the latest pattern seeing and a sharp reduction in reward to risk.
Period of Formation Last Pivot : Using this parameter you can determine that the last pivot is based on Pivot period.
🟣 Genaral Setting
Show : Enter "On" to display the template and "Off" to not display the template.
Color : Enter the desired color to draw the pattern in this parameter.
LineWidth : You can enter the number 1 or numbers higher than one to adjust the thickness of the drawing lines. This number must be an integer and increases with increasing thickness.
LabelSize : You can adjust the size of the labels by using the "size.auto", "size.tiny", "size.smal", "size.normal", "size.large" or "size.huge" entries.
🟣 Alert Setting
Alert : On / Off
Message Frequency : This string parameter defines the announcement frequency. Choices include: "All" (activates the alert every time the function is called), "Once Per Bar" (activates the alert only on the first call within the bar), and "Once Per Bar Close" (the alert is activated only by a call at the last script execution of the real-time bar upon closing). The default setting is "Once per Bar".
Show Alert Time by Time Zone : The date, hour, and minute you receive in alert messages can be based on any time zone you choose. For example, if you want New York time, you should enter "UTC-4". This input is set to the time zone "UTC" by default.
🔵 Conclusion
The Deep Crab pattern is a valuable reversal tool in technical analysis, known for its deep retracement and extended price movements.
Unlike other harmonic patterns, it emphasizes identifying critical points where price action is likely to reverse sharply. This pattern works well in both bullish and bearish market scenarios, offering clear signals for entry and exit points.
However, successful application requires a deep understanding of market behavior and precise use of technical tools like Fibonacci retracement. Overall, mastering this pattern can enhance trading strategies and risk management.

Swing Failure Zones and Signals [AlgoAlpha]Elevate your trading strategy with the Swing Failure Zones and Signals indicator by AlgoAlpha! This powerful tool helps you identify potential swing failure zones, offering clear bullish and bearish signals to guide your trading decisions. 📈💡
🎨 Bullish/Bearish Color Customization : Easily set the colors for bullish and bearish signals to match your chart preferences.
🧹 Mitigated Zone Removal : Option to remove mitigated zones from the chart for a cleaner view.
🔍 Range High/Low Lookback : Adjustable lookback period for determining significant highs and lows.
🖌 Dynamic Zone Creation : Automatically draws zones based on swing failure criteria.
🔔 Alert Conditions : Set alerts for both bullish and bearish swing failure conditions to stay informed without constant monitoring.
Quick Guide to Using the Swing Failure Zones and Signals Indicator
🛠 Add the Indicator : Search for "Swing Failure Zones and Signals " in TradingView's Indicators & Strategies. Customize settings like lookback period, colors, and zone removal options to fit your trading style.
📊 Market Analysis : Watch for the appearance of the zones and the directional arrows for potential reversal signals. Use these signals to identify key market entries and exits.
🔔 Alerts : Enable alerts for bullish and bearish swing failure conditions to capture trading opportunities without constant chart monitoring.
How it works
The indicator calculates the direction and length of each candle to identify swing failure points by comparing current high and low prices with those from the lookback period. A bullish swing failure is detected when the current low is lower than the previous low and the close is higher than the previous high, while a bearish swing failure occurs when the current high is higher than the previous high and the close is lower than the previous low. Upon detection, the script creates zones on the chart to indicate these failure points and manages them by removing invalidated zones based on the user's settings. Visual signals are plotted on the chart as arrows, and alerts are set for these conditions to help traders capture potential entry opportunities efficiently.
Enhance your trading edge with this robust tool designed to spotlight critical swing failure points in the market! 💪📈

Reversal Confirmations [QuantVue]The Reversal Confirmation Indicator is based on price action and looks to provide opportunities when price gets stretched.
The indicator works by finding the highest and lowest points over the user selected lookback period.
If price closes below the low of the highest bar or closes above the high of the lowest bar a possible reversion to the mean may occur and the indicator will plot a triangle and fire an alert.
This indicator works a reversion to the mean or to potentially time entries in trending markets.
Fully customizable settings:
🔹Lookback Period
🔹Colors
🔹Show / hide upper & lower channels
🔹Show / hide the mean
Give this indicator a BOOST and COMMENT your thoughts!
We hope you enjoy.
Cheers!

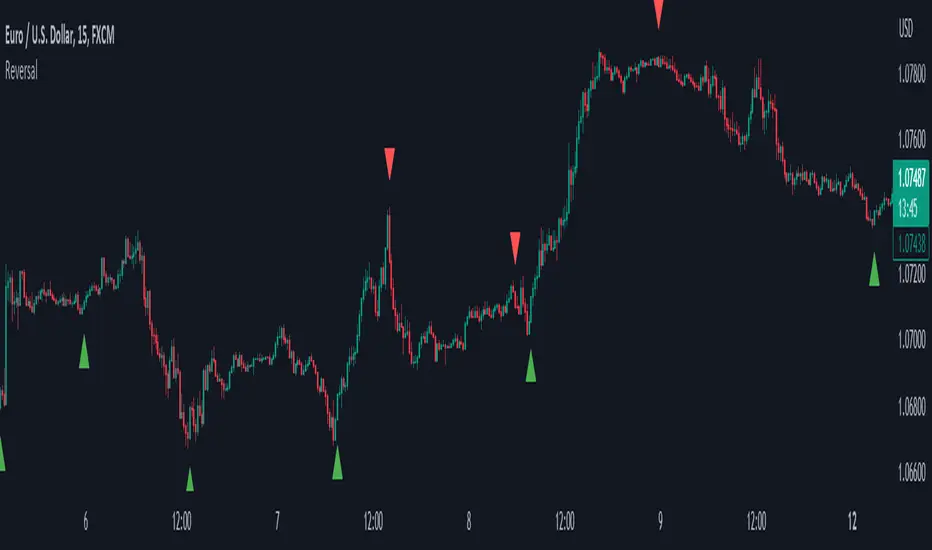
ReversalThe primary objective of this indicator is to discern candles that exhibit characteristics suggestive of potential market reversals through the application of candlestick analysis. Extensive observation across various assets and timeframes has revealed the existence of a recurrent reversal pattern. This pattern typically manifests as a sequence of one to three candles that abruptly diverge from the prevailing price action or trend, offering a distinctive signal indicating a potential reversal.
By leveraging the insights gained from this observation, the indicator aims to assist traders in identifying these noteworthy candle patterns that hold the potential to indicate significant market shifts.
The indicator operates as follows: initially, it identifies the lowest close (in the case of a bullish reversal) or the highest close (in the case of a bearish reversal) within a specified number of previous candles, as determined by user input (referred to as "Candle Lookback").
Next, the indicator examines whether the closing price surpasses the high of the previously identified lowest (bullish reversal) or highest (bearish reversal) closed candle within a designated number of candles, as specified by the user (referred to as "Confirm Within").
Reversal Points [CC]This original script was created based on a suggestion from @kerpiciwuasile. My original Reversal Points script was removed because I modeled it after an indicator by Demark, but this script will have no such issues. Reversal points are an exciting concept for me because it is such a useful tool when placing trades. This is my first attempt at a new overall layout for my script and I included a bunch of customization so let me know what you think.
My script works by finding lows that are surrounded by bars that have higher lows and highs that are surrounded by lower highs. I use this logic to find short term lows or highs and I use the same concept to find mid-term lows or highs but a mid-term high is a short term high surrounded by lower short term highs and a mid-term low is a short term low surrounded by higher short term lows. And of course this means that long term highs or lows use the same logic to find highs or lows that are surrounded by mid-term highs or lows. I would recommend to buy at the long term low points or sell at the long term high points.
Keep in mind of course that short term highs and lows are very common and reversal points will get rarer as you look for longer term reversal points. I would recommend to experiment and see which reversal points work best for you and of course, know that there is no magical formula to use for all stocks.
Also there are a few scenarios where you want to enable or disable the inside bar setting. You would want to ignore inside bars if the market is currently very volatile or if you are using this indicator on a crypto chart. This is not an exact science but more of a recommendation, so feel free to experiment with it.
Reversal points are crucial for traders as they signal a potential change in the market trend, providing opportunities for entry or exit.
In summary, this code snippet is a powerful tool for traders to detect and visualize reversal points on a trading chart, providing valuable insights into potential trend changes and facilitating more informed trading decisions.
Let me know if you would like me to publish other scripts or if you want me to do something custom for you!

Trend IndicatorThis indicator has different features:
1. Ichimoku = this indicator can plot Ichimoku calculated both in the common formula and with the volume average, you can choose the calculator method for each line.
2. Channel and Bands = this mode allows the user to choose from channel and band, "channel" shows the Keltner channel, and "band" shows the Bollinger bands. Both the indicators are calculated including the volume in the formula of the average midpoint.
3. Color candle = this function allows the user to see two different colors of candles on the chart, the positive color occurs when both the long-term average and the short team average of price calculated using the volume is above the two averages calculated without the volume. This function is great to analyze the volume pressure, useful to identify trend continuation and exhaustion.
4. Extreme reversal zones = this is a version of the Keltner channels calculated over a high number of candles and with high deviation, to identify the potential zones of reversal.
Note that in the "Ichimoku" indicator, the backline is the T.R.A.M.A. indicator, created and published open source by Lux Algo, which I thank for the script.

Volume Weighted Reversal BandsThis is a vwap & vwma hybrid with upper & lower deviation bands that provide excellent price channels and reversal areas. It can be used on lower & higher timeframes, just increase the deviation % for higher timeframes. Try out the 1 minute timeframe with .5% deviation for great scalping levels.
Here is the calculation used for the main line.
(VWMA100 + VWMA500 + VWMA1000 + VWAP) / 4
So it combines 3 VWMAs with the VWAP and divides that number by 4 to give us a moving average. Then we add new levels above and below that moving average to get our channels. The channels are separated by the % deviation you choose in the settings. For tighter bands, lower the percentage deviation and for wider bands, increase the percentage deviation.
The fattest line in the middle is the main moving average and you can expect price to regularly return to this level. The thick lines are the main moving average plus or minus the percentage deviation you have set. There are 10 levels in each direction from the main moving average. The is also a thin short term moving average as well with a custom calculation. It takes 4 different length moving averages that are weighted and 4 more that are volume weighted and divides the total by 8.The lines will be green when price is above the line and red when price is below the line. The thin white line is the VWAP on its own.
These lines will act as dynamic support and resistance so you can scalp them back and forth. These levels work so well because they are volume weighted and the algos hedge their positions back and forth constantly.
For best results, use this indicator on tickers with the highest volume and trading action as the price will stick to these levels better when the big money players are hedging. Some great tickers for this indicator are APPL, SPY, BTC, ETH.
All colors and linewidths can be customized in the settings easily as well as turning off the VWAP or short moving average and adjusting the percentage deviation for the channels.
***MARKETS***
This indicator can be used on all markets, including stocks, crypto, futures and forex.
***TIMEFRAMES***
This indicator can be used on all timeframes.
***TIPS***
Try using numerous indicators of ours on your chart for extra confirmation. Our favorites to pair with these bands are the Scalper Ribbon and Trend Friend Signals. The 3 combined give you a lot of extra confirmation on whether the market is going to reverse at these levels.

ATR Trend Bands [Misu]█ This indicator shows an upper and lower band based on price action and ATR (Average True Range)
The average true range (ATR) is a market volatility indicator used in technical analysis.
█ Usages:
The purpose of this indicator is to identify changes in trends and price action.
It is mainly used to identify breaking points and trend reversals.
But it can also be used to show resistance or support levels.
█ Features:
> Buy & Sell Alerts
> Buy & Sell Labels
> Color Bars
> Show Bands
█ Parameters:
Length: Length is used to calculate ATR.
Atr Multiplier: A factor used to balance the impact of the ATR on the Trend Bands calculation.

Price Pivots for NSE Index & F&O StocksPrice Pivots for NSE Index & F&O Stocks
What is this Indicator?
• This indicator calculates the price range a Stock or Index can move in a Day, Week or Month.
Advantages of this Indicator
• This is a Leading indicator, not Dynamic or Repaint.
• Helps to identify the tight range of price movement.
• Can easily identify the Options strike price.
• The levels are more reliable and authentic than Gann Square of 9 Levels.
• Develops a discipline in placing Targets.
Disadvantages of this Indicator
• The indicator is specifically made for National Stock Exchange of India (NSE) listed index and stocks.
• The indicator is calculated only for index NIFTY, BANKNIFTY, FINNIFTY, MIDCPNIFTY and Stocks listed in Futures and Options.
• The indicator shows nothing for other indexes and stocks other than above mentioned.
• The data need to be entered manually.
• The data need to be updated manually when the F&O listed stocks are updated.
Who to use?
Highly beneficial for Day Traders, it can be used for Swing and Positions as well.
What timeframe to use?
• Any timeframe.
• The highlighted levels in Red and Green will not show correct levels in 1 minute timeframe.
• 5min is recommended for Day Traders.
When to use?
• Wait for proper swing to form.
• Recommended to avoid 1st 1 hour or market open, that is 9.15am to 10.15 or 10.30am.
• Within this time a proper swing will be formed.
How to use?
Entry
• Enter when the Price reach closer to the Blue line.
• Enter Long when the Price takes a pullback or breakout at the Red lines.
Exit
• Exit position when the Price reach closer to the Red lines in Long positions.
What are the Lines?
Gray Lines:
• Every lines with price labels are the Strike Prices in the Option Chain from NSE website.
• Price moves from 1 Strike Price level to another.
• The dashed lines are average levels of 2 Strike Prices.
Red & Green Lines:
• The Red and Green Lines will appear only after the first 1 hour.
• The levels are calculated based on the 1st 1 hour.
• Red Lines are important Resistance levels, these are strong Bearish reversal points. It is also a breakout level, this need to be figured out from the past levels, trend, percentage change and consolidation.
• Green Lines are important Support levels, these are strong Bullish reversal points. It is also a breakdown level, this need to be figured out from the past levels, trend, percentage change and consolidation.
What are the Labels?
• First Number: Price of that level.
• Numbers in (): Percentage change and Change of price from LTP(Last Traded Price) to that Level.
How to use?
Entry:
• Enter when price is closer to the Red or Green lines.
• Enter after considering previous Swing and Trend.
• Note the 50% of previous Swing.
• Enter Short when price reverse from each level.
• If 50% of swing and the pivot level is closer it can be a good entry.
Exit:
• Use the logic of Entry, each level can be a target.
• Exit when price is closer to the Red or Green lines.
Indicator Menu
Source
• Custom: Enter the price manually after choosing the Source as Custom to show the Pivots at that price.
• LTP: Pivot is calculated based on Last Traded Price.
• Day Open: Pivot is calculated based on current day opening price.
• PD Close: Pivot is calculated based on previous day closing price.
• PD HL2: Pivot is calculated based on previous day average of High and Low.
• PD HLC3: Pivot is calculated based on previous day average of High, Low and Close.
"Time (IST) (Vertical)"
• This is a marker of every 1 hour.
• Usually major price movement happen between previous day last 1 hour (2:15 pm) to today first 1 hour (10:15 pm).
• Two swings can happen between first 2 hour of current day.
• At the end of the day last 1 hour from 2.15 pm another important movement will happen.
• Usually rest of the time won't show any interesting movement.
To the Users
• Certain symbols may show the levels as a single line. For such symbols choose a different Source or Timeframe from the indicator menu.
• Please inform if any of the Symbol's price levels don't react to the pivots, include the Symbol a well.
• Also inform if you notice any wrong values, errors or abnormal behavior in the indicator.
• Feel free to suggest or adding new features and options.
General Tips
• It is good if Stock trend is same as that of NIFTY trend.
• Lots of indicators creates lots of confusion.
• Keep the chart simple and clean.
• Buy Low and Sell High.
• Master averages or 50%.
• Previous Swing High and Swing Low are crucial.

Wick Pressure by SiddWolfMultiple Wicks forming at OverSold & OverBought levels create Buying and Selling Pressure. This Script tries to capture the essence of the buy and sell pressure created by those wicks. Wick pressure shows that the trend is Exhausted.
How it works:
This Wick Pressure Indicator checks for three candles forming the wicks in overbought and oversold zones. The zones are set by RSI and can be changed in settings. Those three candles should form a bit long wick and length of the wick is determined by ATR. The ATR multiple can be changed from settings. And then the script draws a box in the area formed by three candle wicks.
Confluence:
This indicator should not be used on its own. You should include it in your existing trading strategy. Any indicator should be rigorously tested before making any real trades.
Settings is the Key:
Settings are key to all of my indicators. Play around with it a bit. Change the ATR multiplier. Read the tooltips to understand what each settings mean. Tooltips are the (i) button in-front of each settings.
FAQs:
Q. Does the indicator Repaint ?
--- No. None of my indicators repaints. What you see now is what's drawn in real time.
Q. Indicator doesn't show anything ?
--- Maybe you've messed up the settings so reset it. or try different coin/stock.
Q. Does this indicator give financial advice?
--- No. Nope. Nein. Não. नहीं.
Conclusion:
This indicator is very basic but if used correctly it can be very powerful. Hit me up if you'd like to see the screener/scanner for this or any of my indicators. If you have any questions or suggestions feel free to comment below. I'd love to connect with you. Thank you.
~ SiddWolf

Reversal zone finderThis script would find potential reversal price zones according to RSI over bought or sell condition and big reversal candle.
It works better in range markets and lower time frames like 5M and especially in Support/Resistance zones.
Suit for scalping in forex or crypto markets.
* Use it as a trade assistant not a trade signal!