RSI Momentum & Trend Suite - O59 Elite QuantRSI Momentum & Trend Suite – O59 Elite Quant
Professional Market Structure & Momentum Analysis Tool
RSI Momentum & Trend Suite – O59 Elite Quant is a comprehensive technical analysis indicator designed to help traders better understand market momentum, trend structure, price reactions, and key support & resistance zones directly on the chart.
This indicator combines RSI-based momentum analysis, dynamic bar coloring, price action signals, and automatic trend & support/resistance detection into a single, clean visual framework.
🔹 Momentum & Bar Coloring Logic
The indicator includes a custom RSI momentum engine that evaluates short-term price changes and momentum strength.
Candles are automatically colored when momentum reaches critical zones:
Above 70 → Strong bullish momentum
Below 30 → Strong bearish momentum
This candle coloring helps traders instantly recognize momentum extremes without switching to a separate RSI pane.
🔺 Buy & Sell Triangle Signals
The script generates triangle-based buy and sell signals based on a combination of:
RSI oversold / overbought conditions
Short-term price action behavior
Candle structure and confirmation logic
These signals are intended to highlight potential reaction zones, not to predict the market.
They work best when used together with trend direction and support/resistance levels.
📈 Automatic Trend Detection
The indicator automatically identifies ascending and descending trend structures using pivot-based swing analysis.
Trendlines are drawn dynamically based on higher lows and lower highs
Broken trendlines are automatically removed to keep the chart clean
Both bullish and bearish trends are visually distinguished
This allows traders to quickly assess whether the market is trending or losing structure.
🟦 Dynamic Support & Resistance Levels
Key support and resistance levels are detected using recent pivot points:
Levels extend forward in real time
Broken levels are removed automatically
Helps identify potential reaction, rejection, and liquidity zones
These levels are designed to adapt continuously as market structure evolves.
🧾 Information Table & Visual Themes
A customizable information table is displayed on the chart, showing:
Indicator name
Current symbol
Active timeframe
Author branding
Users can choose between multiple visual themes, allowing better readability and personal preference while maintaining a professional appearance.
⚠️ Important Notes & Risk Disclaimer
This indicator is designed as a technical analysis support tool only.
It does not provide financial advice
Signals and visual elements should not be used alone
Always confirm signals with your own strategy, risk management, and market context
⚠️ Special caution is advised during:
Low-volume sessions
Weekend price action
High-impact news events
Thin liquidity hours
Market conditions during these periods may produce false signals or reduced reliability.
📌 Final Disclaimer
This indicator is for educational and analytical purposes only.
It is not investment advice.
All trading decisions remain the sole responsibility of the use
RS

RS Proxy Suite (Sector-Weighted) - by kuokkuokIndicator Description
RS Proxy Suite (Sector-Weighted) is a Pine Script indicator for TradingView, designed for stock traders to calculate a stock's Relative Strength (RS) proxy score. This indicator simulates a market proxy universe by weighting multiple sector ETFs, evaluating a stock's strength relative to a benchmark like the SPX. Inspired by the M.E.T.S. (Multiple Edge Trading Strategy) system, it helps users identify market-leading stocks, potential breakout opportunities, and low-risk entry points.
Key Features and Benefits:
RS Proxy Rating (1–99 Score): Computes the stock's RS score (higher is stronger), aiding in screening super-strong stocks. A score above 80 indicates the stock outperforms most peers, making it a prime buy candidate.
RS Line and Blue Dot Divergence: Displays the RS line trend and marks RS-leading new high divergences. This acts like an "early warning light," signaling potential low-risk entries (e.g., when RS hits a new high but price hasn't caught up yet).
Sector-Weighted Design: Integrates Growth, Cyclical, Defensive, and Policy ETFs to simulate a comprehensive market environment. Weights are adjustable for flexibility across market phases.
Dashboard Display: A concise panel shows RS Rating, RS Trend, and Blue Dot status for quick decision-making.
Application Scenarios: Ideal for technical analysts to screen leaders, spot trend reversals, or confirm breakouts with VCP patterns (Volatility Contraction Patterns). Its strength lies in avoiding single-index bias for more stable RS assessments.
This indicator avoids subjective judgments, relying on quantitative momentum calculations to help traders "go with the flow" and reduce false breakout risks. Shared for community use—feedback welcome for improvements.
User Manual -
This manual guides you on installing and using the RS Proxy Suite (Sector-Weighted) indicator on TradingView. It's suited for daily or weekly charts, applicable to US stocks or markets correlated with SPX. Ensure your TradingView account supports Pine Script v6.
1. Installation Steps
Step 1: Log in to TradingView and open the Chart page.
Step 2: Click the "Indicators" button in the top toolbar, search for "RS Proxy Suite (Sector-Weighted)" (or paste the Pine Script code into the Pine Editor and add it).
Step 3: If installing from the Community Scripts library, click "Add to Chart"; for custom code, save and add to the chart.
Step 4: The indicator will appear below the chart (overlay=false). Confirm no error messages.
2. Parameter Adjustment Guide
The indicator offers multiple input parameters in TradingView's "Settings" panel. Defaults are optimized, but adjust based on market conditions. Here's a grouped breakdown:
Data Source:
Market Index SPX: Default "SP:SPX", changeable to other indices (e.g., "TVC:NDX").
Calculation Price: Default close (closing price), switch to high/low/open for sensitivity tweaks.
RS Momentum Periods (Adjustable):
Short Term (Default 63 days): Short-term momentum; larger values smooth it out.
Medium Term (Default 126 days): Mid-term momentum.
Long Term (Default 252 days): Long-term momentum for capturing major trends.
Momentum Weights:
Short Term Weight: Default 0.4, emphasizes recent performance.
Medium Term Weight: Default 0.2.
Long Term Weight: Default 0.4. Sum doesn't need to be 1; system normalizes automatically.
Sector Weights: Each ETF weight is independently adjustable (step 0.1). Defaults reflect sector importance, e.g., higher for growth ETFs.
XLK Weight (Technology): Default 1.5.
SOXX Weight (Semiconductors): Default 1.3.
XLY Weight (Consumer Discretionary): Default 1.2.
XLC Weight (Communication Services): Default 1.1.
XLG Weight (Large Cap Growth): Default 1.3.
XLI Weight (Industrials): Default 1.0.
XLF Weight (Financials): Default 1.0.
XLB Weight (Materials): Default 0.9.
XLE Weight (Energy): Default 0.9.
XLV Weight (Health Care): Default 0.8.
XLP Weight (Consumer Staples): Default 0.8.
XLU Weight (Utilities): Default 0.7.
XLRE Weight (Real Estate): Default 0.7.
PPA Weight (Aerospace & Defense): Default 0.9.
Adjustment Tips: Boost XLK/SOXX for tech-favorable markets; increase XLV/XLP for defensive phases.
Visualization Settings:
Show RS Line: Displays RS line (black) and 50-day MA (gray).
Show Blue Dot Divergence (Blue Dot): Marks divergence signals.
Show Dashboard: Enables the dashboard.
Dashboard Position: Choose locations like "Bottom Right".
3. Output Interpretation
RS Line: Black line shows stock strength vs. SPX; upward trend means outperforming. Gray line is 50-day MA—breaking above signals strength.
Blue Dot: Blue circle appears for RS leading price new highs (like a "coiled spring"), indicating potential low-risk entries. Confirm with: RS > 50-day MA and volume surge.
Dashboard:
RS Rating: Score 1–99; green (>80) for strong, yellow (50–80) neutral, red (<50) weak.
RS Trend: Green "Strong" or red "Weak".
Blue Dot: Blue "Present" or red "None".
Interpretation Analogy: RS Rating is like a stock's "health score"—above 80 is an "athlete" worth tracking for breakouts; Blue Dot is a "green light," but pair with volume to confirm true breakouts (avoid fakes).
4. Usage Examples
Screening Leaders: Add to AAPL chart—if RS Rating > 85 and Blue Dot appears, check if price nears VCP pivot; this is a low-risk buy setup.
Trend Judgment: Rising RS line with M.E.T.S. Stage 2 (uptrend) confirms trend-following trades.
Weight Tweaks: For defensive markets, raise XLV/XLU weights and recalculate RS Proxy.
5. Common Issues and Warnings
Q: Indicator not showing? A: Verify ETF symbols (e.g., AMEX:XLK) or switch timeframes.
Q: Inaccurate scores? A: Adjust periods/weights and backtest on historical data.
Q: Avoiding false breakouts? A: Combine with volume and support/resistance; Blue Dot is a alert, not a buy signal.
Warnings: Based on historical data; markets are volatile—use with other tools. Results are for reference only, not investment advice. Test in a demo account.

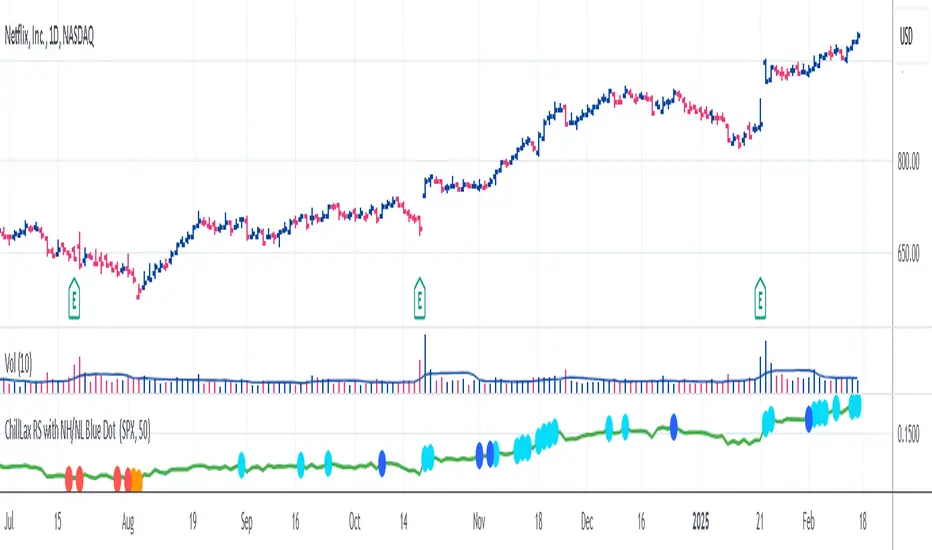
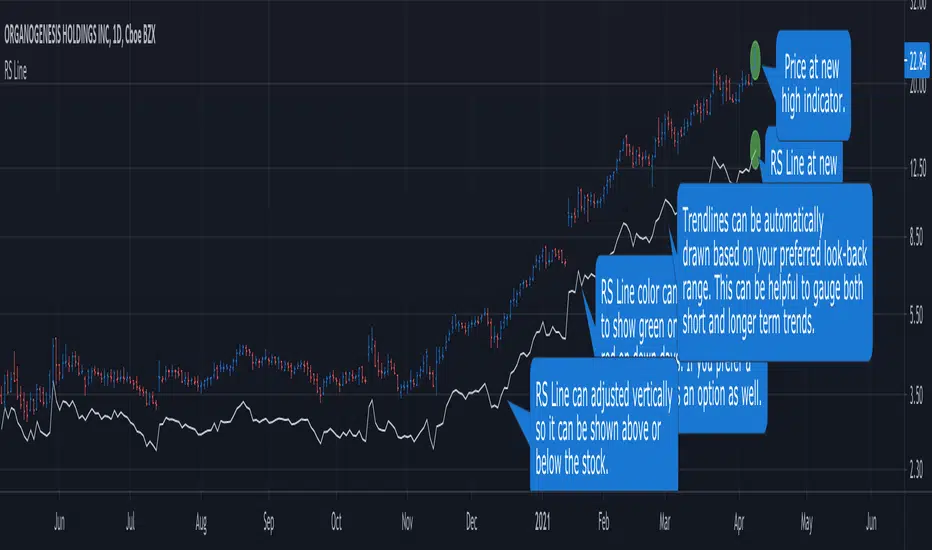
ChillLax Relative Strength Line with NewHigh NewLow Blue DotThis is similar to the IBD MarketSurge (MarketSmith) Blue Dot:
This plots the Relative Strength line vs. an index (default index is SPX), with a Dot when the RS line is hitting a New High.
If the RS hits a New High over the past X bars (default is 50), it shows a Light Blue (user definable) Dot on the RS line, if RS hits New High before the instrument hits New High, it shows a bigger/darker Blue Dot. Reverse for New Lows (orange for RS NL, Red for RS NL before Price NL)
This Dot is similar to the IBD Marketsurge RS New High Blue Dot, this indicator shows all the previous dots (MarketSurge shows only the last one). This on, unlike IBD, also shows RS New Lows. This one distinguishes RS NH before Price NH, and RS NL before Price NL. Lastly, IBD's lookback period is 52 week, here it is default to 50 days, but it is changeable.
Sector Relative Strength [Afnan]This indicator calculates and displays the relative strength (RS) of multiple sectors against a chosen benchmark. It allows you to quickly compare the performance of various sectors within any global stock market. While the default settings are configured for the Indian stock market , this tool is not limited to it; you can use it for any market by selecting the appropriate benchmark and sector indices.
📊 Key Features ⚙️
Customizable Benchmark: Select any symbol as your benchmark for relative strength calculation. The default benchmark is set to `NSE:CNX100`. This allows for global market analysis by selecting the appropriate benchmark index of any country.
Multiple Sectors: Analyze up to 23 different sector indices. The default settings include major NSE sector indices. This can be customized to any market by using the relevant sector indices of that country.
Individual Sector Control: Toggle the visibility of each sector's RS on the chart.
Color-Coded Plots: Each sector's RS is plotted with a distinct color for easy identification.
Adjustable Lookback Period: Customize the lookback period for RS calculation.
Interactive Table: A sortable table displays the current RS values for all visible sectors, allowing for quick ranking.
Table Customization: Adjust the table's position, text size, and visibility.
Zero Line: A horizontal line at zero provides a reference point for RS values.
🧭 How to Use 🗺️
Add the indicator to your TradingView chart.
Select your desired benchmark symbol. The default is `NSE:CNX100`. For example, use SPY for the US market, or DAX for the German market.
Adjust the lookback period as needed.
Enable/disable the sector indices you want to analyze. The default includes major NSE sector indices like `NSE:CNXIT`, `NSE:CNXAUTO`, etc.
Customize the table's appearance as needed.
Observe the RS plots and the table to identify sectors with relative strength or weakness.
📝 Note 💡
This indicator is designed for sectorial analysis. You can use it with any market by selecting the appropriate benchmark and sector indices.
The default settings are configured for the Indian stock market with `NSE:CNX100` as the benchmark and major NSE sector indices pre-selected.
The relative strength calculation is based on the price change of the sector index compared to the benchmark over the lookback period.
Positive RS values indicate relative outperformance, while negative values indicate relative underperformance.
👨💻 Developer 🛠️
Afnan Tajuddin

Relative Strength Price Oscillator Indicator (RS PPO)Percentage Price Oscillator (PPO)
The Percentage Price Oscillator (PPO) is a momentum oscillator that measures the difference between two moving averages as a percentage of the larger moving average. As with its cousin, MACD, the Percentage Price Oscillator is shown with a signal line, a histogram and a centerline. Signals are generated with signal line crossovers, centerline crossovers, and divergences.
PPO readings are not subject to the price level of the security and the PPO values for different securities can be compared, regardless of the price of the security.
Relative Strength (RS)
Relative strength is a strategy used in momentum investing and focuses on investing in stocks or other securities that have performed well relative to the market as a whole or to a relevant benchmark.
Chart
In the chart, Microsoft stock (MSFT) is plotted against the VanEck Semiconductor ETF (SMH).
In the example on the left, from the negative values of the RS PPO it can be seen that MSFT, although trending upward, is losing out in negative terms to the SMH etf.
In the example on the right, during a correction phase with a downward price trend, Microsoft held up relatively well compared to the Van Eck Semiconductor etf.

Relative Strength (Volatility Adjusted)The volatility adjusted relative strength indicator offers a more precise approach to traditional RS indicators by incorporating volatility adjustments into its calculations. This will provide traders with a more nuanced view of relative performance between a selected instrument and a comparison index.
Identifying Relative Strength (RS) and Weakness (RW) against a benchmark like the SPY is crucial for traders, as it highlights institutional activity in an equity, which retail traders rarely achieve on their own. However, the traditional method of simply comparing the rate of change of a stock to the rate of change for the SPY can be flawed. This method often fails to account for the inherent volatility of each stock, leading to misleading RS/RW readings.
Consider two stocks that both move in response to SPY's movements. If SPY moves significantly more than its average (measured by its ATR), and the stock does the same, traditional RS calculations might show strength when, in fact, the stock is just mirroring SPY's increased volatility. For instance, if SPY typically moves $0.25 an hour but suddenly moves $1, and a stock typically moves $0.50 but moves $2, the stock's apparent RS might be overstated, when in reality there is no relative strength for the stock.
By adjusting for volatility using the ATR (Average True Range), we normalize these movements and get a clearer picture of true RS/RW. For example, if SPY moves 5 times its average rate and a stock moves the same multiple of its own ATR, the RS should be considered neutral rather than strong. Similarly if a stock in absolute terms moves $1 while the SPY also moves $1 but the stock usually moves at twice the rate of the SPY, the stock should be considered relatively weak - not neutral.
Usage
Use this to identify stocks with actual strength or weakness compared to the market.
When the RS line is above 0 and above the moving average it indicates a stock with relative strength that is still gaining more strength.
When the RS line is above 0 but above the moving average it indicates a stock with relative strength that is currently losing strength.
When the RS line is below 0 and below the moving average it indicates a stock with relative weakness that is still losing strength.
When the RS line is below 0 but above the moving average it indicates a stock with relative weakness that is starting to gain back some strength.

Anchored Relative StrengthThe Anchored Relative Strength (RS) Indicator is a tool designed for traders to compare the performance of a selected stock or security against a benchmark index or another security starting from a specific point in time.
Traditional Relative Strength
The traditional RS line is a popular tool used to compare the performance of a stock, typically calculated as the ratio of the stock's price to a benchmark index's price. It helps identify outperformers and underperformers relative to the market or a specific sector.
The Anchored Approach
The Anchored RS line enhances the traditional concept of the RS line by introducing an anchored approach, where calculations begin from a user-defined date. This feature provides the flexibility to start the comparison from a specific historical event, earnings, market peak, trough, or any date significant to the trader's analysis.
Calculating Relative Strength
The RS value is calculated by dividing the close price of the chosen stock by the close price of the comparative symbol (SPX by default). This calculation is performed for each bar since the Anchor Date.
Indicator Features
🔶Custom Start Date
🔶Custom Comparison Symbol
🔶RS Line Moving Average
🔶Comparison Symbol Line
🔶Customize Colors & Appearance
Users can change the anchor date simply by clicking on the indicator and dragging the anchor point.

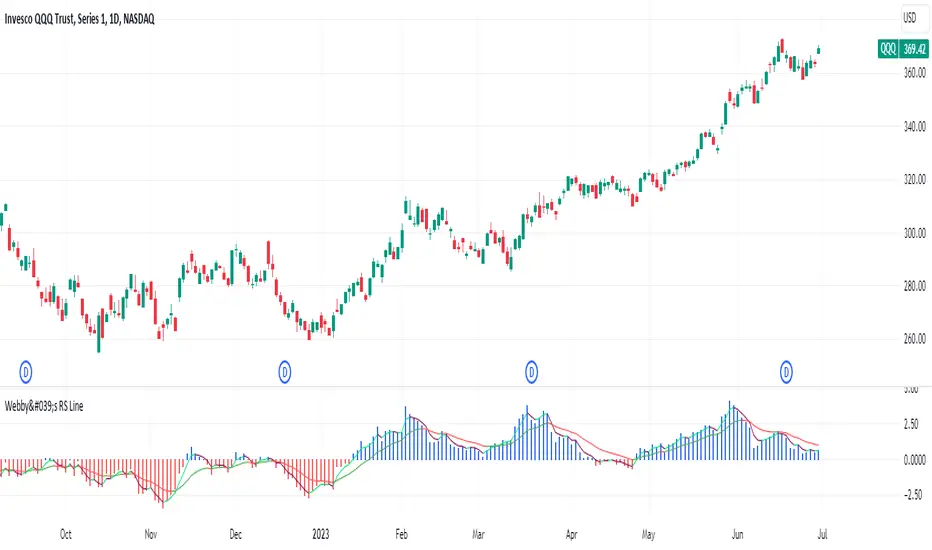
Webby's Quick & Grateful Dead RSWebby's Quick & Grateful Dead RS combines a Relative Strength Line and Moving Averages to help traders hold a core position in a winning stock by identifying moments of strength and weakness in a stocks advance.
The Relative Strength (RS) line is something many investors are familiar with. It is used to measure a stocks performance versus the S&P 500 (default setting) and is typically calculated by dividing the closing price of the stock by the closing price of the S&P. This means if a stock moves up and the S&P moves down or the stock moves up more than the S&P the RS line will increase, if the stock moves down while the S&P moves up the line will decrease.
While the RS Line by itself is a powerful tool, adding moving averages to the RS line can help better understand trends. This work was done by Mike Webster (Webby) as he tried to reverse engineer how William O'Neil was able to hold some of his biggest winning positions.
This indicator plots the RS line along with two moving averages and clearly labels and alerts the 3 signals shared by Webby:
Quick Break - RS line crosses below the fast moving average
Quicksand - RS line moves lower than it was at the time of the Quick Break
Grateful Dead Break - RS line crosses below the slow moving average
To ensure your chart doesn't get skewed, please use the multiplier in the setting to adjust the vertical offset of the RS line and moving averages.

RedK Relative Strength Ribbon: RS Ribbon and RS ChartsRedK Relative Strength Ribbon (RedK RS_Ribbon) is TA tool that plots the Relative Strength of the current chart symbol against another symbol, or an index of choice. It enables us to see when a stock is gaining strength (or weakness) relative to (an index that represents) the market, and when it hits new highs or lows of that relative strength, which may lead to better trading decisions.
I searched TV for existing RS indicators but didn't find what I really wanted, so I put this together and added some additional features for my own use. It started as a simple RS line with new x-weeks Hi/Lo markers, then evolved into what you see here in v1.0 with the ability to plot a full RS chart in regular or HA candle types. Hope this will be useful to some other growth traders here on TV.
What is Relative Strength (RS)
------------------------------------
(RS is a comprehensive concept in TA, below is a quick summary - please research further if it's not already a familiar topic)
Relative Strength (RS) is a technical concept / indicator used mainly by growth / swing / momentum traders to compare the performance of one security or asset against another. RS measures the price performance of a specific security relative to a benchmark, such as an index or another asset. It's not to be confused with the famous Relative Strength Index (RSI) technical indicator
For example, In the context of comparing a stock's relative strength to the SPY (S&P 500) index, the relative strength calculation involves dividing the stock's price or price-related value (e.g., close price) by the corresponding value of the SPY index. The resulting ratio (and its trend over time) indicates the relative performance of the stock compared to the index.
Traders and investors use relative strength analysis to identify securities that have been showing relative strength or weakness compared to a benchmark, which can help in making investment decisions or identifying the "market leaders" and potential trading opportunities.
There are so many books and documentation about the RS concept and its importance to identify market leaders, especially when recovering from a bear market - if you're interested in the concept, please search more about it and review some of that literature. There's also a more detailed definition of Relative Strength in this article on Invstopedia
RedK RS_Ribbon features and options
---------------------------------------------------
The indicator settings provide many options and features - see the settings box below
- Change / choose base symbol
The default is to use SPY as the base symbol - so we're comparing the chart's symbol to a proxy of the S&P 500 - Some traders may prefer to use the QQQ - or other index or ETF that acts as a proxy for the industry / sector / market they are trading
- RS Calculation / RS line
we use the simple form of the RS calculation,
RS = closing price of current chart symbol / closing price of the base symbol (default is SPY) * 100
some RS documentation will use the Rate of Change (RoC) - but that's not what we're using here.
- The RS_Ribbon
* Once the RS line is plotted, it made sense to add couple of moving averages to it, to make it easier to observe the trend of the RS and the changes in that trend as you can see in the sample chart on top.
* The RS_Ribbon is made up of a fast and slow moving averages and will change color (green / red) based on detected trend RS direction - the 2 MA types and lengths can be changed until you get the setup that provides the best view for you of the RS trend over time. My preferred settings are used as defaults here.
- Identifying New (x)Week Hi/Lo RS Values
* Most traders would be interested when the calculated RS hits a new 52-week high or low value.
* There are cases where we may want to see when a new RS Hi/Lo has been hit for a different period - for example, a quarter (13 weeks)
* the number of weeks can be changed as well as adjusting the numbers of trading days per week (if needed for certain symbols/exchanges)
- Working with Different Timeframes
* Now these "markers" will only be available in the daily and weekly timeframes and there is a good reason for that, it's not the fact that i'm lazy :) and that enabling this in timeframes lower than 1D would have been some heavy lifting, but the reality is that with RS, we're really interested if a "day's close" hits a new RS high or low value against the moving window of x weeks (and the weeks close also) - if you think of this more, at lower TF, RS can hit a lower value that never end up registering on the daily closing and that causes a lot of visual confusion. So i took the "cleaner way out" of that issue.
* note that you can choose a different timeframe for the RS_Ribbon than the chart - if you do, please make sure the chart is at a lower timeframe than the indicator's - (and in that case remember to hide the candles because they won't make much sense)
i wanted to leverage TV's built-in multi-Timeframe (MTF) support with the caveat that using the indicator at lower TF with a chart at a higher TF (example chart at 1Wk and indicator at 1D) will show inaccurate results. If this sounds confusing, keep the indicator TF same as the chart.
the example here shows a 2-Hr chart against 1D RS_Ribbon
- Using RS Charts and RS Candles
* Beside the ability to plot the RS "closing" value with the RS line, the indicator provides the ability to show a "full" RS Chart with candles that represent the relative values of open, high, low. and close against the base symbol.
* the RS Charts can be used for regular chart analysis, for example, we can identify common chart patterns like Cup & Handle, VCP, Head & Shoulder..etc using these charts .. which can provide some edge over the price charts
* for the Heikin Ashi fans, I added the ability to choose classic or HA candles for the chart. note you have to enable the option to show the RS candles first before you choose the option to switch to HA.
The chart below shows a side-by-side comparison on the 2 RS chart types
Closing remarks
-----------------------
* RS is a good way to identify market/sector leaders (who will usually recover from a bear market before others) - and enable us to see the strength that comes from the broader makrket versus the one that comes from the stock's own performance and identify good trading opportunities
* I'll continue to update this work and alerts will come in next version - but wanted to check initial reaction and value
* as usual, if you decide to use this in your chart analysis, it's necessary to combine with other momentum, trend, ...etc indicators and do not make trading decision only based on the signales from a single indicator

Webby's RS LineThe Relative Strength (RS) line is something many investors are familiar with. It is used to measure a stocks performance versus the S&P 500 and is typically calculated by dividing the closing price of the stock by the closing price of the S&P. This means if a stock moves up and the S&P moves down or the stock moves up more than the S&P the RS line will increase, if the stock moves down while the S&P moves up the line will decrease.
While the standard RS line is a powerful tool, Mike Webster recently discussed how he has made changes to the standard RS line and also uses a 21 exponential moving average of the RS line to help guide his decision making. This script puts those new twists on the standard RS line, by first calculating the RS line using the low of both the security and the S&P rather than the closing prices. Next it measures the 21-day exponential moving average of the RS line and plots the distance between the two as a histogram.
A strong trending stock that is out performing the market will see an extended period of a positive blue histogram signifying the RS line is above the 21-ema.
While on the other hand a stock in a downtrend that is underperforming will see a negative red histogram a red histogram signifying the RS line is below the 21-ema.
On top of all of that, the indicator also keeps 3 & 13 exponential moving average of the distance between the RS line and the 21 ema to help identify shorter term relative strength and capture more immediate shifts in momentum. Both of those are plotted on the histogram as well and will change color as they rise and fall making it easy to spot the direction.
Indicator options include:
Choose symbol to measure performance against
Change histogram colors
Choose ema line width
* Note this indicator does not plot the actual RS line, it is the histogram representing the distance between the RS line calculated using the lows and the 21 ema, as well as the two ema's of the relationship.
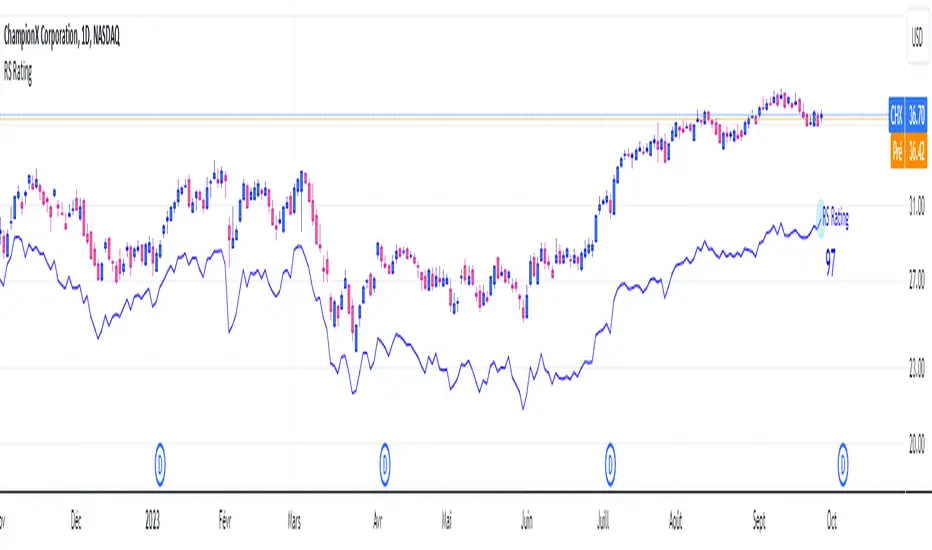
RS RatingHello everyone.
The RS Rating (or Relative Strenght Rating) is a metric that tracks a stock's price performance relative to the rest of the market. Specifically, it looks at a stock's relative strength over the last 52 weeks.
It allows you to identify at a glance stocks that are outperforming the market and may be poised for further gains.
Designed for break-out traders, trend follower, value investors, the RS Rating can help you identify promising opportunities and make informed investment decisions.
The Rating stands as follow:
- From 1 (worst) to 99 (best)
- 99 rating means the stock is outperforming 99% of all stocks in terms of relative share price performance over the last 52 weeks.
The RS Rating is accompanied by the RS line which is a representation of the progress of the asset against the comparative symbol. (Here SP500)
Of course this script is inspired by the IBD rating system.
The results may be equivalent but it is not guaranteed.
This indicator proposes a scoring system in the style of the one proposed by IBD.
Indeed for an optimal result, it would be necessary to compare the relative performance of all actions, which is not yet possible on PineScript.
Here is the formula for calculating the score:
RS Score = 40% * P3 + 20% * P6 + 20% * P9 + 20% * P12
With
P3 = Performance over the last 3 months
P6 = Performance over the last 6 months
P9 = Performance over the last 9 months
P12 = Performance over the last 12 months
There is no equivalent solution for the moment on TradingView.
The rating score will only appear on the daily timeframe.
For now it's my pleasure to share!
Quad RSRelative Strength (RS) is an Indicator which measures a Stock's performance as compared to a Benchmark Index or another Stock.
For example: RS will tell you whether “A” is increasing more or less than “B” in any market condition. It is one of the tools which is best suited for Momentum Investing.
How RS can be used as a Momentum Indicator:
RS is used in identifying both the strongest and the weakest stock, or any asset class, within the market. Usually, the stocks which display strong or weak RS over a given time period tend to continue to move in the same direction.
How to calculate Relative Strength:
Divide change of "A" over some time period by the change of a particular index/stock "B" over the same time period.
This indicator oscillates around zero. If the value is greater than zero, "A" has been relatively strong compared to "B", during the selected period; if the value is less than zero, "A" has been relatively weak.
Configuration & Default settings:
The Relative symbol can be Input, default is Nifty50.
Time frame can be set, I recommend setting to Day. Default time frame is set to same as chart.
Four different periods can be set. Default values are 500, 250, 125 & 63. If time frame is set as 'Day', these numbers correspond to 2 years, 1 year, 1/2 year & 1 quarter.
Example chart: NiftyMidCap100 with Quad RS indicator with Nifty50 used as Relative Symbol, Four periods: 500, 250, 125 & 63

Relative Strength Exponential Moving Average [CC]The Relative Strength Exponential Moving Average was created by Vitali Apirine (Stocks and Commodities Jan 2022 pgs 22-25) and this is a handy moving average that combines a typical overbought/oversold mechanic with an overall trend indicator. Even though the typical length is so large it reacts extremely quickly when the stock becomes overbought or oversold. Because of this the indicator by itself doesn't work as well during choppy periods so Vitali recommends using a moving average crossover system during choppy so do one indicator with the default length of 50 and use a different length of 10 so when the shorter length crosses over the longer length then buy and vice versa you would sell. Generally speaking buy when the line turns green and sell when it turns red. I have used strong buy and sell signals in addition to normal signals so strong signals are darker in color and normal signals are lighter in color.
Let me know if there are any other scripts or indicators you would like me to publish!

Relative StrengthPowerful tool to calculate and display the strength of a security compared to another security.
Some Main purposes are:
- finding new leadership in a market correction
- comparing a market leader with a top competitor
- tracking rotation in the market
.. and so much more!
This tool is highly configurable, you can especially change:
- The reference symbol (SPY, QQQ, BTCUSD, ...)
- The time span to indicate a new High or Low in a certain time-frame
- Factorize your RS-Chart to make it fit to the original chart. (Moves the chart up or down)
- Option to repaint your candles / bars when a new RS High occurs in the given timeframe.
Enjoy and have a great day!
Powerful_Trading
RS.ROC | Relative Strength - Rate of Changes - 4CR CUPFor completeness of Relative Strength studies, the Relative Strength based on rate of changes (ROC) with weighting is coded and presented as well.
The RS.ROC is similar to the formulation of RS by IBD before rank among all the stocks in the market.
The lookback period is relaxed for customizing. Once you set the total lookback period, representing the 4Q, in the indicator, the other shorter lookback periods will be auto-calculated, namely, 1Q, 2Q, 3Q.
A simple moving average of the RS.ROC is also added for your easier analysis on the trend development of the strength.
To use it later at your charting later,
1. Favorite it;
2. Select from your favorite list.

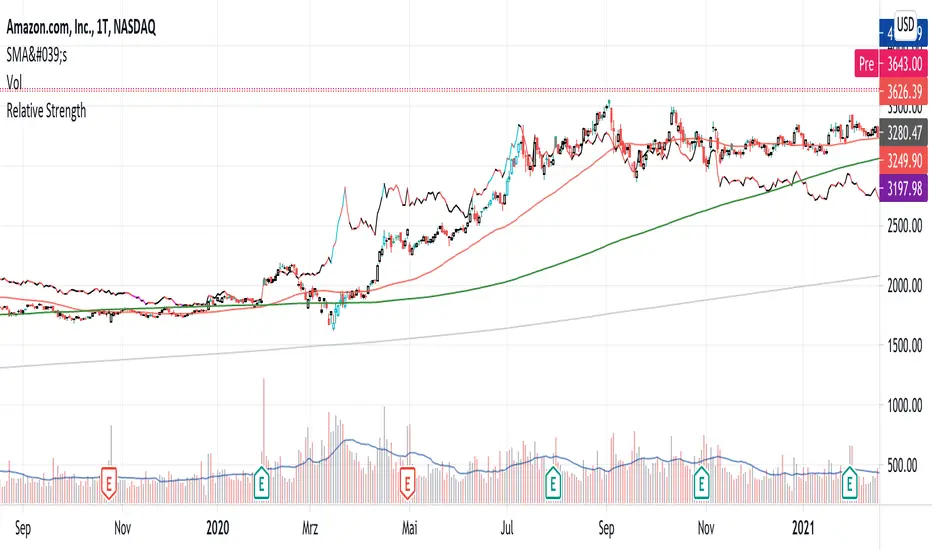
RS Line - Relative Strength Line [LevelUp]Overview:
This implementation of the RS Line mimics how Investor's Business Daily and CANSLIM investors measure growth stock performance versus the S&P 500.
If you are looking at a weekly chart, the RS Line is the performance of the stock over the past week versus the S&P 500 over that same time frame. The same logic applies to the daily and monthly charts, only the time frames are different.
If a stock moves up for the day/week/month and the S&P 500 does not, the RS Line will move up. If a stock ends the day/week/month flat, yet the S&P 500 moves up, the RS Line will go down.
Usage:
- Look for an upward sloping line.
- The steeper the line, the better.
- Can be used for viewing long-term trend.
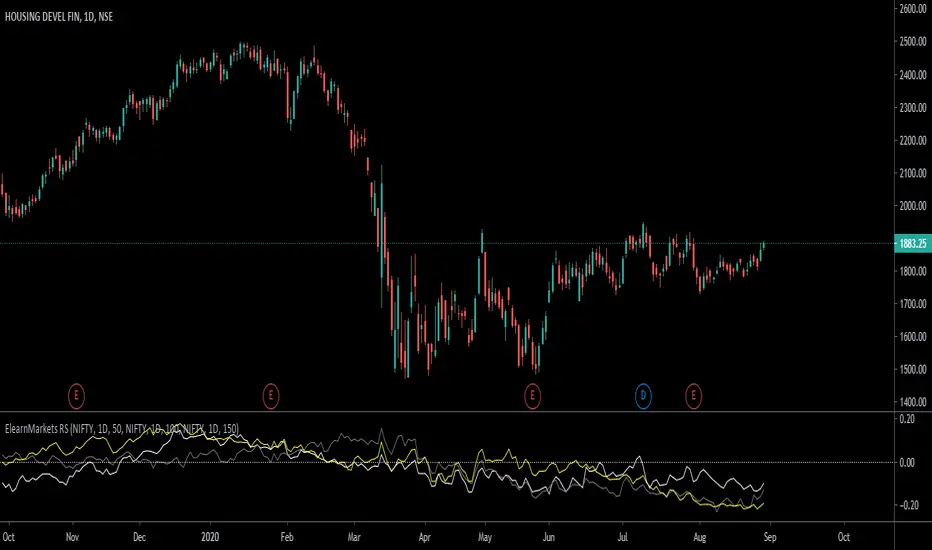
ElearnMarkets RSHow it works?
1. With this indicator you can compare any other symbol of index/security with selected symbol.
2. You can compare with three different Indices/symbols.
3. Also you can keep different timeframe and length of period to compare with the current symbol.
4. No need to add multiple indicators for same purpose.
Thanks,
Yogesh
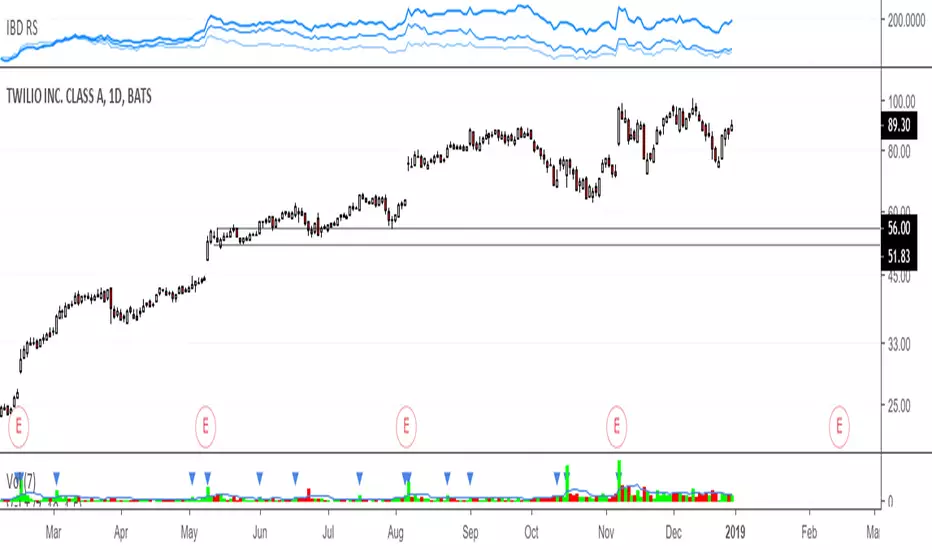
IBD RS, Relative strengthRelative Strength calculation of 3 time periods: 12 months, 6 months and 3 months.
RSI with SMA ( Normal Formula of RSI)Tradingview has a different type of RSI. I prepare a normal formula for RSI to calculate better backtest performance.
Trend-Reverse Strategy
Trend-Reverse Strategy is a combination of these 2 scripts to use 5 min candle.


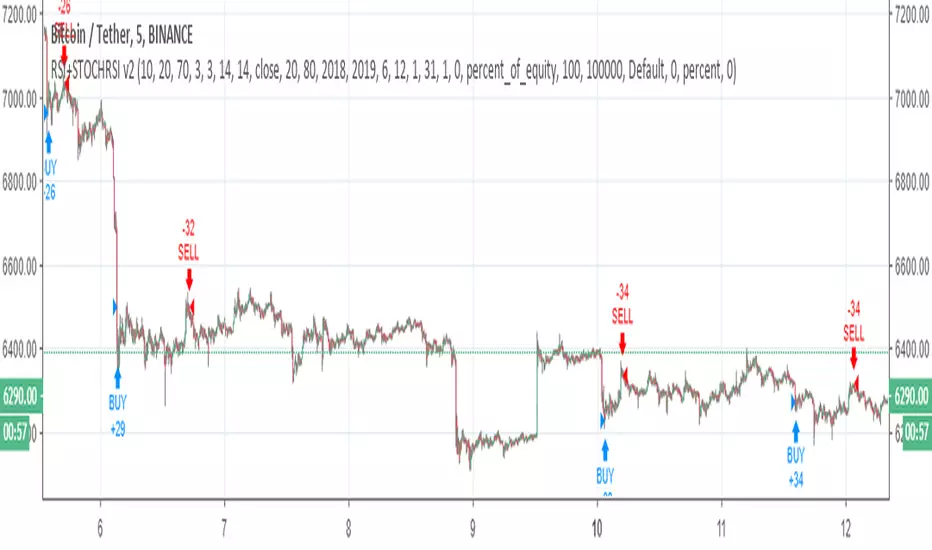
RSI+STOCHRSI v2RSI + STOCHASTIC RSI combination v2 ( for v1 )
For 5 min
Changes
Stcoh RSI creates signal with crossover
RSI created signal with an equation ( above or below the line) ,crossover was added.