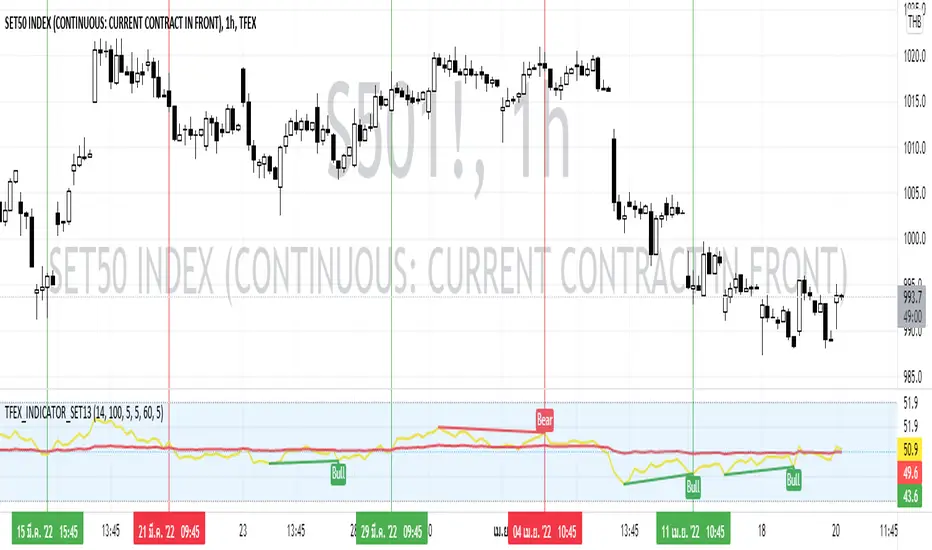
TFEX_INDICATOR_SET13This Indicator use the calculated RSI of the top 13 stocks that have the highest market capitalization in SET:SET50 where suitable for TFEX trading( TFEX:S501! ) .
Conducted with 2 RSI period as follow:
RSI Main (14)
RSI Average (100)
How to use:
1) Use this Indicator by Crossover
If the RSI Main Cross UP the RSI Average can assume as BUY SIGNAL
If the RSI Main Cross DOWN the RSI Average can assume as SELL SIGNAL
2) Use this Indicator by Divergence of RSI Main
If the RSI Main got any Regular Bullish or Hidden Bullish can assume as BUY SIGNAL
If the RSI Main got any Regular Bearish or Hidden Bearish can assume as SELL SIGNAL
3) The combination of Divergence and Crossover
If the RSI Main got any Regular Bullish or Hidden Bullish then pending for the RSI Main Cross UP the RSI Average which can assume as BUY SIGNAL
If the RSI Main got any Regular Bearish or Hidden Bearish then pending for the RSI Main Cross DOWN the RSI Average which can assume as SELL SIGNAL
Preferred Timeframe
4H
2H
1H
Pine Script®指标