Gann Octogram - Sacred Geometry Confluence Ver 1.0📐 Gann Octogram - Sacred Geometry Confluence Ver 1.0
Overview
Advanced Gann analysis tool combining W.D. Gann's Square of Nine principles with sacred geometry and multi-factor confluence signals. This indicator automatically detects swing highs/lows and projects octogram grids forward in time and price, identifying high-probability trading opportunities where multiple factors align.
Understanding Gann Octograms
W.D. Gann believed markets move in geometric patterns through time and price. The octogram (8-sided figure) represents the square of nine principle where:
Price divisions (1/8ths) create natural support/resistance
Time cycles mark potential reversal points
Diagonal angles show dynamic price-time relationships
Confluence zones where geometry aligns offer highest probability trades
This indicator makes these complex calculations automatic and visual.
Key Features
🎯 Intelligent Auto-Detection
Auto Gann Number Selection: Automatically chooses optimal Gann period (11, 22, 44, 88, 176) based on timeframe and data availability
Adaptive Half-Period Mode: Uses Gann/2 for faster swing detection while validating with full period
Smart Grid Projection: Projects octagrams near current price action for relevance
📊 Sacred Geometry Visualization
Octogram Grids: Complete octagonal geometry with inner square, angled square, and connecting lines
Gann Angles: 1×1 and 2×1 diagonal support/resistance angles
Time Cycles: Quarter, half, and three-quarter cycle markers
Price Levels: Automatic 1/8th division levels (0%, 12.5%, 25%, 37.5%, 50%, 62.5%, 75%, 87.5%, 100%)
⚡ Advanced Confluence System
Adjustable 4-Factor Confluence (Levels 0-4):
Price Level Touch: Precise detection of key support/resistance levels
Time Cycle Alignment: Major (25%, 50%, 75%) and minor (1/8th divisions) cycles
Octogram Geometry: Proximity to vertices and diagonal angles
Price Action: Bullish/bearish candle confirmation
Confluence Levels:
Level 0: Signals on price touch only (most signals)
Level 1: Minimum 1 factor required
Level 2: Minimum 2 factors (⭐ recommended - balanced)
Level 3: Minimum 3 factors (strict quality)
Level 4: All 4 factors required (highest quality, fewer signals)
🛡️ Signal Quality Controls
Max Signals Per Cell: Limit signals to 1-10 per grid cell
Cooldown Period: Minimum bars between consecutive signals
Cell Signal Tracking: Automatic reset when entering new time cells
Adjustable Tolerances: Fine-tune price and geometry sensitivity
How It Works
Swing Detection: Identifies significant market swings using pivot highs/lows
Grid Construction: Builds octogram grid from swing high to swing low
Multi-Grid Projection: Projects multiple cells forward (time) and vertically (price)
Confluence Analysis: Monitors all 4 factors continuously
Signal Generation: Fires BUY/SELL when confluence threshold is met
BUY Signals trigger when:
Price touches LOW zones (0%-50%)
At key time cycle points
Near octogram geometry
Bullish candle forms
SELL Signals trigger when:
Price touches HIGH zones (50%-100%)
At key time cycle points
Near octogram geometry
Bearish candle forms
Settings Guide
Structure Settings
Auto Gann Number: Enable for automatic period selection (recommended)
Manual Gann Number: 11, 22, 44, 88, or 176 bars
Use Half Period: Faster detection using Gann/2 lookback
Grid Stability: Adaptive (1/8th) / Strict (1/4th) / Relaxed (1/16th)
Signal Settings ⚙️
Confluence Level: 0-4 (start with 2)
Price Tolerance: 1-8% (default 3%)
Geometry Tolerance: 0.5-5% (default 2.5%)
Min Bars Between Signals: 1-20 (default 3)
Max Signals Per Cell: 1-10 (default 4-6)
Display Options
Toggle grid squares, octagrams, triangles, Gann angles
Customizable colors for all elements
Time cycle visualization
Swing high/low markers
Info panel with swing statistics
Best Practices
For Day Trading (5min-15min charts):
Confluence Level: 2
Auto Gann: ON
Grid Stability: Adaptive
Max Signals Per Cell: 4-6
For Swing Trading (1H-4H charts):
Confluence Level: 3
Auto Gann: ON
Grid Stability: Strict
Max Signals Per Cell: 2-4
For Position Trading (Daily charts):
Confluence Level: 3-4
Manual Gann: 88 or 176
Grid Stability: Strict
Max Signals Per Cell: 2-3
Alert Setup
Built-in alert conditions:
Gann Octogram Buy - Fires on BUY signal
Gann Octogram Sell - Fires on SELL signal
Configure alerts using TradingView's alert system to get notified when confluence zones trigger.
Backtesting Tips
Start with Confluence Level 2 (balanced approach)
Increase level to 3-4 if too many signals
Decrease to 1 if missing opportunities
Adjust tolerances based on asset volatility
Test different Gann numbers for your specific market
Credits & Theory
Based on W.D. Gann's principles:
Square of Nine
Time-Price Geometry
Sacred Geometry (Octograms)
Natural Market Cycles
Developed with modern Pine Script for reliability, efficiency, and user control.
Version History
Ver 1.0 - Initial Release
4-factor confluence system
Auto Gann number selection
Adjustable confluence levels (0-4)
Sacred geometry visualization
Signal quality controls
Support
For questions, suggestions, or issues:
Comment on this indicator
Check the code (open source)
Experiment with settings for your trading style
Happy Trading! 📈
Disclaimer
This indicator is for educational and informational purposes only. Past performance does not guarantee future results. Always practice proper risk management and never risk more than you can afford to lose. Backtest thoroughly before live trading.
Sacredgeometry

Gann Sacred Geometry Hexagram Ver 1.2━━━━━━━━━━━━━━━━━━━━━━━━━━━━━━━━━━━━━━━━
🔯 GANN SACRED GEOMETRY HEXAGRAM v1.2
━━━━━━━━━━━━━━━━━━━━━━━━━━━━━━━━━━━━━━━━
A comprehensive technical analysis tool combining W.D. Gann's sacred geometry principles,
hexagram patterns, and advanced confluence scoring for high-probability trade signals.
━━━━━━━━━━━━━━━━━━━━━━━━━━━━━━━━━━━━━━━━
📖 GANN THEORY BACKGROUND
━━━━━━━━━━━━━━━━━━━━━━━━━━━━━━━━━━━━━━━━
W.D. Gann (1878-1955) believed markets move in geometric patterns and that price
and time must be in balance. His methods incorporated:
- The Square of Nine
- Geometric angles (1x1, 2x1, etc.)
- Sacred geometry and natural law
- Cycle theory and time divisions
- The principle "When time and price square, a change in trend is imminent"
This indicator applies these timeless principles with modern confluence analysis.
SACRED GEOMETRY FOUNDATION:
The hexagram (six-pointed star) is formed by two overlapping equilateral triangles:
- ▲ Upward triangle = Yang energy, bullish forces, expansion
- ▼ Downward triangle = Yin energy, bearish forces, contraction
When overlapped, they create the "Star of David" - representing perfect balance
between opposing market forces. Gann believed this geometry revealed natural
support and resistance zones where price would react.
HEXAGRAM IN MARKETS:
- 6 outer points = Major reversal zones
- Center point = Balance/equilibrium price
- Inner intersections = Secondary support/resistance
- The shape itself creates "harmonic" price levels
GANN'S SQUARE PHILOSOPHY:
"When time and price square, a change in trend is imminent."
- W.D. Gann
This indicator applies the "squaring" concept:
1. SPATIAL SQUARE: Grid cells are perfect squares in price-time space
2. TEMPORAL SQUARE: Time divisions (1/4, 1/2, 3/4) create cycle points
3. PRICE SQUARE: Price divisions (25%, 50%, 75%) mirror time divisions
4. GEOMETRIC SQUARE: All geometry radiates from perfect square centers
When price reaches a corner or edge of a square at a time cycle point,
the "squaring" of price and time creates a reversal probability zone.
PHI IN GANN GEOMETRY:
The Golden Ratio appears throughout natural phenomena and market structure.
This script uses φ in two primary ways:
1. INNER TRIANGLE SCALING:
- Outer triangles span the full cell (100%)
- Inner triangles scaled by φ⁻¹ (0.618 or 61.8%)
- This creates Fibonacci retracement levels geometrically
2. HARMONIC RESONANCE:
- φ ratio divides price space into natural harmony
- Markets tend to pause/reverse at these φ-scaled levels
- Combines Fibonacci analysis with Gann geometry
MATHEMATICAL RELATIONSHIP:
Inner Triangle Height = Outer Height × 0.618
Inner Triangle Width = Outer Width × 0.618
These create the 61.8% retracement levels automatically
within each grid cell's geometry.
GANN'S COMPLETE ANGLE SYSTEM:
Gann identified 9 primary angles that price follows. Each represents a different
relationship between price movement and time passage:
╔════════════════════════════════════════════════════════════════╗
║ ANGLE │ RATIO │ DEGREES │ MEANING ║
╠════════════════════════════════════════════════════════════════╣
║ 1x8 │ 1:8 │ 7.125° │ Very slow trend (gentle) ║
║ 1x4 │ 1:4 │ 14.036° │ Slow trend ║
║ 1x3 │ 1:3 │ 18.435° │ Moderate-slow trend ║
║ 1x2 │ 1:2 │ 26.565° │ Moderate trend ║
║ 1x1 │ 1:1 │ 45.000° │ MASTER ANGLE (most important) ║
║ 2x1 │ 2:1 │ 63.435° │ Strong trend ║
║ 3x1 │ 3:1 │ 71.565° │ Very strong trend ║
║ 4x1 │ 4:1 │ 75.964° │ Extreme trend ║
║ 8x1 │ 8:1 │ 82.875° │ Parabolic trend (unsustainable)║
╚════════════════════════════════════════════════════════════════╝
THE 1x1 ANGLE - THE MASTER:
- Most important angle in Gann theory
- Represents perfect balance: 1 unit price = 1 unit time
- When price is ABOVE 1x1 = Bullish control
- When price is BELOW 1x1 = Bearish control
- Crossing 1x1 = Major trend change signal
ANGLE FANS:
- From any pivot point, all 9 angles radiate outward
- Creates a "fan" of dynamic support/resistance
- Steeper angles (4x1, 8x1) = strong momentum resistance
- Gentler angles (1x4, 1x8) = weak support in downtrends
THE SACRED DIVISIONS OF TIME:
Gann divided all cycles into 8 equal parts, based on ancient geometry
and astrological principles:
CYCLE DIVISIONS (8ths):
┌─────────────────────────────────────────────────────┐
│ 1/8 = 12.5% │ First minor turn point │
│ 2/8 = 25.0% │ First major turn (Cardinal) │
│ 3/8 = 37.5% │ Second minor turn │
│ 4/8 = 50.0% │ MID-CYCLE (most powerful) │
│ 5/8 = 62.5% │ Third minor turn │
│ 6/8 = 75.0% │ Second major turn (Cardinal) │
│ 7/8 = 87.5% │ Fourth minor turn │
│ 8/8 = 100.0% │ CYCLE COMPLETION (reversal zone) │
└─────────────────────────────────────────────────────┘
WHY EIGHTHS?
- 8 is the number of balance in sacred geometry
- Octave divisions create harmonic resonance
- 360° circle ÷ 8 = 45° (the 1x1 master angle)
- Natural cycles show 8-fold symmetry
IN THIS SCRIPT:
When current time position is within 8% of any eighth division,
the "Gann 8ths Timing" factor activates, adding confluence points.
THE CARDINAL CROSS SYSTEM:
The Cardinal Cross divides any square into four equal quadrants,
creating a cross pattern:
100% ●━━━━━━━━━━━━━●
┃ ↑ ┃
75% ┃ SELL ZONE ┃ ← Resistance quadrant
┃ ↑ ┃
50% ●━━━━━●━━━━━━● ← EQUILIBRIUM (most important)
┃ ↓ ┃
25% ┃ BUY ZONE ┃ ← Support quadrant
┃ ↓ ┃
0% ●━━━━━━━━━━━━━●
PRICE LEVELS:
- 0% = Bottom support (grid cell low)
- 25% = Lower mid-level support
- 50% = PERFECT BALANCE - most powerful level
- 75% = Upper mid-level resistance
- 100% = Top resistance (grid cell high)
TIME DIVISIONS:
- 0% = Cycle start (grid cell left edge)
- 25% = First quarter turn
- 50% = Mid-cycle (most powerful timing)
- 75% = Third quarter turn
- 100% = Cycle completion (grid cell right edge)
CONFLUENCE MAGIC:
When BOTH price AND time align at cardinal points simultaneously:
Example: Price at 50% level + Time at 50% of cycle = Maximum power
This is the "squaring" Gann referred to.
━━━━━━━━━━━━━━━━━━━━━━━━━━━━━━━━━━━━━━━━
📊 KEY FEATURES
━━━━━━━━━━━━━━━━━━━━━━━━━━━━━━━━━━━━━━━━
✅ Dynamic Grid System (1x1 to 7x7) - Automatically constructed from swing high to swing low
✅ Sacred Geometry Hexagrams - Overlapping triangles creating Star of David pattern
✅ Golden Ratio (φ = 1.618) Inner Triangles - Fibonacci harmony in geometry
✅ 9 Complete Gann Angles - 1x1, 2x1, 1x2, 3x1, 1x3, 4x1, 1x4, 8x1, 1x8
✅ Cardinal Cross Levels - 0%, 25%, 50%, 75%, 100% price divisions
✅ Gann 8ths Timing Cycles - 1/8, 1/4, 3/8, 1/2, 5/8, 3/4, 7/8 time divisions
✅ Price-Time Square Balance - Gann's principle of harmonious price-time relationship
✅ Advanced Confluence Scoring - Multi-factor signal validation (8-30 score range)
✅ Optimized Geometry Display - Shows full detail only near current price (reduces clutter)
✅ Customizable Visual Themes - Full color and thickness control
━━━━━━━━━━━━━━━━━━━━━━━━━━━━━━━━━━━━━━━━
🎯 HOW IT WORKS
━━━━━━━━━━━━━━━━━━━━━━━━━━━━━━━━━━━━━━━━
📍 GRID CONSTRUCTION:
The indicator identifies the most recent significant swing high-to-low movement using
configurable pivot periods (default: 88 bars). This creates the base "square" which is
then replicated in a grid pattern both vertically (price) and horizontally (time).
📐 SACRED GEOMETRY:
Each grid cell contains:
- Outer hexagram (Star of David) formed by two overlapping triangles
- Inner φ-ratio triangles scaled by the Golden Ratio
- Gann angles radiating from the center point
- Cardinal cross levels dividing price into quarters
🔍 CONFLUENCE SCORING SYSTEM:
Signals are generated when multiple Gann principles align:
1. Cardinal Cross Levels (0-6 points) - Price at key quarter divisions
2. Gann Angle Touches (0-5 points) - Price touching dynamic support/resistance angles
3. Angle Clustering (0-6 points) - Multiple angles converging = strong zone
4. Gann 8ths Timing (0-3 points) - At critical time cycle points
5. Price-Time Square (0-4 points) - Balanced price/time movement
6. Trend Alignment (0-3 points) - Signal direction matches trend
7. Grid Boundary Timing (0-3 points) - Near cell edges = reversal zones
8. φ Triangle Touches (0-2 points) - Golden ratio support/resistance
9. Reversal Patterns (0-2 points) - Wick rejections confirming reversal
Minimum confluence score of 15 required for signal (adjustable 8-30).
━━━━━━━━━━━━━━━━━━━━━━━━━━━━━━━━━━━━━━━━
⚙️ RECOMMENDED SETTINGS
━━━━━━━━━━━━━━━━━━━━━━━━━━━━━━━━━━━━━━━━
📊 For Daily Charts (Swing Trading):
- Gann Number: 88
- Grid Size: 4x4
- Confluence Score: 15
- Geometry Range: 5
- Trend Filter: ON
📊 For 4H Charts (Intraday):
- Gann Number: 44
- Grid Size: 3x3
- Confluence Score: 12-13
- Geometry Range: 3-4
- Trend Filter: ON
📊 For 15M Charts (Scalping):
- Gann Number: 22
- Grid Size: 2x2
- Confluence Score: 10-12
- Geometry Range: 2-3
- Allow Counter-Trend: Consider enabling
━━━━━━━━━━━━━━━━━━━━━━━━━━━━━━━━━━━━━━━━
📚 BEST PRACTICES
━━━━━━━━━━━━━━━━━━━━━━━━━━━━━━━━━━━━━━━━
✓ Use higher confluence scores (15+) for higher probability trades
✓ Combine with volume analysis for confirmation
✓ Respect trend filter - signals with trend are stronger
✓ Watch for signals at grid boundaries (time cycle completions)
✓ Higher scores (20+) indicate exceptional setups
✓ Use alerts to catch signals in real-time
✓ Works best on liquid markets with clear swings
EXAMPLE 1: Strong Buy Signal (Score: 18)
✓ Price touched 50% level (6 pts)
✓ 1x1 Gann angle support (5 pts)
✓ At Gann 8th cycle point (3 pts)
✓ Price-Time squared (4 pts)
= High probability long entry
EXAMPLE 2: Medium Sell Signal (Score: 15)
✓ Price at 75% level (4 pts)
✓ 2x1 angle resistance (3 pts)
✓ Trend aligned downward (3 pts)
✓ Near grid boundary (3 pts)
✓ Bearish wick rejection (2 pts)
= Valid short entry
━━━━━━━━━━━━━━━━━━━━━━━━━━━━━━━━━━━━━━━━
🎨 CUSTOMIZATION OPTIONS
━━━━━━━━━━━━━━━━━━━━━━━━━━━━━━━━━━━━━━━━
- Structure: Gann Number (11, 22, 44, 88, 176, 352)
- Grid: Size from 1x1 to 7x7
- Geometry: Toggle squares, triangles, angles, levels
- Optimization: Show geometry only near price (performance boost)
- Thickness: All line widths adjustable (1-5)
- Colors: Full color customization for all elements
- Scoring: Adjust all tolerance and threshold parameters
- Timing: Enable/disable Gann 8ths, Price-Time Square
- Filters: Trend filter, boundary requirement, counter-trend signals
- Display: 4 signal styles (Labels, Diamonds, Circles, Stars)
━━━━━━━━━━━━━━━━━━━━━━━━━━━━━━━━━━━━━━━━
⚠️ IMPORTANT NOTES
━━━━━━━━━━━━━━━━━━━━━━━━━━━━━━━━━━━━━━━━
- This indicator is for educational purposes
- Not financial advice - always do your own research
- Past performance does not guarantee future results
- Use proper risk management and position sizing
- Combine with other analysis methods for best results
- Grid redraws when new swing high/low forms
- Signals appear in real-time based on confluence scoring
━━━━━━━━━━━━━━━━━━━━━━━━━━━━━━━━━━━━━━━━
📞 SUPPORT & UPDATES
━━━━━━━━━━━━━━━━━━━━━━━━━━━━━━━━━━━━━━━━
Follow for updates and improvements. Feedback welcome!
Version 1.2 - January 2025
- Optimized geometry rendering
- Enhanced confluence scoring
- Improved visual clarity
- Performance optimizations
━━━━━━━━━━━━━━━━━━━━━━━━━━━━━━━━━━━━━━━━

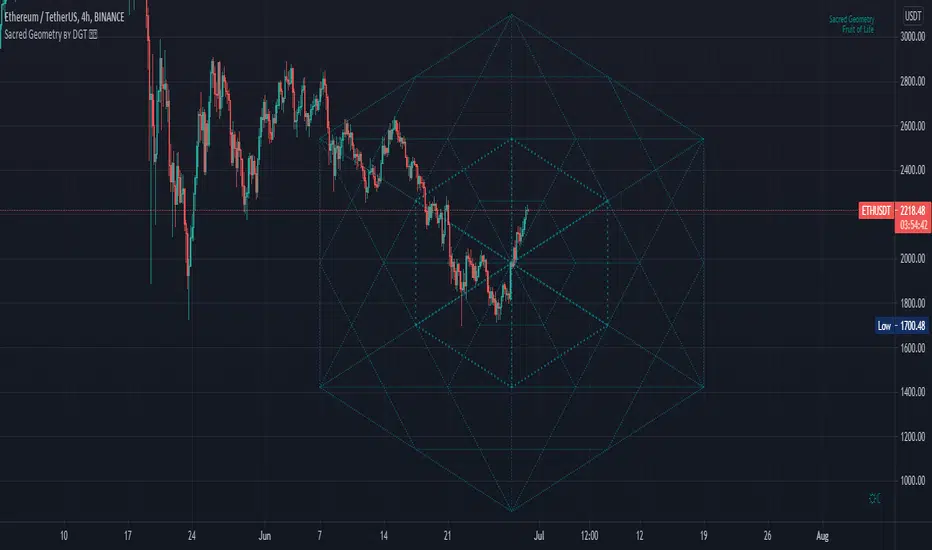
Sacred Geometry by DGTSacred geometry ascribes symbolic and sacred meanings to certain geometric shapes and certain geometric proportions. The study of sacred geometry has its roots in the study of nature, and the mathematical principles at work therein
In trading, using geometry for technical analysis is highly used concept, such as Gann Tools, Fibonacci Tools, Elliott Wave Theory are some examples that are based on the idea that the market is geometric and cyclical in nature
Thanks to @AtomOfScent's "almost like sacred geometry" comment to FibFans on Previous HTF HL
study give me the idea to go further and to demonstrate just how far we can go with this style of analysis. And here comes an experimental attempt to present some of sacred geometric shapes such as Seed of Life, Fruit of Life and Spiral, where the resulting image may help technical analysts to predict price changes.
Fruit of Life, example and how it is derived (maximum line limitation does not allow to draw all circles, so red circles are drawn manually to present the idea). Fruit of Life is base for the Metatron’s Cube and we can create all five Platonic Solids from it (Hexahedron, Tetrahedron, Octahedron, Icosahedron and Dodecahedron)
Spiral Examples :
Again special thanks to @AtomOfScent for commenting on the draft version of the study as well as providing valuable suggestions.
Disclaimer :
Trading success is all about following your trading strategy and the indicators should fit within your trading strategy, and not to be traded upon solely
The script is for informational and educational purposes only. Use of the script does not constitute professional and/or financial advice. You alone have the sole responsibility of evaluating the script output and risks associated with the use of the script. In exchange for using the script, you agree not to hold dgtrd TradingView user liable for any possible claim for damages arising from any decision you make based on use of the script