Intraday BUY/SELL & AUTO SL (5-min timeframe only) by chaitu50c)Intraday BUY/SELL & AUTO SL (5-min timeframe only) by chaitu50c
This indicator provides intraday traders with BUY/SELL reversal signals and automated SL (Stoploss) tracking, based on a 3-candle reversal block logic — designed to work exclusively on the 5-min timeframe.
Key Features:
• 3-Candle Reversal Logic — Signals are generated when a defined 3-candle reversal pattern is detected (body-close breakout).
• Current Session Only — All signals and SL lines are valid only for the current session and automatically reset at session start.
• BUY/SELL Signal Labels — Visual ▲ and ▼ labels mark valid reversal signals on the chart.
• Dynamic Auto SL Lines — Plots dashed SL lines based on the reversal block's low/high.
• SL HIT Tracking — If SL is broken, the line stops extending and a ‘SL HIT’ label is displayed at the midpoint of the SL line.
• Adjustable Visual Settings — Customize signal label size, SL line width, colors, and more.
• Clean & Lightweight — Optimized for intraday use without cluttering the chart.
How to Use:
You can trade this indicator in two ways:
1. Direct Signal Entry — Take a BUY or SELL trade when a valid ▲/▼ reversal signal forms.
2. SL HIT Re-entry — If an existing SL line is broken and ‘SL HIT’ appears, you can optionally take an opposite side trade in the direction of the SL HIT.
Example:
A BUY signal is generated and an SL line is plotted below.
If price breaks the SL (SL HIT appears), you may consider entering a SELL trade at that point — as it indicates weakness.
Important Notes:
• Works only on 5-min timeframe — Set your chart to 5-min for correct behavior.
• Designed for intraday trading — all signals and SL levels reset at session start.
• Does not carry signals between sessions.
• SL lines and HIT labels provide a clear and simple visual aid for trade management.
---
Scalping

Trend Gauge [BullByte]Trend Gauge
Summary
A multi-factor trend detection indicator that aggregates EMA alignment, VWMA momentum scaling, volume spikes, ATR breakout strength, higher-timeframe confirmation, ADX-based regime filtering, and RSI pivot-divergence penalty into one normalized trend score. It also provides a confidence meter, a Δ Score momentum histogram, divergence highlights, and a compact, scalable dashboard for at-a-glance status.
________________________________________
## 1. Purpose of the Indicator
Why this was built
Traders often monitor several indicators in parallel - EMAs, volume signals, volatility breakouts, higher-timeframe trends, ADX readings, divergence alerts, etc., which can be cumbersome and sometimes contradictory. The “Trend Gauge” indicator was created to consolidate these complementary checks into a single, normalized score that reflects the prevailing market bias (bullish, bearish, or neutral) and its strength. By combining multiple inputs with an adaptive regime filter, scaling contributions by magnitude, and penalizing weakening signals (divergence), this tool aims to reduce noise, highlight genuine trend opportunities, and warn when momentum fades.
Key Design Goals
Signal Aggregation
Merged trend-following signals (EMA crossover, ATR breakout, higher-timeframe confirmation) and momentum signals (VWMA thrust, volume spikes) into a unified score that reflects directional bias more holistically.
Market Regime Awareness
Implemented an ADX-style filter to distinguish between trending and ranging markets, reducing the influence of trend signals during sideways phases to avoid false breakouts.
Magnitude-Based Scaling
Replaced binary contributions with scaled inputs: VWMA thrust and ATR breakout are weighted relative to recent averages, allowing for more nuanced score adjustments based on signal strength.
Momentum Divergence Penalty
Integrated pivot-based RSI divergence detection to slightly reduce the overall score when early signs of momentum weakening are detected, improving risk-awareness in entries.
Confidence Transparency
Added a live confidence metric that shows what percentage of enabled sub-indicators currently agree with the overall bias, making the scoring system more interpretable.
Momentum Acceleration Visualization
Plotted the change in score (Δ Score) as a histogram bar-to-bar, highlighting whether momentum is increasing, flattening, or reversing, aiding in more timely decision-making.
Compact Informational Dashboard
Presented a clean, scalable dashboard that displays each component’s status, the final score, confidence %, detected regime (Trending/Ranging), and a labeled strength gauge for quick visual assessment.
________________________________________
## 2. Why a Trader Should Use It
Main benefits and use cases
1. Unified View: Rather than juggling multiple windows or panels, this indicator delivers a single score synthesizing diverse signals.
2. Regime Filtering: In ranging markets, trend signals often generate false entries. The ADX-based regime filter automatically down-weights trend-following components, helping you avoid chasing false breakouts.
3. Nuanced Momentum & Volatility: VWMA and ATR breakout contributions are normalized by recent averages, so strong moves register strongly while smaller fluctuations are de-emphasized.
4. Early Warning of Weakening: Pivot-based RSI divergence is detected and used to slightly reduce the score when price/momentum diverges, giving a cautionary signal before a full reversal.
5. Confidence Meter: See at a glance how many sub-indicators align with the aggregated bias (e.g., “80% confidence” means 4 out of 5 components agree ). This transparency avoids black-box decisions.
6. Trend Acceleration/Deceleration View: The Δ Score histogram visualizes whether the aggregated score is rising (accelerating trend) or falling (momentum fading), supplementing the main oscillator.
7. Compact Dashboard: A corner table lists each check’s status (“Bull”, “Bear”, “Flat” or “Disabled”), plus overall Score, Confidence %, Regime, Trend Strength label, and a gauge bar. Users can scale text size (Normal, Small, Tiny) without removing elements, so the full picture remains visible even in compact layouts.
8. Customizable & Transparent: All components can be enabled/disabled and parameterized (lengths, thresholds, weights). The full Pine code is open and well-commented, letting users inspect or adapt the logic.
9. Alert-ready: Built-in alert conditions fire when the score crosses weak thresholds to bullish/bearish or returns to neutral, enabling timely notifications.
________________________________________
## 3. Component Rationale (“Why These Specific Indicators?”)
Each sub-component was chosen because it adds complementary information about trend or momentum:
1. EMA Cross
o Basic trend measure: compares a faster EMA vs. a slower EMA. Quickly reflects trend shifts but by itself can whipsaw in sideways markets.
2. VWMA Momentum
o Volume-weighted moving average change indicates momentum with volume context. By normalizing (dividing by a recent average absolute change), we capture the strength of momentum relative to recent history. This scaling prevents tiny moves from dominating and highlights genuinely strong momentum.
3. Volume Spikes
o Sudden jumps in volume combined with price movement often accompany stronger moves or reversals. A binary detection (+1 for bullish spike, -1 for bearish spike) flags high-conviction bars.
4. ATR Breakout
o Detects price breaking beyond recent highs/lows by a multiple of ATR. Measures breakout strength by how far beyond the threshold price moves relative to ATR, capped to avoid extreme outliers. This gives a volatility-contextual trend signal.
5. Higher-Timeframe EMA Alignment
o Confirms whether the shorter-term trend aligns with a higher timeframe trend. Uses request.security with lookahead_off to avoid future data. When multiple timeframes agree, confidence in direction increases.
6. ADX Regime Filter (Manual Calculation)
o Computes directional movement (+DM/–DM), smoothes via RMA, computes DI+ and DI–, then a DX and ADX-like value. If ADX ≥ threshold, market is “Trending” and trend components carry full weight; if ADX < threshold, “Ranging” mode applies a configurable weight multiplier (e.g., 0.5) to trend-based contributions, reducing false signals in sideways conditions. Volume spikes remain binary (optional behavior; can be adjusted if desired).
7. RSI Pivot-Divergence Penalty
o Uses ta.pivothigh / ta.pivotlow with a lookback to detect pivot highs/lows on price and corresponding RSI values. When price makes a higher high but RSI makes a lower high (bearish divergence), or price makes a lower low but RSI makes a higher low (bullish divergence), a divergence signal is set. Rather than flipping the trend outright, the indicator subtracts (or adds) a small penalty (configurable) from the aggregated score if it would weaken the current bias. This subtle adjustment warns of weakening momentum without overreacting to noise.
8. Confidence Meter
o Counts how many enabled components currently agree in direction with the aggregated score (i.e., component sign × score sign > 0). Displays this as a percentage. A high percentage indicates strong corroboration; a low percentage warns of mixed signals.
9. Δ Score Momentum View
o Plots the bar-to-bar change in the aggregated score (delta_score = score - score ) as a histogram. When positive, bars are drawn in green above zero; when negative, bars are drawn in red below zero. This reveals acceleration (rising Δ) or deceleration (falling Δ), supplementing the main oscillator.
10. Dashboard
• A table in the indicator pane’s top-right with 11 rows:
1. EMA Cross status
2. VWMA Momentum status
3. Volume Spike status
4. ATR Breakout status
5. Higher-Timeframe Trend status
6. Score (numeric)
7. Confidence %
8. Regime (“Trending” or “Ranging”)
9. Trend Strength label (e.g., “Weak Bullish Trend”, “Strong Bearish Trend”)
10. Gauge bar visually representing score magnitude
• All rows always present; size_opt (Normal, Small, Tiny) only changes text size via text_size, not which elements appear. This ensures full transparency.
________________________________________
## 4. What Makes This Indicator Stand Out
• Regime-Weighted Multi-Factor Score: Trend and momentum signals are adaptively weighted by market regime (trending vs. ranging) , reducing false signals.
• Magnitude Scaling: VWMA and ATR breakout contributions are normalized by recent average momentum or ATR, giving finer gradation compared to simple ±1.
• Integrated Divergence Penalty: Divergence directly adjusts the aggregated score rather than appearing as a separate subplot; this influences alerts and trend labeling in real time.
• Confidence Meter: Shows the percentage of sub-signals in agreement, providing transparency and preventing blind trust in a single metric.
• Δ Score Histogram Momentum View: A histogram highlights acceleration or deceleration of the aggregated trend score, helping detect shifts early.
• Flexible Dashboard: Always-visible component statuses and summary metrics in one place; text size scaling keeps the full picture available in cramped layouts.
• Lookahead-Safe HTF Confirmation: Uses lookahead_off so no future data is accessed from higher timeframes, avoiding repaint bias.
• Repaint Transparency: Divergence detection uses pivot functions that inherently confirm only after lookback bars; description documents this lag so users understand how and when divergence labels appear.
• Open-Source & Educational: Full, well-commented Pine v6 code is provided; users can learn from its structure: manual ADX computation, conditional plotting with series = show ? value : na, efficient use of table.new in barstate.islast, and grouped inputs with tooltips.
• Compliance-Conscious: All plots have descriptive titles; inputs use clear names; no unnamed generic “Plot” entries; manual ADX uses RMA; all request.security calls use lookahead_off. Code comments mention repaint behavior and limitations.
________________________________________
## 5. Recommended Timeframes & Tuning
• Any Timeframe: The indicator works on small (e.g., 1m) to large (daily, weekly) timeframes. However:
o On very low timeframes (<1m or tick charts), noise may produce frequent whipsaws. Consider increasing smoothing lengths, disabling certain components (e.g., volume spike if volume data noisy), or using a larger pivot lookback for divergence.
o On higher timeframes (daily, weekly), consider longer lookbacks for ATR breakout or divergence, and set Higher-Timeframe trend appropriately (e.g., 4H HTF when on 5 Min chart).
• Defaults & Experimentation: Default input values are chosen to be balanced for many liquid markets. Users should test with replay or historical analysis on their symbol/timeframe and adjust:
o ADX threshold (e.g., 20–30) based on instrument volatility.
o VWMA and ATR scaling lengths to match average volatility cycles.
o Pivot lookback for divergence: shorter for faster markets, longer for slower ones.
• Combining with Other Analysis: Use in conjunction with price action, support/resistance, candlestick patterns, order flow, or other tools as desired. The aggregated score and alerts can guide attention but should not be the sole decision-factor.
________________________________________
## 6. How Scoring and Logic Works (Step-by-Step)
1. Compute Sub-Scores
o EMA Cross: Evaluate fast EMA > slow EMA ? +1 : fast EMA < slow EMA ? -1 : 0.
o VWMA Momentum: Calculate vwma = ta.vwma(close, length), then vwma_mom = vwma - vwma . Normalize: divide by recent average absolute momentum (e.g., ta.sma(abs(vwma_mom), lookback)), clip to .
o Volume Spike: Compute vol_SMA = ta.sma(volume, len). If volume > vol_SMA * multiplier AND price moved up ≥ threshold%, assign +1; if moved down ≥ threshold%, assign -1; else 0.
o ATR Breakout: Determine recent high/low over lookback. If close > high + ATR*mult, compute distance = close - (high + ATR*mult), normalize by ATR, cap at a configured maximum. Assign positive contribution. Similarly for bearish breakout below low.
o Higher-Timeframe Trend: Use request.security(..., lookahead=barmerge.lookahead_off) to fetch HTF EMAs; assign +1 or -1 based on alignment.
2. ADX Regime Weighting
o Compute manual ADX: directional movements (+DM, –DM), smoothed via RMA, DI+ and DI–, then DX and ADX via RMA. If ADX ≥ threshold, market is considered “Trending”; otherwise “Ranging.”
o If trending, trend-based contributions (EMA, VWMA, ATR, HTF) use full weight = 1.0. If ranging, use weight = ranging_weight (e.g., 0.5) to down-weight them. Volume spike stays binary ±1 (optional to change if desired).
3. Aggregate Raw Score
o Sum weighted contributions of all enabled components. Count the number of enabled components; if zero, default count = 1 to avoid division by zero.
4. Divergence Penalty
o Detect pivot highs/lows on price and corresponding RSI values, using a lookback. When price and RSI diverge (bearish or bullish divergence), check if current raw score is in the opposing direction:
If bearish divergence (price higher high, RSI lower high) and raw score currently positive, subtract a penalty (e.g., 0.5).
If bullish divergence (price lower low, RSI higher low) and raw score currently negative, add a penalty.
o This reduces score magnitude to reflect weakening momentum, without flipping the trend outright.
5. Normalize and Smooth
o Normalized score = (raw_score / number_of_enabled_components) * 100. This yields a roughly range.
o Optional EMA smoothing of this normalized score to reduce noise.
6. Interpretation
o Sign: >0 = net bullish bias; <0 = net bearish bias; near zero = neutral.
o Magnitude Zones: Compare |score| to thresholds (Weak, Medium, Strong) to label trend strength (e.g., “Weak Bullish Trend”, “Medium Bearish Trend”, “Strong Bullish Trend”).
o Δ Score Histogram: The histogram bars from zero show change from previous bar’s score; positive bars indicate acceleration, negative bars indicate deceleration.
o Confidence: Percentage of sub-indicators aligned with the score’s sign.
o Regime: Indicates whether trend-based signals are fully weighted or down-weighted.
________________________________________
## 7. Oscillator Plot & Visualization: How to Read It
Main Score Line & Area
The oscillator plots the aggregated score as a line, with colored fill: green above zero for bullish area, red below zero for bearish area. Horizontal reference lines at ±Weak, ±Medium, and ±Strong thresholds mark zones: crossing above +Weak suggests beginning of bullish bias, above +Medium for moderate strength, above +Strong for strong trend; similarly for bearish below negative thresholds.
Δ Score Histogram
If enabled, a histogram shows score - score . When positive, bars appear in green above zero, indicating accelerating bullish momentum; when negative, bars appear in red below zero, indicating decelerating or reversing momentum. The height of each bar reflects the magnitude of change in the aggregated score from the prior bar.
Divergence Highlight Fill
If enabled, when a pivot-based divergence is confirmed:
• Bullish Divergence : fill the area below zero down to –Weak threshold in green, signaling potential reversal from bearish to bullish.
• Bearish Divergence : fill the area above zero up to +Weak threshold in red, signaling potential reversal from bullish to bearish.
These fills appear with a lag equal to pivot lookback (the number of bars needed to confirm the pivot). They do not repaint after confirmation, but users must understand this lag.
Trend Direction Label
When score crosses above or below the Weak threshold, a small label appears near the score line reading “Bullish” or “Bearish.” If the score returns within ±Weak, the label “Neutral” appears. This helps quickly identify shifts at the moment they occur.
Dashboard Panel
In the indicator pane’s top-right, a table shows:
1. EMA Cross status: “Bull”, “Bear”, “Flat”, or “Disabled”
2. VWMA Momentum status: similarly
3. Volume Spike status: “Bull”, “Bear”, “No”, or “Disabled”
4. ATR Breakout status: “Bull”, “Bear”, “No”, or “Disabled”
5. Higher-Timeframe Trend status: “Bull”, “Bear”, “Flat”, or “Disabled”
6. Score: numeric value (rounded)
7. Confidence: e.g., “80%” (colored: green for high, amber for medium, red for low)
8. Regime: “Trending” or “Ranging” (colored accordingly)
9. Trend Strength: textual label based on magnitude (e.g., “Medium Bullish Trend”)
10. Gauge: a bar of blocks representing |score|/100
All rows remain visible at all times; changing Dashboard Size only scales text size (Normal, Small, Tiny).
________________________________________
## 8. Example Usage (Illustrative Scenario)
Example: BTCUSD 5 Min
1. Setup: Add “Trend Gauge ” to your BTCUSD 5 Min chart. Defaults: EMAs (8/21), VWMA 14 with lookback 3, volume spike settings, ATR breakout 14/5, HTF = 5m (or adjust to 4H if preferred), ADX threshold 25, ranging weight 0.5, divergence RSI length 14 pivot lookback 5, penalty 0.5, smoothing length 3, thresholds Weak=20, Medium=50, Strong=80. Dashboard Size = Small.
2. Trend Onset: At some point, price breaks above recent high by ATR multiple, volume spikes upward, faster EMA crosses above slower EMA, HTF EMA also bullish, and ADX (manual) ≥ threshold → aggregated score rises above +20 (Weak threshold) into +Medium zone. Dashboard shows “Bull” for EMA, VWMA, Vol Spike, ATR, HTF; Score ~+60–+70; Confidence ~100%; Regime “Trending”; Trend Strength “Medium Bullish Trend”; Gauge ~6–7 blocks. Δ Score histogram bars are green and rising, indicating accelerating bullish momentum. Trader notes the alignment.
3. Divergence Warning: Later, price makes a slightly higher high but RSI fails to confirm (lower RSI high). Pivot lookback completes; the indicator highlights a bearish divergence fill above zero and subtracts a small penalty from the score, causing score to stall or retrace slightly. Dashboard still bullish but score dips toward +Weak. This warns the trader to tighten stops or take partial profits.
4. Trend Weakens: Score eventually crosses below +Weak back into neutral; a “Neutral” label appears, and a “Neutral Trend” alert fires if enabled. Trader exits or avoids new long entries. If score subsequently crosses below –Weak, a “Bearish” label and alert occur.
5. Customization: If the trader finds VWMA noise too frequent on this instrument, they may disable VWMA or increase lookback. If ATR breakouts are too rare, adjust ATR length or multiplier. If ADX threshold seems off, tune threshold. All these adjustments are explained in Inputs section.
6. Visualization: The screenshot shows the main score oscillator with colored areas, reference lines at ±20/50/80, Δ Score histogram bars below/above zero, divergence fill highlighting potential reversal, and the dashboard table in the top-right.
________________________________________
## 9. Inputs Explanation
A concise yet clear summary of inputs helps users understand and adjust:
1. General Settings
• Theme (Dark/Light): Choose background-appropriate colors for the indicator pane.
• Dashboard Size (Normal/Small/Tiny): Scales text size only; all dashboard elements remain visible.
2. Indicator Settings
• Enable EMA Cross: Toggle on/off basic EMA alignment check.
o Fast EMA Length and Slow EMA Length: Periods for EMAs.
• Enable VWMA Momentum: Toggle VWMA momentum check.
o VWMA Length: Period for VWMA.
o VWMA Momentum Lookback: Bars to compare VWMA to measure momentum.
• Enable Volume Spike: Toggle volume spike detection.
o Volume SMA Length: Period to compute average volume.
o Volume Spike Multiplier: How many times above average volume qualifies as spike.
o Min Price Move (%): Minimum percent change in price during spike to qualify as bullish or bearish.
• Enable ATR Breakout: Toggle ATR breakout detection.
o ATR Length: Period for ATR.
o Breakout Lookback: Bars to look back for recent highs/lows.
o ATR Multiplier: Multiplier for breakout threshold.
• Enable Higher Timeframe Trend: Toggle HTF EMA alignment.
o Higher Timeframe: E.g., “5” for 5-minute when on 1-minute chart, or “60” for 5 Min when on 15m, etc. Uses lookahead_off.
• Enable ADX Regime Filter: Toggles regime-based weighting.
o ADX Length: Period for manual ADX calculation.
o ADX Threshold: Value above which market considered trending.
o Ranging Weight Multiplier: Weight applied to trend components when ADX < threshold (e.g., 0.5).
• Scale VWMA Momentum: Toggle normalization of VWMA momentum magnitude.
o VWMA Mom Scale Lookback: Period for average absolute VWMA momentum.
• Scale ATR Breakout Strength: Toggle normalization of breakout distance by ATR.
o ATR Scale Cap: Maximum multiple of ATR used for breakout strength.
• Enable Price-RSI Divergence: Toggle divergence detection.
o RSI Length for Divergence: Period for RSI.
o Pivot Lookback for Divergence: Bars on each side to identify pivot high/low.
o Divergence Penalty: Amount to subtract/add to score when divergence detected (e.g., 0.5).
3. Score Settings
• Smooth Score: Toggle EMA smoothing of normalized score.
• Score Smoothing Length: Period for smoothing EMA.
• Weak Threshold: Absolute score value under which trend is considered weak or neutral.
• Medium Threshold: Score above Weak but below Medium is moderate.
• Strong Threshold: Score above this indicates strong trend.
4. Visualization Settings
• Show Δ Score Histogram: Toggle display of the bar-to-bar change in score as a histogram. Default true.
• Show Divergence Fill: Toggle background fill highlighting confirmed divergences. Default true.
Each input has a tooltip in the code.
________________________________________
## 10. Limitations, Repaint Notes, and Disclaimers
10.1. Repaint & Lag Considerations
• Pivot-Based Divergence Lag: The divergence detection uses ta.pivothigh / ta.pivotlow with a specified lookback. By design, a pivot is only confirmed after the lookback number of bars. As a result:
o Divergence labels or fills appear with a delay equal to the pivot lookback.
o Once the pivot is confirmed and the divergence is detected, the fill/label does not repaint thereafter, but you must understand and accept this lag.
o Users should not treat divergence highlights as predictive signals without additional confirmation, because they appear after the pivot has fully formed.
• Higher-Timeframe EMA Alignment: Uses request.security(..., lookahead=barmerge.lookahead_off), so no future data from the higher timeframe is used. This avoids lookahead bias and ensures signals are based only on completed higher-timeframe bars.
• No Future Data: All calculations are designed to avoid using future information. For example, manual ADX uses RMA on past data; security calls use lookahead_off.
10.2. Market & Noise Considerations
• In very choppy or low-liquidity markets, some components (e.g., volume spikes or VWMA momentum) may be noisy. Users can disable or adjust those components’ parameters.
• On extremely low timeframes, noise may dominate; consider smoothing lengths or disabling certain features.
• On very high timeframes, pivots and breakouts occur less frequently; adjust lookbacks accordingly to avoid sparse signals.
10.3. Not a Standalone Trading System
• This is an indicator, not a complete trading strategy. It provides signals and context but does not manage entries, exits, position sizing, or risk management.
• Users must combine it with their own analysis, money management, and confirmations (e.g., price patterns, support/resistance, fundamental context).
• No guarantees: past behavior does not guarantee future performance.
10.4. Disclaimers
• Educational Purposes Only: The script is provided as-is for educational and informational purposes. It does not constitute financial, investment, or trading advice.
• Use at Your Own Risk: Trading involves risk of loss. Users should thoroughly test and use proper risk management.
• No Guarantees: The author is not responsible for trading outcomes based on this indicator.
• License: Published under Mozilla Public License 2.0; code is open for viewing and modification under MPL terms.
________________________________________
## 11. Alerts
• The indicator defines three alert conditions:
1. Bullish Trend: when the aggregated score crosses above the Weak threshold.
2. Bearish Trend: when the score crosses below the negative Weak threshold.
3. Neutral Trend: when the score returns within ±Weak after being outside.
Good luck
– BullByte

CHN BUY SELL with EMA 200Overview
This indicator combines RSI 7 momentum signals with EMA 200 trend filtering to generate high-probability BUY and SELL entry points. It uses colored candles to highlight key market conditions and displays clear trading signals with built-in cooldown periods to prevent signal spam.
Key Features
Colored Candles: Visual momentum indicators based on RSI 7 levels
Trend Filtering: EMA 200 confirms overall market direction
Signal Cooldown: Prevents over-trading with adjustable waiting periods
Clean Interface: Simple BUY/SELL labels without clutter
How It Works
Candle Coloring System
Yellow Candles: Appear when RSI 7 ≥ 70 (overbought momentum)
Purple Candles: Appear when RSI 7 ≤ 30 (oversold momentum)
Normal Candles: All other market conditions
Trading Signals
BUY Signal: Triggered when closing price > EMA 200 AND yellow candle appears
SELL Signal: Triggered when closing price < EMA 200 AND purple candle appears
Signal Cooldown
After a BUY or SELL signal appears, the same signal type is suppressed for a specified number of candles (default: 5) to prevent excessive signals in ranging markets.
Settings
RSI 7 Length: Period for RSI calculation (default: 7)
RSI 7 Overbought: Threshold for yellow candles (default: 70)
RSI 7 Oversold: Threshold for purple candles (default: 30)
EMA Length: Period for trend filter (default: 200)
Signal Cooldown: Candles to wait between same signal type (default: 5)
How to Use
Apply the indicator to your chart
Look for yellow or purple colored candles
For LONG entries: Wait for yellow candle above EMA 200, then enter BUY when signal appears
For SHORT entries: Wait for purple candle below EMA 200, then enter SELL when signal appears
Use appropriate risk management and position sizing
Best Practices
Works best on timeframes M15 and higher
Suitable for Forex, Gold, Crypto, and Stock markets
Consider market volatility when setting stop-loss and take-profit levels
Use in conjunction with proper risk management strategies
Technical Details
Overlay: True (plots directly on price chart)
Calculation: Based on RSI momentum and EMA trend analysis
Signal Logic: Combines momentum exhaustion with trend direction
Visual Feedback: Colored candles provide immediate market condition awareness

Ultimate Scalping Tool[BullByte]Overview
The Ultimate Scalping Tool is an open-source TradingView indicator built for scalpers and short-term traders released under the Mozilla Public License 2.0. It uses a custom Quantum Flux Candle (QFC) oscillator to combine multiple market forces into one visual signal. In plain terms, the script reads momentum, trend strength, volatility, and volume together and plots a special “candlestick” each bar (the QFC) that reflects the overall market bias. This unified view makes it easier to spot entries and exits: the tool labels signals as Strong Buy/Sell, Pullback (a brief retracement in a trend), Early Entry, or Exit Warning . It also provides color-coded alerts and a small dashboard of metrics. In practice, traders see green/red oscillator bars and symbols on the chart when conditions align, helping them scalp or trend-follow without reading multiple separate indicators.
Core Components
Quantum Flux Candle (QFC) Construction
The QFC is the heart of the indicator. Rather than using raw price, it creates a candlestick-like bar from the underlying oscillator values. Each QFC bar has an “open,” “high/low,” and “close” derived from calculated momentum and volatility inputs for that period . In effect, this turns the oscillator into intuitive candle patterns so traders can recognize momentum shifts visually. (For comparison, note that Heikin-Ashi candles “have a smoother look because take an average of the movement”. The QFC instead represents exact oscillator readings, so it reflects true momentum changes without hiding price action.) Colors of QFC bars change dynamically (e.g. green for bullish momentum, red for bearish) to highlight shifts. This is the first open-source QFC oscillator that dynamically weights four non-correlated indicators with moving thresholds, which makes it a unique indicator on its own.
Oscillator Normalization & Adaptive Weights
The script normalizes its oscillator to a fixed scale (for example, a 0–100 range much like the RSI) so that various inputs can be compared fairly. It then applies adaptive weighting: the relative influence of trend, momentum, volatility or volume signals is automatically adjusted based on current market conditions. For instance, in very volatile markets the script might weight volatility more heavily, or in a strong trend it might give extra weight to trend direction. Normalizing data and adjusting weights helps keep the QFC sensitive but stable (normalization ensures all inputs fit a common scale).
Trend/Momentum/Volume/Volatility Fusion
Unlike a typical single-factor oscillator, the QFC oscillator fuses four aspects at once. It may compute, for example, a trend indicator (such as an ADX or moving average slope), a momentum measure (like RSI or Rate-of-Change), a volume-based pressure (similar to MFI/OBV), and a volatility measure (like ATR) . These different values are combined into one composite oscillator. This “multi-dimensional” approach follows best practices of using non-correlated indicators (trend, momentum, volume, volatility) for confirmation. By encoding all these signals in one line, a high QFC reading means that trend, momentum, and volume are all aligned, whereas a neutral reading might mean mixed conditions. This gives traders a comprehensive picture of market strength.
Signal Classification
The script interprets the QFC oscillator to label trades. For example:
• Strong Buy/Sell : Triggered when the oscillator crosses a high-confidence threshold (e.g. breaks clearly above zero with strong slope), indicating a well-confirmed move. This is like seeing a big green/red QFC candle aligned with the trend.
• Pullbacks : Identified when the trend is up but momentum dips briefly. A Pullback Buy appears if the overall trend is bullish but the oscillator has a short retracement – a typical buying opportunity in an uptrend. (A pullback is “a brief decline or pause in a generally upward price trend”.)
• Early Buy/Sell : Marks an initial swing in the oscillator suggesting a possible new trend, before it is fully confirmed. It’s a hint of momentum building (an early-warning signal), not as strong as the confirmed “Strong” signal.
• Exit Warnings : Issued when momentum peaks or reverses. For instance, if the QFC bars reach a high and start turning red/green opposite, the indicator warns that the move may be ending. In other words, a Momentum Peak is the point of maximum strength after which weakness may follow.
These categories correspond to typical trading concepts: Pullback (temporary reversal in an uptrend), Early Buy (an initial bullish cross), Strong Buy (confirmed bullish momentum), and Momentum Peak (peak oscillator value suggesting exhaustion).
Filters (DI Reversal, Dynamic Thresholds, HTF EMA/ADX)
Extra filters help avoid bad trades. A DI Reversal filter uses the +DI/–DI lines (from the ADX system) to require that the trend direction confirms the signal . For example, it might ignore a buy signal if the +DI is still below –DI. Dynamic Thresholds adjust signal levels on-the-fly: rather than fixed “overbought” lines, they move with volatility so signals happen under appropriate market stress. An optional High-Timeframe EMA or ADX filter adds a check against a larger timeframe trend: for instance, only taking a trade if price is above the weekly EMA or if weekly ADX shows a strong trend. (Notably, the ADX is “a technical indicator used by traders to determine the strength of a price trend”, so requiring a high-timeframe ADX avoids trading against the bigger trend.)
Dashboard Metrics & Color Logic
The Dashboard in the Ultimate Scalping Tool (UST) serves as a centralized information hub, providing traders with real-time insights into market conditions, trend strength, momentum, volume pressure, and trade signals. It is highly customizable, allowing users to adjust its appearance and content based on their preferences.
1. Dashboard Layout & Customization
Short vs. Extended Mode : Users can toggle between a compact view (9 rows) and an extended view (13 rows) via the `Short Dashboard` input.
Text Size Options : The dashboard supports three text sizes— Tiny, Small, and Normal —adjustable via the `Dashboard Text Size` input.
Positioning : The dashboard is positioned in the top-right corner by default but can be moved if modified in the script.
2. Key Metrics Displayed
The dashboard presents critical trading metrics in a structured table format:
Trend (TF) : Indicates the current trend direction (Strong Bullish, Moderate Bullish, Sideways, Moderate Bearish, Strong Bearish) based on normalized trend strength (normTrend) .
Momentum (TF) : Displays momentum status (Strong Bullish/Bearish or Neutral) derived from the oscillator's position relative to dynamic thresholds.
Volume (CMF) : Shows buying/selling pressure levels (Very High Buying, High Selling, Neutral, etc.) based on the Chaikin Money Flow (CMF) indicator.
Basic & Advanced Signals:
Basic Signal : Provides simple trade signals (Strong Buy, Strong Sell, Pullback Buy, Pullback Sell, No Trade).
Advanced Signal : Offers nuanced signals (Early Buy/Sell, Momentum Peak, Weakening Momentum, etc.) with color-coded alerts.
RSI : Displays the Relative Strength Index (RSI) value, colored based on overbought (>70), oversold (<30), or neutral conditions.
HTF Filter : Indicates the higher timeframe trend status (Bullish, Bearish, Neutral) when using the Leading HTF Filter.
VWAP : Shows the V olume-Weighted Average Price and whether the current price is above (bullish) or below (bearish) it.
ADX : Displays the Average Directional Index (ADX) value, with color highlighting whether it is rising (green) or falling (red).
Market Mode : Shows the selected market type (Crypto, Stocks, Options, Forex, Custom).
Regime : Indicates volatility conditions (High, Low, Moderate) based on the **ATR ratio**.
3. Filters Status Panel
A secondary panel displays the status of active filters, helping traders quickly assess which conditions are influencing signals:
- DI Reversal Filter: On/Off (confirms reversals before generating signals).
- Dynamic Thresholds: On/Off (adjusts buy/sell thresholds based on volatility).
- Adaptive Weighting: On/Off (auto-adjusts oscillator weights for trend/momentum/volatility).
- Early Signal: On/Off (enables early momentum-based signals).
- Leading HTF Filter: On/Off (applies higher timeframe trend confirmation).
4. Visual Enhancements
Color-Coded Cells : Each metric is color-coded (green for bullish, red for bearish, gray for neutral) for quick interpretation.
Dynamic Background : The dashboard background adapts to market conditions (bullish/bearish/neutral) based on ADX and DI trends.
Customizable Reference Lines : Users can enable/disable fixed reference lines for the oscillator.
How It(QFC) Differs from Traditional Indicators
Quantum Flux Candle (QFC) Versus Heikin-Ashi
Heikin-Ashi candles smooth price by averaging (HA’s open/close use averages) so they show trend clearly but hide true price (the current HA bar’s close is not the real price). QFC candles are different: they are oscillator values, not price averages . A Heikin-Ashi chart “has a smoother look because it is essentially taking an average of the movement”, which can cause lag. The QFC instead shows the raw combined momentum each bar, allowing faster recognition of shifts. In short, HA is a smoothed price chart; QFC is a momentum-based chart.
Versus Standard Oscillators
Common oscillators like RSI or MACD use fixed formulas on price (or price+volume). For example, RSI “compares gains and losses and normalizes this value on a scale from 0 to 100”, reflecting pure price momentum. MFI is similar but adds volume. These indicators each show one dimension: momentum or volume. The Ultimate Scalping Tool’s QFC goes further by integrating trend strength and volatility too. In practice, this means a move that looks strong on RSI might be downplayed by low volume or weak trend in QFC. As one source notes, using multiple non-correlated indicators (trend, momentum, volume, volatility) provides a more complete market picture. The QFC’s multi-factor fusion is unique – it is effectively a multi-dimensional oscillator rather than a traditional single-input one.
Signal Style
Traditional oscillators often use crossovers (RSI crossing 50) or fixed zones (MACD above zero) for signals. The Ultimate Scalping Tool’s signals are custom-classified: it explicitly labels pullbacks, early entries, and strong moves. These terms go beyond a typical indicator’s generic “buy”/“sell.” In other words, it packages a strategy around the oscillator, which traders can backtest or observe without reading code.
Key Term Definitions
• Pullback : A short-term dip or consolidation in an uptrend. In this script, a Pullback Buy appears when price is generally rising but shows a brief retracement. (As defined by Investopedia, a pullback is “a brief decline or pause in a generally upward price trend”.)
• Early Buy/Sell : An initial or tentative entry signal. It means the oscillator first starts turning positive (or negative) before a full trend has developed. It’s an early indication that a trend might be starting.
• Strong Buy/Sell : A confident entry signal when multiple conditions align. This label is used when momentum is already strong and confirmed by trend/volume filters, offering a higher-probability trade.
• Momentum Peak : The point where bullish (or bearish) momentum reaches its maximum before weakening. When the oscillator value stops rising (or falling) and begins to reverse, the script flags it as a peak – signaling that the current move could be overextended.
What is the Flux MA?
The Flux MA (Moving Average) is an Exponential Moving Average (EMA) applied to a normalized oscillator, referred to as FM . Its purpose is to smooth out the fluctuations of the oscillator, providing a clearer picture of the underlying trend direction and strength. Think of it as a dynamic baseline that the oscillator moves above or below, helping you determine whether the market is trending bullish or bearish.
How it’s calculated (Flux MA):
1.The oscillator is normalized (scaled to a range, typically between 0 and 1, using a default scale factor of 100.0).
2.An EMA is applied to this normalized value (FM) over a user-defined period (default is 10 periods).
3.The result is rescaled back to the oscillator’s original range for plotting.
Why it matters : The Flux MA acts like a support or resistance level for the oscillator, making it easier to spot trend shifts.
Color of the Flux Candle
The Quantum Flux Candle visualizes the normalized oscillator (FM) as candlesticks, with colors that indicate specific market conditions based on the relationship between the FM and the Flux MA. Here’s what each color means:
• Green : The FM is above the Flux MA, signaling bullish momentum. This suggests the market is trending upward.
• Red : The FM is below the Flux MA, signaling bearish momentum. This suggests the market is trending downward.
• Yellow : Indicates strong buy conditions (e.g., a "Strong Buy" signal combined with a positive trend). This is a high-confidence signal to go long.
• Purple : Indicates strong sell conditions (e.g., a "Strong Sell" signal combined with a negative trend). This is a high-confidence signal to go short.
The candle mode shows the oscillator’s open, high, low, and close values for each period, similar to price candlesticks, but it’s the color that provides the quick visual cue for trading decisions.
How to Trade the Flux MA with Respect to the Candle
Trading with the Flux MA and Quantum Flux Candle involves using the MA as a trend indicator and the candle colors as entry and exit signals. Here’s a step-by-step guide:
1. Identify the Trend Direction
• Bullish Trend : The Flux Candle is green and positioned above the Flux MA. This indicates upward momentum.
• Bearish Trend : The Flux Candle is red and positioned below the Flux MA. This indicates downward momentum.
The Flux MA serves as the reference line—candles above it suggest buying pressure, while candles below it suggest selling pressure.
2. Interpret Candle Colors for Trade Signals
• Green Candle : General bullish momentum. Consider entering or holding a long position.
• Red Candle : General bearish momentum. Consider entering or holding a short position.
• Yellow Candle : A strong buy signal. This is an ideal time to enter a long trade.
• Purple Candle : A strong sell signal. This is an ideal time to enter a short trade.
3. Enter Trades Based on Crossovers and Colors
• Long Entry : Enter a buy position when the Flux Candle turns green and crosses above the Flux MA. If it turns yellow, this is an even stronger signal to go long.
• Short Entry : Enter a sell position when the Flux Candle turns red and crosses below the Flux MA. If it turns purple, this is an even stronger signal to go short.
4. Exit Trades
• Exit Long : Close your buy position when the Flux Candle turns red or crosses below the Flux MA, indicating the bullish trend may be reversing.
• Exit Short : Close your sell position when the Flux Candle turns green or crosses above the Flux MA, indicating the bearish trend may be reversing.
•You might also exit a long trade if the candle changes from yellow to green (weakening strong buy signal) or a short trade from purple to red (weakening strong sell signal).
5. Use Additional Confirmation
To avoid false signals, combine the Flux MA and candle signals with other indicators or dashboard metrics (e.g., trend strength, momentum, or volume pressure). For example:
•A yellow candle with a " Strong Bullish " trend and high buying volume is a robust long signal.
•A red candle with a " Moderate Bearish " trend and neutral momentum might need more confirmation before shorting.
Practical Example
Imagine you’re scalping a cryptocurrency:
• Long Trade : The Flux Candle turns yellow and is above the Flux MA, with the dashboard showing "Strong Buy" and high buying volume. You enter a long position. You exit when the candle turns red and dips below the Flux MA.
• Short Trade : The Flux Candle turns purple and crosses below the Flux MA, with a "Strong Sell" signal on the dashboard. You enter a short position. You exit when the candle turns green and crosses above the Flux MA.
Market Presets and Adaptation
This indicator is designed to work on any market with candlestick price data (stocks, crypto, forex, indices, etc.). To handle different behavior, it provides presets for major asset classes. Selecting a “Stocks,” “Crypto,” “Forex,” or “Options” preset automatically loads a set of parameter values optimized for that market . For example, a crypto preset might use a shorter lookback or higher sensitivity to account for crypto’s high volatility, while a stocks preset might use slightly longer smoothing since stocks often trend more slowly. In practice, this means the same core QFC logic applies across markets, but the thresholds and smoothing adjust so signals remain relevant for each asset type.
Usage Guidelines
• Recommended Timeframes : Optimized for 1 minute to 15 minute intraday charts. Can also be used on higher timeframes for short term swings.
• Market Types : Select “Crypto,” “Stocks,” “Forex,” or “Options” to auto tune periods, thresholds and weights. Use “Custom” to manually adjust all inputs.
• Interpreting Signals : Always confirm a signal by checking that trend, volume, and VWAP agree on the dashboard. A green “Strong Buy” arrow with green trend, green volume, and price > VWAP is highest probability.
• Adjusting Sensitivity : To reduce false signals in fast markets, enable DI Reversal Confirmation and Dynamic Thresholds. For more frequent entries in trending environments, enable Early Entry Trigger.
• Risk Management : This tool does not plot stop loss or take profit levels. Users should define their own risk parameters based on support/resistance or volatility bands.
Background Shading
To give you an at-a-glance sense of market regime without reading numbers, the indicator automatically tints the chart background in three modes—neutral, bullish and bearish—with two levels of intensity (light vs. dark):
Neutral (Gray)
When ADX is below 20 the market is considered “no trend” or too weak to trade. The background fills with a light gray (high transparency) so you know to sit on your hands.
Bullish (Green)
As soon as ADX rises above 20 and +DI exceeds –DI, the background turns a semi-transparent green, signaling an emerging uptrend. When ADX climbs above 30 (strong trend), the green becomes more opaque—reminding you that trend-following signals (Strong Buy, Pullback) carry extra weight.
Bearish (Red)
Similarly, if –DI exceeds +DI with ADX >20, you get a light red tint for a developing downtrend, and a darker, more solid red once ADX surpasses 30.
By dynamically varying both hue (green vs. red vs. gray) and opacity (light vs. dark), the background instantly communicates trend strength and direction—so you always know whether to favor breakout-style entries (in a strong trend) or stay flat during choppy, low-ADX conditions.
The setup shown in the above chart snapshot is BTCUSD 15 min chart : Binance for reference.
Disclaimer
No indicator guarantees profits. Backtest or paper trade this tool to understand its behavior in your market. Always use proper position sizing and stop loss orders.
Good luck!
- BullByte

ATR Volatility giua64ATR Volatility giua64 – Smart Signal + VIX Filter
📘 Script Explanation (in English)
Title: ATR Volatility giua64 – Smart Signal + VIX Filter
This script analyzes market volatility using the Average True Range (ATR) and compares it to its moving average to determine whether volatility is HIGH, MEDIUM, or LOW.
It includes:
✅ Custom or preset configurations for different asset classes (Forex, Indices, Gold, etc.).
✅ An optional external volatility index input (like the VIX) to refine directional bias.
✅ A directional signal (LONG, SHORT, FLAT) based on ATR strength, direction, and external volatility conditions.
✅ A clean visual table showing key values such as ATR, ATR average, ATR %, VIX level, current range, extended range, and final signal.
This tool is ideal for traders looking to:
Monitor the intensity of price movements
Filter trading strategies based on volatility conditions
Identify momentum acceleration or exhaustion
⚙️ Settings Guide
Here’s a breakdown of the user inputs:
🔹 ATR Settings
Setting Description
ATR Length Number of periods for ATR calculation (default: 14)
ATR Smoothing Type of moving average used (RMA, SMA, EMA, WMA)
ATR Average Length Period for the ATR moving average baseline
🔹 Asset Class Preset
Choose between:
Manual – Define your own point multiplier and thresholds
Forex (Pips) – Auto-set for FX markets (high precision)
Indices (0.1 Points) – For index instruments like DAX or S&P
Gold (USD) – Preset suitable for XAU/USD
If Manual is selected, configure:
Setting Description
Points Multiplier Multiplies raw price ranges into useful units (e.g., 10 for Gold)
Low Volatility Threshold Threshold to define "LOW" volatility
High Volatility Threshold Threshold to define "HIGH" volatility
🔹 Extended Range and VIX
Setting Description
Timeframe for Extended High/Low Used to compare larger price ranges (e.g., Daily or Weekly)
External Volatility Index (VIX) Symbol for a volatility index like "VIX" or "EUVI"
Low VIX Threshold Below this level, VIX is considered "low" (default: 20)
High VIX Threshold Above this level, VIX is considered "high" (default: 30)
🔹 Table Display
Setting Description
Table Position Where the visual table appears on the chart (e.g., bottom_center, top_left)
Show ATR Line on Chart Whether to display the ATR line directly on the chart
✅ Signal Logic Summary
The script determines the final signal based on:
ATR being above or below its average
ATR rising or falling
ATR percentage being significant (>2%)
VIX being high or low
Conditions Signal
ATR rising + high volatility + low VIX LONG
ATR falling + high volatility + high VIX SHORT
ATR flat or low volatility or low %ATR FLAT

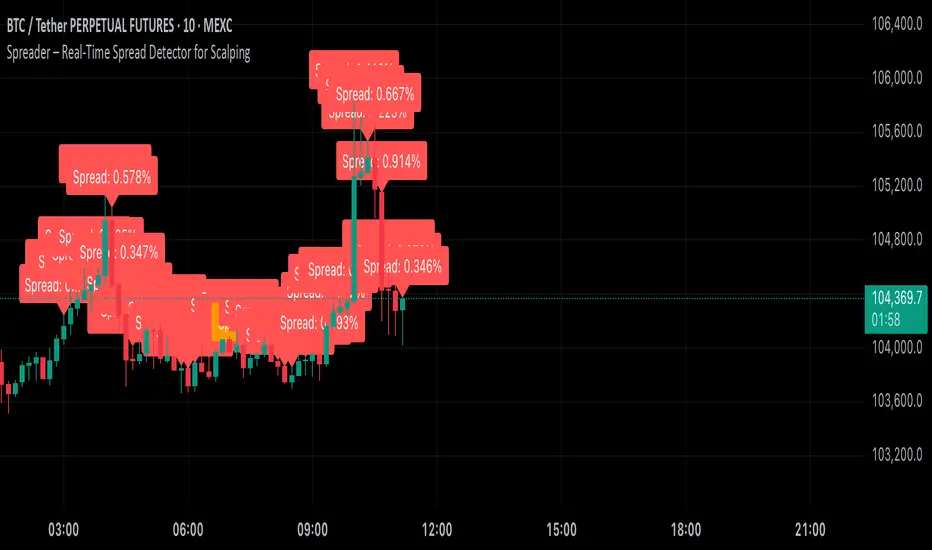
Spreader – Real-Time Spread Detector for ScalpingSpreader is a professional tool built for scalpers and intraday traders, designed to visually display live bid-ask spread on your chart. By showing you the true market friction in real time, it helps you avoid poor entries and reduce immediate trade losses.
Apex Edge - MTF Confluence PanelApex Edge – MTF Confluence Panel
Description:
The Apex Edge – MTF Confluence Panel is a powerful multi-timeframe analysis tool built to streamline trade decision-making by aggregating key confluences across three user-defined timeframes. The panel visually presents the state of five core market signals—Trend, Momentum, Sweep, Structure, and Trap—alongside a unified Score column that summarizes directional bias with clarity.
Traders can customize the number of bullish/bearish conditions required to trigger a score signal, allowing the tool to be tailored for both conservative and aggressive trading styles. This script is designed for those who value a clean, structured, and objective approach to identifying market alignment—whether scalping or swing trading.
How it Works:
Across each of the three selected timeframes, the panel evaluates:
Trend: Based on a user-configurable Hull Moving Average (HMA), the script compares price relative to trend to determine bullish, bearish, or neutral bias.
Momentum: Uses OBV (On-Balance Volume) with volume spike detection to identify bursts of strong buying or selling pressure.
Sweep: Detects potential liquidity grabs by identifying price rejections beyond prior swing highs/lows. A break below a previous low with reversal signals bullish intent (and vice versa for bearish).
Structure: Uses dynamic pivot-based logic to identify market structure breaks (BOS) beyond recent confirmed swing levels.
Trap: Flags potential false moves by measuring RSI overbought/oversold signal clusters combined with minimal price movement—highlighting exhaustion or deceptive breaks.
Score: A weighted consensus of the above components. The number of required confluences to trigger a score (default: 3) can be set by the user via input, offering flexibility in signal sensitivity.
Why It’s Useful for Traders:
Quick Decision-Making: The color-coded panel provides instant visual feedback on whether confluences align across timeframes—ideal for fast-paced environments like scalping or high-volatility news sessions.
Multi-Timeframe Confidence: Helps eliminate guesswork by confirming whether higher and lower timeframe conditions support your trade idea.
Customizability: Adjustable confluence threshold means traders can fine-tune how sensitive the system is—more signals for faster entries, stricter confluence for higher conviction trades.
Built-In Alerts: Automated alerts for score alignment, trap detection, and liquidity sweeps allow traders to stay informed even when away from the screen.
Strategic Edge: Supports directional bias confirmation and trade filtering with logic designed to mimic professional decision-making workflows.
Features:
Clean, real-time confluence table across three user-selected timeframes
Configurable score sensitivity via “Minimum Confluences for Score” input
Cell-based colour coding for at-a-glance trade direction
Built-in alerts for score alignment, traps, and sweep triggers
Note - This Indicator works great in sync with Apex Edge - Session Sweep Pro
Useful levels for TP = previous session high/low boxes or fib levels.
⚠️ Disclaimer:
This script is for informational and educational purposes only and should not be considered financial advice. Always perform your own due diligence and practice proper risk management when trading.

Intraday Pivot Highs & Lows (Asia London NY)Intraday Pivot Highs & Lows (Asia London NY)
Script Description
This TradingView indicator is optimized for Forex, scalping, intraday, and day trading strategies. It accurately plots Pivot Points and levels, high/low, support and resistance levels. These are clearly identified to aid the trader during killzone sessions and session opens. Ideal for scalp trading, intraday sessions, and leveraging SMT (Smart Money Techniques). Utilize these Price Levels effectively during London Open, NY Open, and the Asia Session, utilizing Market Structure to pinpoint key levels and reversal zones for successful trading. Improve your Trade Setups, recognize reliable Chart Patterns, identify critical Price Pivots, and trade confidently off Institutional Levels.
This script marks the intraday pivot highs, lows and midpoints retracement levels for
Asia
London
New York
It also plots the previous day's high, low, midpoint, and 0.618 Fibonacci retracement levels, providing traders with critical price reference points for making intraday trading decisions.
Originality & Usefulness
This indicator uniquely integrates pivot calculations across three major Forex sessions (Asia, London, NY), clearly delineating session boundaries.
It enhances visibility by using distinct styling
solid for New York
dashed for London
dotted lines for Asia
And colour co-ordinated labeling, improving traders' ability to identify important intraday price action zones efficiently. Unlike standard pivot indicators, this script emphasizes session-specific trading dynamics.
### Key Features ###
Session-Based Levels: Automatically plots high, low, midpoint, and Fibonacci (.618) levels for each major session (Asia, London, NY).
Distinct Visual Cues: Lines and labels use session-specific styles and colors to easily differentiate between sessions.
Previous Day Reference: Clearly plots and labels yesterday's high, low, midpoint, and Fibonacci levels.
Flexible Visibility: Traders can set timeframe visibility to maintain clean charts on higher timeframes.
### How It Works
At the start of next day's session, previous session lines are cleared, ensuring the chart remains uncluttered.
High, low, midpoint, and Fibonacci retracement levels (.618) are dynamically calculated and displayed at the close of each session.
All session levels remain visible until the start of the next respective session, providing continuous actionable insights.
Trading Application:
Session highs and lows act as strong intraday support and resistance zones.
Midpoints and Fibonacci levels are effective for identifying potential reversal zones and retracements.
Daily levels provide a broader context, useful for gauging intraday volatility and range.
### Limitations and Considerations ##
Best used on liquid assets with clear session-based price action, such as Forex major pairs, if used on indexes make sure they contain 24 hour price action not just New York session.
This indicator is designed to streamline intraday trading by clearly marking essential pivot points and session-based levels, significantly improving traders' market context and decision-making accuracy. Can be used to enhance SMT decision making when scalping killzones.

ChopFlow ATR Scalp StrategyA lean, high-velocity scalp framework for NQ and other futures that blends trend clarity, volume confirmation, and adaptive exits to give you precise, actionable signals—no cluttered bands or lagging indicators.
⸻
🔍 Overview
This strategy locks onto rapid intraday moves by:
• Filtering for directional momentum with the Choppiness Index (CI)
• Confirming conviction via On-Balance Volume (OBV) against its moving average
• Automatically sizing stops and targets with a multiple of the Average True Range (ATR)
It’s designed for scalp traders who need clean, timely entries without wading through choppy noise.
⸻
⚙️ Key Features & Inputs
1. ATR Length & Multiplier
• Controls exit distances based on current volatility.
2. Choppiness Length & Threshold
• Measures trend strength; only fires when the market isn’t “stuck in the mud.”
3. OBV SMA Length
• Smoothes volume flow to confirm genuine buying or selling pressure.
4. Custom Session Hours
• Avoid overnight gaps or low-liquidity periods.
All inputs are exposed for rapid tuning to your preferred scalp cadence.
🚀 How It Works
1. Long Entry triggers when:
• CI < threshold (strong trend)
• OBV > its SMA (positive volume flow)
• You’re within the defined session
2. Short Entry mirrors the above (CI < threshold, OBV < SMA)
3. Exit uses ATR × multiplier for both stop-loss and take-profit
⸻
🎯 Usage Tips
• Start with defaults (ATR 14, multiplier 1.5; CI 14, threshold 60; OBV SMA 10).
• Monitor signal frequency, then tighten/loosen CI or OBV look-back as needed.
• Pair with a fast MA crossover or price-action trigger if you want even sharper timing.
• Backtest across different sessions (early open vs. power hours) to find your edge.
⸻
⚠️ Disclaimer
This script is provided “as-is” for educational and research purposes. Always paper-trade any new setup extensively before deploying live capital, and adjust risk parameters to your personal tolerance.
⸻
Elevate your scalp game with ChopFlow ATR—where trend, volume, and volatility converge for clear, confident entries. Happy scalping!

Williams R Zone Scalper v1.0[BullByte]Originality & Usefulness
Unlike standard Williams R cross-over scripts, this strategy layers five dynamic filters—moving-average trend, Supertrend, Choppiness Index, Bollinger Band Width, and volume validation —and presents a real-time dashboard with equity, PnL, filter status, and key indicator values. No other public Pine script combines these elements with toggleable filters and a custom dashboard. In backtests (BTC/USD (Binance), 5 min, 24 Mar 2025 → 28 Apr 2025), adding these filters turned a –2.09 % standalone Williams R into a +5.05 % net winner while cutting maximum drawdown in half.
---
What This Script Does
- Monitors Williams R (length 14) for overbought/oversold reversals.
- Applies up to five dynamic filters to confirm trend strength and volatility direction:
- Moving average (SMA/EMA/WMA/HMA)
- Supertrend line
- Choppiness Index (CI)
- Bollinger Band Width (BBW)
- Volume vs. its 50-period MA
- Plots blue arrows for Long entries (R crosses above –80 + all filters green) and red arrows for Short entries (R crosses below –20 + all filters green).
- Optionally sets dynamic ATR-based stop-loss (1.5×ATR) and take-profit (2×ATR).
- Shows a dashboard box with current position, equity, PnL, filter status, and real-time Williams R / MA/volume values.
---
Backtest Summary (BTC/USD(Binance), 5 min, 24 Mar 2025 → 28 Apr 2025)
• Total P&L : +50.70 USD (+5.05 %)
• Max Drawdown : 31.93 USD (3.11 %)
• Total Trades : 198
• Win Rate : 55.05 % (109/89)
• Profit Factor : 1.288
• Commission : 0.01 % per trade
• Slippage : 0 ticks
Even in choppy March–April, this multi-filter approach nets +5 % with a robust risk profile, compared to –2.09 % and higher drawdown for Williams R alone.
---
Williams R Alone vs. Multi-Filter Version
• Total P&L :
– Williams R alone → –20.83 USD (–2.09 %)
– Multi-Filter → +50.70 USD (+5.05 %)
• Max Drawdown :
– Williams R alone → 62.13 USD (6.00 %)
– Multi-Filter → 31.93 USD (3.11 %)
• Total Trades : 543 vs. 198
• Win Rate : 60.22 % vs. 55.05 %
• Profit Factor : 0.943 vs. 1.288
---
Inputs & What They Control
- wrLen (14): Williams R look-back
- maType (EMA): Trend filter type (SMA, EMA, WMA, HMA)
- maLen (20): Moving-average period
- useChop (true): Toggle Choppiness Index filter
- ciLen (12): CI look-back length
- chopThr (38.2): CI threshold (below = trending)
- useVol (true): Toggle volume-above-average filter
- volMaLen (50): Volume MA period
- useBBW (false): Toggle Bollinger Band Width filter
- bbwMaLen (50): BBW MA period
- useST (false): Toggle Supertrend filter
- stAtrLen (10): Supertrend ATR length
- stFactor (3.0): Supertrend multiplier
- useSL (false): Toggle ATR-based SL/TP
- atrLen (14): ATR period for SL/TP
- slMult (1.5): SL = slMult × ATR
- tpMult (2.0): TP = tpMult × ATR
---
How to Read the Chart
- Blue arrow (Long): Williams R crosses above –80 + all enabled filters green
- Red arrow (Short) : Williams R crosses below –20 + all filters green
- Dashboard box:
- Top : position and equity
- Next : cumulative PnL in USD & %
- Middle : green/white dots for each filter (green=passing, white=disabled)
- Bottom : Williams R, MA, and volume current values
---
Usage Tips
- Add the script : Indicators → My Scripts → Williams R Zone Scalper v1.0 → Add to BTC/USD chart on 5 min.
- Defaults : Optimized for BTC/USD.
- Forex majors : Raise `chopThr` to ~42.
- Stocks/high-beta : Enable `useBBW`.
- Enable SL/TP : Toggle `useSL`; stop-loss = 1.5×ATR, take-profit = 2×ATR apply automatically.
---
Common Questions
- * Why not trade every Williams R reversal?*
Raw Williams R whipsaws in sideways markets. Choppiness and volume filters reduce false entries.
- *Can I use on 1 min or 15 min?*
Yes—adjust ATR length or thresholds accordingly. Defaults target 5 min scalping.
- *What if all filters are on?*
Fewer arrows, higher-quality signals. Expect ~10 % boost in average win size.
---
Disclaimer & License
Trading carries risk of loss. Use this script “as is” under the Mozilla Public License 2.0 (mozilla.org). Always backtest, paper-trade, and adjust risk settings to your own profile.
---
Credits & References
- Pine Script v6, using TradingView’s built-in `ta.supertrend()`.
- TradingView House Rules: www.tradingview.com
Goodluck!
BullByte

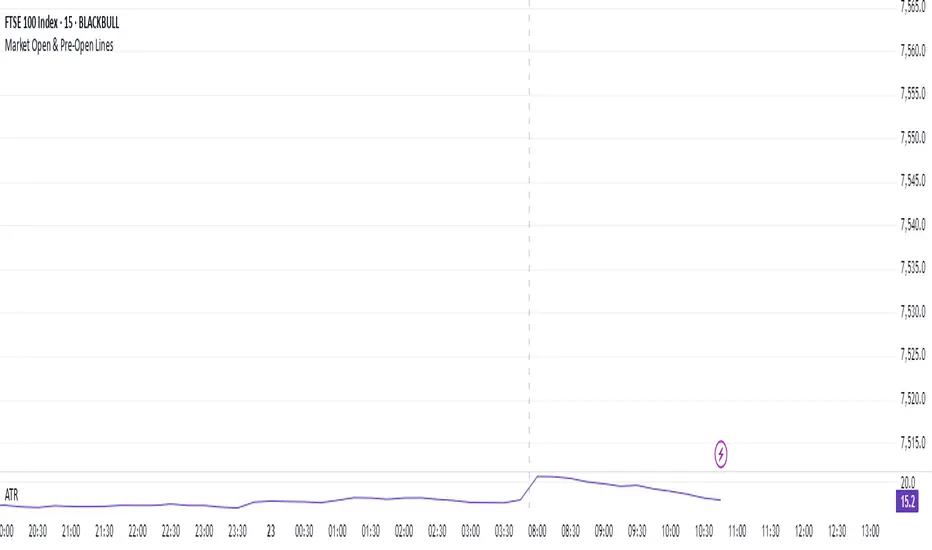
Market Open & Pre-Open Linesversion 1.0 2025-04-23
Stated vertical line for market open and pre-market open. Market option include US, EU, UK, JP and AU. This line do auto-defined during daylight saving time. This help for those trade during market open and benefit for those doing backtest on it.
Reversal Strength Meter – Adib NooraniThe Reversal Strength Meter is an oscillator designed to identify potential reversal zones based on supply and demand dynamics. It uses smoothed stochastic logic to reduce noise and highlight areas where momentum may be weakening, signaling possible market turning points.
🔹 Smooth, noise-reduced stochastic oscillator
🔹 Custom zones to highlight potential supply and demand imbalances
🔹 Non-repainting, compatible across all timeframes and assets
🔹 Visual-only tool — intended to support discretionary trading decisions
This oscillator assists scalpers and intraday traders in tracking subtle shifts in momentum, helping them identify when a market may be preparing to reverse — always keeping in mind that trading is based on probabilities, not certainties.
📘 How to Use the Indicator Efficiently
For Reversal Trading:
Buy Setup
– When the blue line dips below the 20 level, wait for it to re-enter above 20.
– Look for reversal candlestick patterns (e.g., bullish engulfing, hammer, or morning star).
– Enter above the pattern’s high, with a stop loss below its low.
Sell Setup
– When the blue line rises above the 80 level, wait for it to re-enter below 80.
– Look for bearish candlestick patterns (e.g., bearish engulfing, inverted hammer, or evening star).
– Enter below the pattern’s low, with a stop loss above its high.
🛡 Risk Management Guidelines
Risk only 0.5% of your capital per trade
Book 50% profits at a 1:1 risk-reward ratio
Trail the remaining 50% using price action or other supporting indicators

Reversal Scalping Ribbon - Adib NooraniThe Reversal Scalping Ribbon is a trend-following overlay tool designed to visually identify potential reversal zones based on price extremes and dynamic volatility bands. It calculates adaptive upper and lower bands using price action and custom ATR logic, helping traders quickly assess market direction and possible turning points
🔹 Volatility-adjusted bands based on price highs/lows
🔹 Color-coded ribbons to indicate trend bias and potential reversal shifts
🔹 No repainting, works on all timeframes and assets
🔹 Visual-only display, no trade signals — supports discretion-based entries
This ribbon is designed for scalpers and intraday traders to spot reversal setups with clarity. It enhances your trading by showing real-time market bias without unnecessary distractions. By focusing on probabilities, it helps to improve decision-making in fast-paced environments
How to use the indicator efficiently
For Reversal Trading:
Buy: When price closes below the green ribbon with a red candle, then re-enters with a green candle. Enter above the high of the green candle with a stop loss below the lowest low of the recent green/red candles
Sell: When price closes above the red ribbon with a green candle, then re-enters with a red candle. Enter below the low of the red candle with a stop loss above the highest high of the recent red/green candles
Risk Management:
Limit risk to 0.5% of your capital per trade
Take 50% profit at a 1:1 risk-reward ratio
For the remaining 50%, trail using the lower edge of the green band for buys and the upper edge of the red band for sells

ScalpSwing Pro SetupScript Overview
This script is a multi-tool setup designed for both scalping (1m–5m) and swing trading (1H–4H–Daily). It combines the power of trend-following , momentum , and mean-reversion tools:
What’s Included in the Script
1. EMA Indicators (20, 50, 200)
- EMA 20 (blue) : Short-term trend
- EMA 50 (orange) : Medium-term trend
- EMA 200 (red) : Long-term trend
- Use:
- EMA 20 crossing above 50 → bullish trend
- EMA 20 crossing below 50 → bearish trend
- Price above 200 EMA = uptrend bias
2. VWAP (Volume Weighted Average Price)
- Shows the average price weighted by volume
- Best used in intraday (1m to 15m timeframes)
- Use:
- Price bouncing from VWAP = reversion trade
- Price far from VWAP = likely pullback incoming
3. RSI (14) + Key Levels
- Shows momentum and overbought/oversold zones
- Levels:
- 70 = Overbought (potential sell)
- 30 = Oversold (potential buy)
- 50 = Trend confirmation
- Use:
- RSI 30–50 in uptrend = dip buying zone
- RSI 70–50 in downtrend = pullback selling zone
4. MACD Crossovers
- Standard MACD with histogram & cross alerts
- Shows trend momentum shifts
- Green triangle = Bullish MACD crossover
- Red triangle = Bearish MACD crossover
- Use:
- Confirm swing trades with MACD crossover
- Combine with RSI divergence
5. Buy & Sell Signal Logic
BUY SIGNAL triggers when:
- EMA 20 crosses above EMA 50
- RSI is between 50 and 70 (momentum bullish, not overbought)
SELL SIGNAL triggers when:
- EMA 20 crosses below EMA 50
- RSI is between 30 and 50 (bearish momentum, not oversold)
These signals appear as:
- BUY : Green label below the candle
- SELL : Red label above the candle
How to Trade with It
For Scalping (1m–5m) :
- Focus on EMA crosses near VWAP
- Confirm with RSI between 50–70 (buy) or 50–30 (sell)
- Use MACD triangle as added confluence
For Swing (1H–4H–Daily) :
- Look for EMA 20–50 cross + price above EMA 200
- Confirm trend with MACD and RSI
- Trade breakout or pullback depending on structure

Triple Confirmation Scalper v2 - Alarm CompatibleTriple Confirmation Scalper Strategy
A high-probability scalping strategy combining trend momentum, overbought/sold conditions, and volume confirmation to filter low-noise signals.
📊 Strategy Logic
Trend Direction
Dual EMA crossover (9 & 21 periods) for momentum and trend bias.
Overbought/Oversold Zones
RSI (14-period) to avoid entries at extremes.
Volume Spike Filter
OBV + 20-period volume average to confirm breakout validity.
Dynamic Risk Management
Stop-loss: Adaptive to recent price action (5-candle low/high ±1%).
Take-profit: 1.5% target (1.5:1 risk/reward).
🔍 Advanced Features
Precision VWAP (20-period, HLC3-based) for dynamic S/R levels.
Visual Aids:
EMA/VWAP bands + trend-colored background.
Volume spike alerts.
TradingView Alerts pre-configured for long/short signals.
⚙️ Default Settings
Commission: 0.1% factored into backtests.
Mode: Supports both long/short positions.
⚠️ Disclaimer
This is a technical analysis tool, not financial advice.
Past performance ≠ future results. Test thoroughly in a demo account.
Adjust parameters (e.g., EMA periods, RSI thresholds) to match your risk tolerance.
✅ TradingView Compliance Notes:
No exaggerated claims (e.g., "100% win rate").
Clear disclaimer included.
Focus on objective strategy logic (no promotional language).

Institutional Quantum Momentum Impulse [BullByte]## Overview
The Institutional Quantum Momentum Impulse (IQMI) is a sophisticated momentum oscillator designed to detect institutional-level trend strength, volatility conditions, and market regime shifts. It combines multiple advanced technical concepts, including:
- Quantum Momentum Engine (Hilbert Transform + MACD Divergence + Stochastic Energy)
- Fractal Volatility Scoring (GARCH + Keltner-based volatility)
- Dynamic Adaptive Bands (Self-adjusting thresholds based on efficiency)
- Market Phase Detection (Volume + Momentum alignment)
- Liquidity & Cumulative Delta Analysis
The indicator provides a Z-score normalized momentum reading, making it ideal for mean-reversion and trend-following strategies.
---
## Key Features
### 1. Quantum Momentum Core
- Combines Hilbert Transform, MACD divergence, and Stochastic Energy into a single composite momentum score.
- Normalized using a Z-score for statistical significance.
- Smoothed with EMA/WMA/HMA for cleaner signals.
### 2. Dynamic Adaptive Bands
- Upper/Lower bands adjust based on volatility and efficiency ratio .
- Acts as overbought/oversold zones when momentum reaches extremes.
### 3. Market Phase Detection
- Identifies bullish , bearish , or neutral phases using:
- Volume-Weighted MA alignment
- Fractal momentum extremes
### 4. Volatility & Liquidity Filters
- Fractal Volatility Score (0-100 scale) shows market instability.
- Liquidity Check ensures trades are taken in favorable spread conditions.
### 5. Dashboard & Visuals
- Real-time dashboard with key metrics:
- Momentum strength, volatility, efficiency, cumulative delta, and market regime.
- Gradient coloring for intuitive momentum visualization .
---
## Best Trade Setups
### 1. Trend-Following Entries
- Signal :
- QM crosses above zero + Market Phase = Bullish + ADX > 25
- Cumulative Delta rising (buying pressure)
- Confirmation :
- Efficiency > 0.5 (strong momentum quality)
- Liquidity = High (tight spreads)
### 2. Mean-Reversion Entries
- Signal :
- QM touches upper band + Volatility expanding
- Market Regime = Ranging (ADX < 25)
- Confirmation :
- Efficiency < 0.3 (weak momentum follow-through)
- Cumulative Delta divergence (price high but delta declining)
### 3. Breakout Confirmation
- Signal :
- QM holds above zero after a pullback
- Market Phase shifts to Bullish/Bearish
- Confirmation :
- Volatility rising (expansion phase)
- Liquidity remains high
---
## Recommended Timeframes
- Intraday (5M - 1H): Works well for scalping & swing trades.
- Swing Trading (4H - Daily): Best for trend-following setups.
- Position Trading (Weekly+): Useful for macro trend confirmation.
---
## Input Customization
- Resonance Factor (1.0 - 3.618 ): Adjusts MACD divergence sensitivity.
- Entropy Filter (0.382/0.50/0.618) : Controls stochastic damping.
- Smoothing Type (EMA/WMA/HMA) : Changes momentum responsiveness.
- Normalization Period : Adjusts Z-score lookback.
---
The IQMI is a professional-grade momentum indicator that combines institutional-level concepts into a single, easy-to-read oscillator. It works across all markets (stocks, forex, crypto) and is ideal for traders who want:
✅ Early trend detection
✅ Volatility-adjusted signals
✅ Institutional liquidity insights
✅ Clear dashboard for quick analysis
Try it on TradingView and enhance your trading edge! 🚀
Happy Trading!
- BullByte

Reversal Trading Bot Strategy[BullByte]Overview :
The indicator Reversal Trading Bot Strategy is crafted to capture potential market reversal points by combining momentum, volatility, and trend alignment filters. It uses a blend of technical indicators to identify both bullish and bearish reversal setups, ensuring that multiple market conditions are met before entering a trade.
Core Components :
Technical Indicators Used :
RSI (Relative Strength Index) :
Purpose : Detects divergence conditions by comparing recent lows/highs in price with the RSI.
Parameter : Length of 8.
Bollinger Bands (BB) :
Purpose : Measures volatility and identifies price levels that are statistically extreme.
Parameter : Length of 20 and a 2-standard deviation multiplier.
ADX (Average Directional Index) & DMI (Directional Movement Index) :
Purpose : Quantifies the strength of the trend. The ADX threshold is set at 20, and additional filters check for the alignment of the directional indicators (DI+ and DI–).
ATR (Average True Range) :
Purpose : Provides a volatility measure used to set stop levels and determine risk through trailing stops.
Volume SMA (Simple Moving Average of Volume ):
Purpose : Helps confirm strength by comparing the current volume against a 20-period average, with an optional filter to ensure volume is at least twice the SMA.
User-Defined Toggle Filters :
Volume Filter : Confirms that the volume is above average (or twice the SMA) before taking trades.
ADX Trend Alignment Filter : Checks that the ADX’s directional indicators support the trade direction.
BB Close Confirmation : Optionally refines the entry by requiring price to be beyond the upper or lower Bollinger Band rather than just above or below.
RSI Divergence Exit : Allows the script to close positions if RSI divergence is detected.
BB Mean Reversion Exit : Closes positions if the price reverts to the Bollinger Bands’ middle line.
Risk/Reward Filter : Ensures that the potential reward is at least twice the risk by comparing the distance to the Bollinger Band with the ATR.
Candle Movement Filter : Optional filter to require a minimum percentage move in the candle to confirm momentum.
ADX Trend Exit : Closes positions if the ADX falls below the threshold and the directional indicators reverse.
Entry Conditions :
Bullish Entry :
RSI Divergence : Checks if the current close is lower than a previous low while the RSI is above the previous low, suggesting bullish divergence.
Bollinger Confirmation : Requires that the price is above the lower (or upper if confirmation is toggled) Bollinger Band.
Volume & Trend Filters : Combines volume condition, ADX strength, and an optional candle momentum condition.
Risk/Reward Check : Validates that the trade meets a favorable risk-to-reward ratio.
Bearish Entry :
Uses a mirror logic of the bullish entry by checking for bearish divergence, ensuring the price is below the appropriate Bollinger level, and confirming volume, trend strength, candle pattern, and risk/reward criteria.
Trade Execution and Exit Strateg y:
Trade Execution :
Upon meeting the entry conditions, the strategy initiates a long or short position.
Stop Loss & Trailing Stops :
A stop-loss is dynamically set using the ATR value, and trailing stops are implemented as a percentage of the close price.
Exit Conditions :
Additional exit filters can trigger early closures based on RSI divergence, mean reversion (via the middle Bollinger Band), or a weakening trend as signaled by ADX falling below its threshold.
This multi-layered exit strategy is designed to lock in gains or minimize losses if the market begins to reverse unexpectedly.
How the Strategy Works in Different Market Conditions :
Trending Markets :
The ADX filter ensures that trades are only taken when the trend is strong. When the market is trending, the directional movement indicators help confirm the momentum, making the reversal signal more reliable.
Ranging Markets :
In choppy markets, the Bollinger Bands expand and contract, while the RSI divergence can highlight potential turning points. The optional filters can be adjusted to avoid false signals in low-volume or low-volatility conditions.
Volatility Management :
With ATR-based stop-losses and a risk/reward filter, the strategy adapts to current market volatility, ensuring that risk is managed consistently.
Recommendation on using this Strategy with a Trading Bot :
This strategy is well-suited for high-frequency trading (HFT) due to its ability to quickly identify reversal setups and execute trades dynamically with automated stop-loss and trailing exits. By integrating this script with a TradingView webhook-based bot or an API-driven execution system, traders can automate trade entries and exits in real-time, reducing manual execution delays and capitalizing on fast market movements.
Disclaimer :
This script is provided for educational and informational purposes only. It is not intended as investment advice. Trading involves significant risk, and you should always conduct your own research and analysis before making any trading decisions. The author is not responsible for any losses incurred while using this script.

Smart Grid Scalping (Pullback) Strategy[BullByte]The Smart Grid Scalping (Pullback) Strategy is a high-frequency trading strategy designed for short-term traders who seek to capitalize on market pullbacks. This strategy utilizes a dynamic ATR-based grid system to define optimal entry points, ensuring precise trade execution. It integrates volatility filtering and an RSI-based confirmation mechanism to enhance signal accuracy and reduce false entries.
This strategy is specifically optimized for scalping by dynamically adjusting trade levels based on current market conditions. The grid-based system helps capture retracement opportunities while maintaining strict trade management through predefined profit targets and trailing stop-loss mechanisms.
Key Features :
1. ATR-Based Grid System :
- Uses a 10-period ATR to dynamically calculate grid levels for entry points.
- Prevents chasing trades by ensuring price has reached key levels before executing entries.
2. No Trade Zone Protection :
- Avoids low-volatility zones where price action is indecisive.
- Ensures only high-momentum trades are executed to improve success rate.
3. RSI-Based Entry Confirmation :
- Long trades are triggered when RSI is below 30 (oversold) and price is in the lower grid zone.
- Short trades are triggered when RSI is above 70 (overbought) and price is in the upper grid zone.
4. Automated Trade Execution :
- Long Entry: Triggered when price drops below the first grid level with sufficient volatility.
- Short Entry: Triggered when price exceeds the highest grid level with sufficient volatility.
5. Take Profit & Trailing Stop :
- Profit target set at a customizable percentage (default 0.2%).
- Adaptive trailing stop mechanism using ATR to lock in profits while minimizing premature exits.
6. Visual Trade Annotations :
- Clearly labeled "LONG" and "SHORT" markers appear at trade entries for better visualization.
- Grid levels are plotted dynamically to aid decision-making.
Strategy Logic :
- The script first calculates the ATR-based grid levels and ensures price action has sufficient volatility before allowing trades.
- An additional RSI filter is used to ensure trades are taken at ideal market conditions.
- Once a trade is executed, the script implements a trailing stop and predefined take profit to maximize gains while reducing risks.
---
Disclaimer :
Risk Warning :
This strategy is provided for educational and informational purposes only. Trading involves significant risk, and past performance is not indicative of future results. Users are advised to conduct their own due diligence and risk management before using this strategy in live trading.
The developer and publisher of this script are not responsible for any financial losses incurred by the use of this strategy. Market conditions, slippage, and execution quality can affect real-world trading outcomes.
Use this script at your own discretion and always trade responsibly.

MACD Volume Strategy (BBO + MACD State, Reversal Type)Overview
MACD Volume Strategy (BBO + MACD State, Reversal Type) is a momentum-based reversal system that combines MACD crossover logic with volume filtering to enhance signal accuracy and minimize noise. It aims to identify structural trend shifts and manage risk using predefined parameters.
※This strategy is for educational and research purposes only. All results are based on historical simulations and do not guarantee future performance.
Strategy Objectives
Identify early trend transitions with high probability
Filter entries using volume dynamics to validate momentum
Maintain continuous exposure using a reversal-style model
Apply a consistent 1:1.5 risk-to-reward ratio per trade
Key Features
Integrated MACD and volume oscillator filtering
Zero repainting (all signals confirmed on closed candles)
Automatic position flipping for seamless direction shifts
Stop-loss and take-profit based on recent structural highs/lows
Trading Rules
Long Entry Conditions
MACD crosses above the zero line (BBO Buy arrow)
Volume oscillator is positive (short EMA > long EMA)
MACD is above the signal line
Close any existing short and enter a new long
Short Entry Conditions
MACD crosses below the zero line (BBO Sell arrow)
Volume oscillator is positive
MACD is below the signal line
Close any existing long and enter a new short
Exit Rules
Take Profit (TP) = Entry ± (risk distance × 1.5)
Stop Loss (SL) = Recent swing low (for long) or high (for short)
Early Exit = Triggered when a reversal signal appears (flip logic)
Risk Management Parameters
Pair: ETH/USD
Timeframe: 10-minute
Starting Capital: $3,000
Commission: 0.02%
Slippage: 2 pip
Risk per Trade: 5% of account equity (adjusted for sustainable practice)
Total Trades: 312 (backtest on selected dataset)
※Risk parameters are fully configurable and should be adjusted to suit each trader's personal setup and broker conditions.
Parameters & Configurations
Volume Short Length: 6
Volume Long Length: 12
MACD Fast Length: 11
MACD Slow Length: 21
Signal Smoothing: 10
Oscillator MA Type: SMA
Signal Line MA Type: SMA
Visual Support
Green arrow = Long entry
Red arrow = Short entry
MACD lines, signal line, and histogram
SL/TP markers plotted directly on the chart
Strategic Advantages & Uniqueness
Volume filtering eliminates low-participation, weak signals
Structurally aligned SL/TP based on recent market pivots
No repainting — decisions are made only on closed candles
Always in the market due to the reversal-style framework
Inspirations & Attribution
This strategy is inspired by the excellent work of:
Bitcoinblockchainonline – “BBO_Roxana_Signals MACD + vol”
Leveraging MACD zero-line cross and volume oscillator for intuitive signal generation.
HasanRifat – “MACD Fake Filter ”
Introduced a signal filter using MACD wave height averaging to reduce false positives.
This strategy builds upon those ideas to create a more automated, risk-aware, and technically adaptive system.
Summary
MACD Volume Strategy is a clean, logic-first automated trading system built for precision-seeking traders. It avoids discretionary bias and provides consistent signal logic under backtested historical conditions.
100% mechanical — no discretionary input required
Designed for high-confidence entries
Can be extended with filters, alerts, or trailing stops
※Strategy performance depends on market context. Past performance is not indicative of future results. Use with proper risk management and careful configuration.

Pro Scalper AI [BullByte]The Pro Scalper AI is a powerful, multi-faceted scalping indicator designed to assist active traders in identifying short-term trading opportunities with precision. By combining trend analysis, momentum indicators, dynamic weighting, and optional AI forecasting, this tool provides both immediate and latched trading signals based on confirmed (closed bar) data—helping to avoid repainting issues. Its flexible design includes customizable filters such as a higher timeframe trend filter, and adjustable settings for ADX, ATR, and Hull Moving Average (HMA), giving traders the ability to fine-tune the strategy to different markets and timeframes.
Key Features :
- Confirmed Data Processing :
Utilizes a helper function to lock in price and volume data only from confirmed (closed) bars, ensuring the reliability of signals without the risk of intrabar repainting.
- Trend Analysis :
Employs ADX and Directional Movement (DI) calculations along with a locally computed HMA to detect short-term trends. An optional higher timeframe trend filter can further refine the analysis.
- Flexible Momentum Modes :
Choose between three momentum calculation methods—Stochastic RSI, Fisher RSI, or Williams %R—to match your preferred style of analysis. This versatility allows you to optimize the indicator for different market conditions.
- Dynamic Weighting & Volatility Adjustments :
Adjusts the contribution of trend, momentum, volatility, and volume through dynamic weighting. This ensures that the indicator responds appropriately to varying market conditions by scaling its sensitivity with user-defined maximum factors.
- Optional AI Forecast :
For those who want an extra edge, the built-in AI forecasting module uses linear regression to predict future price moves and adjusts oscillator thresholds accordingly. This feature can be toggled on or off, with smoothing options available for more stable output.
- Latching Mode for Signal Persistenc e:
The script features a latching mechanism that holds signals until a clear reversal is detected, preventing whipsaws and providing more reliable trade entries and exits.
- Comprehensive Visualizations & Dashboard :
- Composite Oscillator & Dynamic Thresholds : The oscillator is plotted with dynamic upper and lower thresholds, and the area between them is filled with a color that reflects the active trading signal (e.g., Strong Buy, Early Sell).
- Signal Markers : Both immediate (non-latching) and stored (latched) signals are marked on the chart with distinct shapes (circles, crosses, triangles, and diamonds) to differentiate between signal types.
- Real-Time Dashboard : A customizable dashboard table displays key metrics including ADX, oscillator value, chosen momentum mode, HMA trend, higher timeframe trend, volume factor, AI bias (if enabled), and more, allowing traders to quickly assess market conditions at a glance.
How to Use :
1. S ignal Interpretation :
- Immediate Signals : For traders who prefer quick entries, the indicator displays immediate signals such as “Strong Buy” or “Early Sell” based on the current market snapshot.
- Latched Signals : When latching is enabled, the indicator holds a signal state until a clear reversal is confirmed, offering sustained trade setups.
2. Trend Confirmation :
- Use the HMA trend indicator and the optional higher timeframe trend filter to confirm the prevailing market direction before acting on signals.
3. Dynamic Thresholds & AI Forecasting :
- Monitor the dynamically adjusted oscillator thresholds and, if enabled, the AI bias to gauge potential shifts in market momentum.
4. Risk Management :
- Combine these signals with additional analysis and sound risk management practices to determine optimal entry and exit points for scalping trades.
Disclaimer :
This script is provided for educational and informational purposes only and does not constitute financial advice. Trading involves risk, and past performance is not indicative of future results. Always perform your own analysis and use proper risk management strategies before trading.

Money Flow Oscillator [BullByte]
Overview :
The Money Flow Oscillator is a versatile technical analysis tool designed to provide traders with insights into market momentum through the Money Flow Index (MFI). By integrating trend logic, dynamic support/resistance levels, multi-timeframe analysis, and additional indicators like ADX and Choppiness, this script delivers a detailed view of market conditions and signal strength—all while adhering to TradingView’s publication guidelines.
Key Features :
Money Flow Analysis :
Uses the MFI to assess buying and selling pressure, helping traders gauge market momentum.
Trend Switch Logic :
Employs ATR-based calculations to determine trend direction. The background color adjusts dynamically to signal bullish or bearish conditions, and a prominent center line changes color to reflect the prevailing trend.
Dynamic Support/Resistance :
Calculates oscillator support and resistance over a pivot lookback period. These levels help you identify potential breakouts or reversals as the MFI moves above or below prior levels.
Signal Metrics & Classifications :
Combines MFI values with additional metrics to classify signals into categories such as “Strong Bullish,” “Bullish,” “Bearish,” or “Strong Bearish.” An accompanying note provides details on momentum entry and overall signal strength.
Multi-Timeframe Order Flow Confirmatio n:
Analyzes the MFI on a higher timeframe to confirm order flow. This extra layer of analysis helps verify the short-term signals generated on your primary chart.
Volume and ADX Integration :
Incorporates volume analysis and a manual ADX calculation to further validate signal strength and trend stability. A dashboard displays these metrics for quick reference.
Choppiness Indicator :
Includes a choppiness index to determine if the market is trending or choppy. When the market is identified as choppy, the script advises caution by adjusting the overall signal note.
Comprehensive Dashboard :
A built-in dashboard presents key metrics—including ADX, MFI, order flow, volume score, and support/resistance details—allowing you to quickly assess market conditions at a glance.
How to Use :
Trend Identification : Monitor the dynamic background and center line colors to recognize bullish or bearish market conditions.
Signal Confirmation : Use the oscillator support/resistance levels along with the signal classifications and dashboard data to make informed entry or exit decisions.
Multi-Timeframe Analysis : Validate short-term signals with the higher timeframe MFI order flow confirmation.
Risk Management : Always combine these insights with your own risk management strategy and further analysis.
Disclaimer :
This indicator is provided for educational and informational purposes only. It does not constitute financial advice. Always perform your own analysis and use proper risk management before making any trading decisions. Past performance is not indicative of future results.

Fuzzy SMA Trend Analyzer (experimental)[FibonacciFlux]Fuzzy SMA Trend Analyzer (Normalized): Advanced Market Trend Detection Using Fuzzy Logic Theory
Elevate your technical analysis with institutional-grade fuzzy logic implementation
Research Genesis & Conceptual Framework
This indicator represents the culmination of extensive research into applying fuzzy logic theory to financial markets. While traditional technical indicators often produce binary outcomes, market conditions exist on a continuous spectrum. The Fuzzy SMA Trend Analyzer addresses this limitation by implementing a sophisticated fuzzy logic system that captures the nuanced, multi-dimensional nature of market trends.
Core Fuzzy Logic Principles
At the heart of this indicator lies fuzzy logic theory - a mathematical framework designed to handle imprecision and uncertainty:
// Improved fuzzy_triangle function with guard clauses for NA and invalid parameters.
fuzzy_triangle(val, left, center, right) =>
if na(val) or na(left) or na(center) or na(right) or left > center or center > right // Guard checks
0.0
else if left == center and center == right // Crisp set (single point)
val == center ? 1.0 : 0.0
else if left == center // Left-shoulder shape (ramp down from 1 at center to 0 at right)
val >= right ? 0.0 : val <= center ? 1.0 : (right - val) / (right - center)
else if center == right // Right-shoulder shape (ramp up from 0 at left to 1 at center)
val <= left ? 0.0 : val >= center ? 1.0 : (val - left) / (center - left)
else // Standard triangle
math.max(0.0, math.min((val - left) / (center - left), (right - val) / (right - center)))
This implementation of triangular membership functions enables the indicator to transform crisp numerical values into degrees of membership in linguistic variables like "Large Positive" or "Small Negative," creating a more nuanced representation of market conditions.
Dynamic Percentile Normalization
A critical innovation in this indicator is the implementation of percentile-based normalization for SMA deviation:
// ----- Deviation Scale Estimation using Percentile -----
// Calculate the percentile rank of the *absolute* deviation over the lookback period.
// This gives an estimate of the 'typical maximum' deviation magnitude recently.
diff_abs_percentile = ta.percentile_linear_interpolation(math.abs(raw_diff), normLookback, percRank) + 1e-10
// ----- Normalize the Raw Deviation -----
// Divide the raw deviation by the estimated 'typical max' magnitude.
normalized_diff = raw_diff / diff_abs_percentile
// ----- Clamp the Normalized Deviation -----
normalized_diff_clamped = math.max(-3.0, math.min(3.0, normalized_diff))
This percentile normalization approach creates a self-adapting system that automatically calibrates to different assets and market regimes. Rather than using fixed thresholds, the indicator dynamically adjusts based on recent volatility patterns, significantly enhancing signal quality across diverse market environments.
Multi-Factor Fuzzy Rule System
The indicator implements a comprehensive fuzzy rule system that evaluates multiple technical factors:
SMA Deviation (Normalized): Measures price displacement from the Simple Moving Average
Rate of Change (ROC): Captures price momentum over a specified period
Relative Strength Index (RSI): Assesses overbought/oversold conditions
These factors are processed through a sophisticated fuzzy inference system with linguistic variables:
// ----- 3.1 Fuzzy Sets for Normalized Deviation -----
diffN_LP := fuzzy_triangle(normalized_diff_clamped, 0.7, 1.5, 3.0) // Large Positive (around/above percentile)
diffN_SP := fuzzy_triangle(normalized_diff_clamped, 0.1, 0.5, 0.9) // Small Positive
diffN_NZ := fuzzy_triangle(normalized_diff_clamped, -0.2, 0.0, 0.2) // Near Zero
diffN_SN := fuzzy_triangle(normalized_diff_clamped, -0.9, -0.5, -0.1) // Small Negative
diffN_LN := fuzzy_triangle(normalized_diff_clamped, -3.0, -1.5, -0.7) // Large Negative (around/below percentile)
// ----- 3.2 Fuzzy Sets for ROC -----
roc_HN := fuzzy_triangle(roc_val, -8.0, -5.0, -2.0)
roc_WN := fuzzy_triangle(roc_val, -3.0, -1.0, -0.1)
roc_NZ := fuzzy_triangle(roc_val, -0.3, 0.0, 0.3)
roc_WP := fuzzy_triangle(roc_val, 0.1, 1.0, 3.0)
roc_HP := fuzzy_triangle(roc_val, 2.0, 5.0, 8.0)
// ----- 3.3 Fuzzy Sets for RSI -----
rsi_L := fuzzy_triangle(rsi_val, 0.0, 25.0, 40.0)
rsi_M := fuzzy_triangle(rsi_val, 35.0, 50.0, 65.0)
rsi_H := fuzzy_triangle(rsi_val, 60.0, 75.0, 100.0)
Advanced Fuzzy Inference Rules
The indicator employs a comprehensive set of fuzzy rules that encode expert knowledge about market behavior:
// --- Fuzzy Rules using Normalized Deviation (diffN_*) ---
cond1 = math.min(diffN_LP, roc_HP, math.max(rsi_M, rsi_H)) // Strong Bullish: Large pos dev, strong pos roc, rsi ok
strength_SB := math.max(strength_SB, cond1)
cond2 = math.min(diffN_SP, roc_WP, rsi_M) // Weak Bullish: Small pos dev, weak pos roc, rsi mid
strength_WB := math.max(strength_WB, cond2)
cond3 = math.min(diffN_SP, roc_NZ, rsi_H) // Weakening Bullish: Small pos dev, flat roc, rsi high
strength_N := math.max(strength_N, cond3 * 0.6) // More neutral
strength_WB := math.max(strength_WB, cond3 * 0.2) // Less weak bullish
This rule system evaluates multiple conditions simultaneously, weighting them by their degree of membership to produce a comprehensive trend assessment. The rules are designed to identify various market conditions including strong trends, weakening trends, potential reversals, and neutral consolidations.
Defuzzification Process
The final step transforms the fuzzy result back into a crisp numerical value representing the overall trend strength:
// --- Step 6: Defuzzification ---
denominator = strength_SB + strength_WB + strength_N + strength_WBe + strength_SBe
if denominator > 1e-10 // Use small epsilon instead of != 0.0 for float comparison
fuzzyTrendScore := (strength_SB * STRONG_BULL +
strength_WB * WEAK_BULL +
strength_N * NEUTRAL +
strength_WBe * WEAK_BEAR +
strength_SBe * STRONG_BEAR) / denominator
The resulting FuzzyTrendScore ranges from -1 (strong bearish) to +1 (strong bullish), providing a smooth, continuous evaluation of market conditions that avoids the abrupt signal changes common in traditional indicators.
Advanced Visualization with Rainbow Gradient
The indicator incorporates sophisticated visualization using a rainbow gradient coloring system:
// Normalize score to for gradient function
normalizedScore = na(fuzzyTrendScore) ? 0.5 : math.max(0.0, math.min(1.0, (fuzzyTrendScore + 1) / 2))
// Get the color based on gradient setting and normalized score
final_color = get_gradient(normalizedScore, gradient_type)
This color-coding system provides intuitive visual feedback, with color intensity reflecting trend strength and direction. The gradient can be customized between Red-to-Green or Red-to-Blue configurations based on user preference.
Practical Applications
The Fuzzy SMA Trend Analyzer excels in several key applications:
Trend Identification: Precisely identifies market trend direction and strength with nuanced gradation
Market Regime Detection: Distinguishes between trending markets and consolidation phases
Divergence Analysis: Highlights potential reversals when price action and fuzzy trend score diverge
Filter for Trading Systems: Provides high-quality trend filtering for other trading strategies
Risk Management: Offers early warning of potential trend weakening or reversal
Parameter Customization
The indicator offers extensive customization options:
SMA Length: Adjusts the baseline moving average period
ROC Length: Controls momentum sensitivity
RSI Length: Configures overbought/oversold sensitivity
Normalization Lookback: Determines the adaptive calculation window for percentile normalization
Percentile Rank: Sets the statistical threshold for deviation normalization
Gradient Type: Selects the preferred color scheme for visualization
These parameters enable fine-tuning to specific market conditions, trading styles, and timeframes.
Acknowledgments
The rainbow gradient visualization component draws inspiration from LuxAlgo's "Rainbow Adaptive RSI" (used under CC BY-NC-SA 4.0 license). This implementation of fuzzy logic in technical analysis builds upon Fermi estimation principles to overcome the inherent limitations of crisp binary indicators.
This indicator is shared under Attribution-NonCommercial-ShareAlike 4.0 International (CC BY-NC-SA 4.0) license.
Remember that past performance does not guarantee future results. Always conduct thorough testing before implementing any technical indicator in live trading.

Highest High Line with Multi-Timeframe Supertrend and RSIOverview:
This powerful indicator combines three essential elements for traders:
Highest High Line – Tracks the highest price over a customizable lookback period across different timeframes.
Multi-Timeframe Supertrend – Displays Supertrend values and trend directions for multiple timeframes simultaneously.
Relative Strength Index (RSI) – Shows RSI values across different timeframes for momentum analysis.
Features:
✅ Customizable Highest High Line:
Selectable timeframes: Daily, Weekly, Monthly, Quarterly, Yearly
Adjustable lookback period
✅ Multi-Timeframe Supertrend:
Supports 1min, 5min, 10min, 15min, 30min, 1H, Daily, Weekly, Monthly, Quarterly, Yearly
ATR-based calculation with configurable ATR period and multiplier
Identifies bullish (green) & bearish (red) trends
✅ Multi-Timeframe RSI:
Calculates RSI for the same timeframes as Supertrend
Overbought (≥70) and Oversold (≤30) signals with color coding
✅ Comprehensive Table Display:
A clean, structured table in the bottom-right corner
Displays Supertrend direction, value, and RSI for all timeframes
Helps traders quickly assess trend and momentum alignment
How to Use:
Use the Highest High Line to identify key resistance zones.
Confirm trend direction with Multi-Timeframe Supertrend.
Check RSI values to avoid overbought/oversold conditions before entering trades.
Align multiple timeframes for stronger confirmation of trend shifts.
Ideal For:
✅ Scalpers (lower timeframes: 1m–30m)
✅ Swing Traders (higher timeframes: 1H–D)
✅ Position Traders (Weekly, Monthly, Quarterly)
💡 Tip: Look for Supertrend & RSI confluence across multiple timeframes for higher probability setups.
