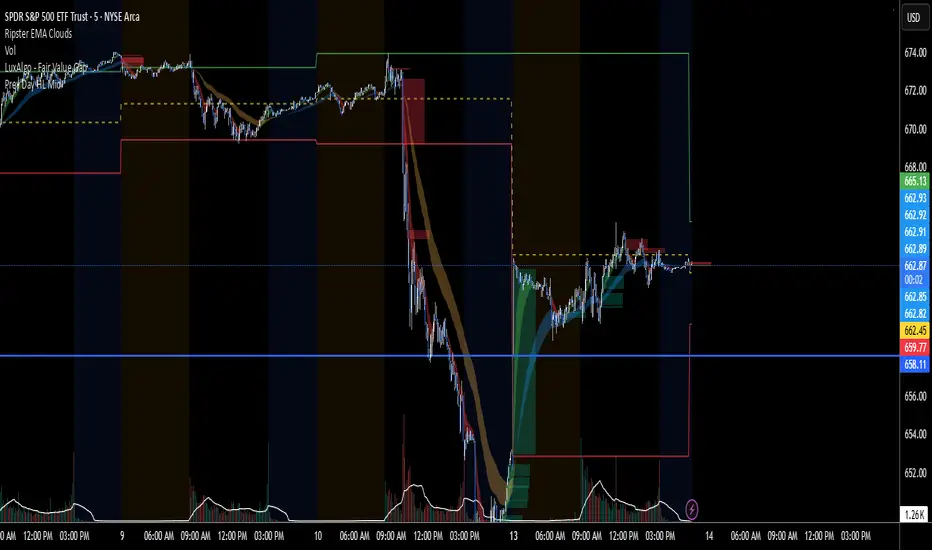
Previous Day High, Low, and MidThis indicator will draw out levels for the previous sessions highs and lows as well as the middle point between the two. Might not work with indices
在脚本中搜索"原油期货+ETF"
VIX Overnight Move Percentage@MiniHedgeFunds
An overnight percent move in the VIX used as an indicator below the graph


RVol (Daily and PreMarket)RVol with distinction between Pre-Market and Active Trading
Also ration of pre-market to Ave Daily Vol

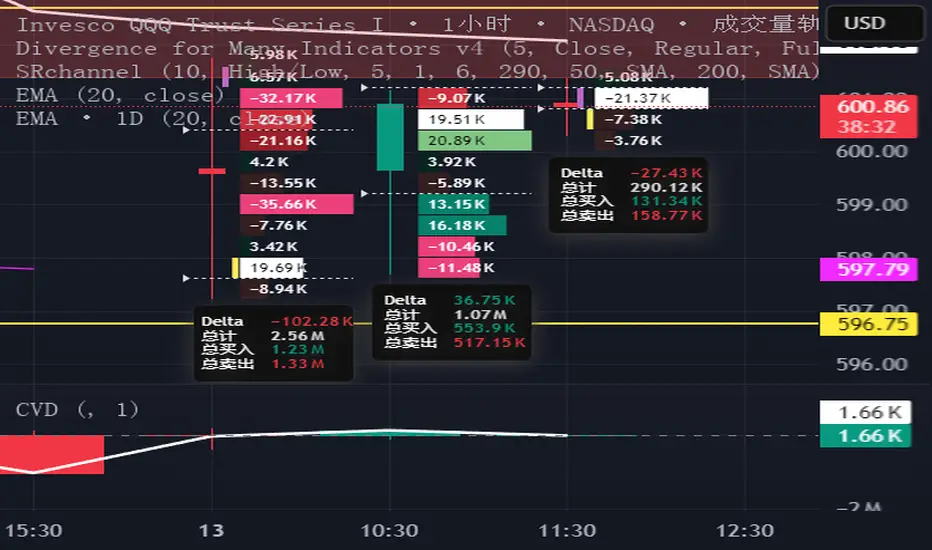
CVD with Trend LineThis indicator augments the traditional Cumulative Volume Delta (CVD) by incorporating a customizable trend line that connects the tops of the CVD histogram bars, enhancing visualization of delta trends and market momentum. The CVD measures the net difference between buying and selling volume, utilizing lower timeframe data for accuracy, with configurable anchor periods and timeframe options. The trend line, which can be tailored in both color and style (e.g., solid, dashed), provides traders with a flexible tool to track cumulative delta movements, aiding in the identification of market sentiment shifts. Perfect for volume-based analysis with a clear, adaptable display.
Premarket Gapper Swing Filter (Long) – v6here’s a plug-and-play Pine Script v5 “screener” you can drop on any chart to flag pre-market gainers that also meet swing-friendly trend/liquidity filters. It works as a chart-level scanner (since Pine can’t screen the whole market by itself): add it to a watchlist; symbols that qualify will light up and you can set alerts to ping you right at the opening bell.

SPY200SMA (+4%/-3%) TQQQ/QQQ STRATEGYSummary of the Improved Strategy: When the price of AMEX:SPY is +4% above the 200SMA BUY NASDAQ:TQQQ and when the price of SPY drops to -3% under the SPY 200SMA SELL everything and slowly DCA into NASDAQ:QQQ over the next 6-12 months or until price returns to +4% above the SPY 200SMA at which point you will go back into 100% TQQQ.
Note: (if the price of QQQ goes 30% above the 200SMA of QQQ deleverage to QQQ or Sell to protect yourself from dot com level event)
More info and stats -https://www.reddit.com/r/LETFs/comments/1nhye66/spy_200sma_43_tqqqqqq_long_term_investment/

KP_EMA_Cross_signal KP_EMA_Cross_signal : This signal removes a lot of false signals and will help in day trading.

Tamu2.0Testing Oct 2025. Indicator tries to identify short periods of volatility and market manipulation.

Extreme Candle Pattern Visualizer🟠 OVERVIEW
This indicator compares the current candle's percentage change against historical data, then highlights past candles with equal or bigger magnitude of movement. Also, for all the highlighted past candles, it tracks how far price extends before recovering to its starting point. It also provides statistical context through percentile rankings.
IN SHORT: Quickly spot similar price movements in the past and understand how unusual the current candle is using percentile rankings.
🟠 CORE CONCEPT
The indicator operates on two fundamental principles:
1. Statistical Rarity Detection
The script calculates the percentage change (open to close) of every candle within a user-defined lookback period and determines where the current candle ranks in this distribution. A candle closing at -9% might fall in the bottom 5th percentile, indicating it's more extreme than 95% of recent candles. This percentile ranking helps traders identify statistically unusual moves that often precede reversals or extended trends.
2. Recovery Path Mapping
Once extreme candles are identified (those matching or exceeding the current candle's magnitude), the indicator tracks their subsequent price action. For bearish candles, it measures how far price dropped before recovering back to the candle's opening price. For bullish candles, it tracks how high price climbed before returning to the open. This reveals whether extreme moves typically extend further or reverse quickly.
🟠 PRACTICAL APPLICATIONS
Mean Reversion Trading:
Candles in extreme percentiles (below 10% or above 90%) often signal oversold/overbought conditions. The recovery lines show typical extension distances, helping traders set profit targets for counter-trend entries.
Momentum Continuation:
When extreme candles show small recovery percentages before price reverses back, it suggests strong directional momentum that may continue.
Stop Loss Placement:
Historical recovery data reveals typical extension ranges after extreme moves, informing more precise stop loss positioning beyond noise but before major reversals.
Pattern Recognition:
By visualizing how similar historical extremes resolved, traders gain context for current price action rather than trading in isolation.
🟠 VISUAL ELEMENTS
Orange Circles: Mark historical candles with similar or greater magnitude to current candle
Red Lines: Track downward extensions after bearish extreme candles
Green Lines: Track upward extensions after bullish extreme candles
Percentage Labels: Show exact extension distance from candle close to extreme point
Percentile Label: Color-coded box displaying current candle's statistical ranking
Hollow Candles: Background rendering for clean chart presentation
🟠 ORIGINALITY
This indicator uniquely combines statistical percentile analysis with forward-looking recovery tracking. While many indicators identify extreme moves, few show what happened next across multiple historical instances simultaneously. The dual approach provides both the "how rare is this?" question (percentile) and "what typically happens after?" answer (recovery paths) in a single visual framework.

3DMA % Declining Issues (Diodato 2019)Description:
This script is a faithful implementation of the "3-DMA % Declining Issues" indicator from Chris Diodato's 2019 CMT paper, "Making The Most Of Panic." It is a simple but highly effective short-term panic meter based on market breadth.
What It Is
This indicator first calculates the percentage of total traded issues on the NYSE that were decliners for that day. It then plots a 3-day simple moving average of that percentage. The result is a 0-100 scale indicator that provides a clear visual of the intensity of recent, widespread selling pressure.
How to Interpret
Unlike a typical "oversold" oscillator where low is a signal, with this indicator, a high value indicates panic.
Panic Spikes: A sharp spike upward suggests that a very large portion of the market is selling off simultaneously. The paper found that when this indicator exceeded 65%, 70%, or 75%, it often marked a point of extreme short-term panic that presented a buying opportunity.
Panic Threshold: The script includes a customizable "Panic Threshold" line (defaulting to 65) to help you instantly spot these events.
Settings
Data Sources: Allows toggling the use of "Unchanged" issues data.
Thresholds: You can set the "Panic Threshold" line to your preferred level (e.g., 65, 70, 75).

Short-Term Capitulation Oscillator (STCO, Diodato 2019)Description:
This script is a faithful implementation of the Short-Term Capitulation Oscillator (STCO) from Chris Diodato's 2019 CMT paper, "Making The Most Of Panic". It's a tactical breadth and volume oscillator designed to "fish for market bottoms" by identifying short-term investor capitulation.
What It Is
The STCO combines the 10-day moving averages of NYSE up-volume and advancing issues. It measures the ratio of advancing momentum (in both volume and number of issues) relative to the total traded momentum. The result is a raw, un-normalized oscillator that typically ranges from 0 to 200.
How to Interpret
The STCO is a tactical tool for identifying near-term oversold conditions and potential bounces.
Low Readings: Indicate that sellers have likely exhausted themselves in the short term, creating a potential entry point for a bounce. The paper found that readings below 90, 85, and 80 were often followed by strong market performance over the next 5-20 days.
Overbought/Oversold Lines: Use the customizable overbought/oversold lines to define your own capitulation zones and potential entry areas.
Settings
Data Sources: Allows toggling the use of "Unchanged" issues/volume data.
Thresholds: You can set the overbought and oversold levels based on the paper's research or your own testing.

Long-Term Capitulation Oscillator (LTCO, Diodato 2019)Description:
This script is a faithful implementation of the Long-Term Capitulation Oscillator (LTCO) from Chris Diodato's award-winning 2019 CMT paper, "Making The Most Of Panic". It is a strategic, market-wide breadth and volume oscillator designed to identify major, long-term market bottoms.
What It Is
The LTCO combines long-term moving averages (34, 55, 89, 144, and 233-day) of NYSE advancing/declining issues and up/down volume. It uses a unique "average of averages" method to create a responsive yet strategic long-term indicator. This script plots the raw, un-normalized value as described in the paper, which typically oscillates in the 700-1100 range.
How to Interpret
The LTCO is a strategic tool for identifying potentially significant market turning points.
Extremely Low Readings: Suggest that a long-term period of selling has reached a point of exhaustion, potentially marking a major bear market low or a generational buying opportunity. The paper backtested various thresholds, with values below 950, 925, and especially 875 showing historically strong forward returns over the next 6-24 months.
Overbought/Oversold Lines: The script includes customizable overbought/oversold lines to help you visually identify these critical zones.
Settings
Data Sources: Allows toggling the use of "Unchanged" issues/volume data for the calculation.
Thresholds: You can set the overbought and oversold levels to your preference, based on the paper's findings or your own research.

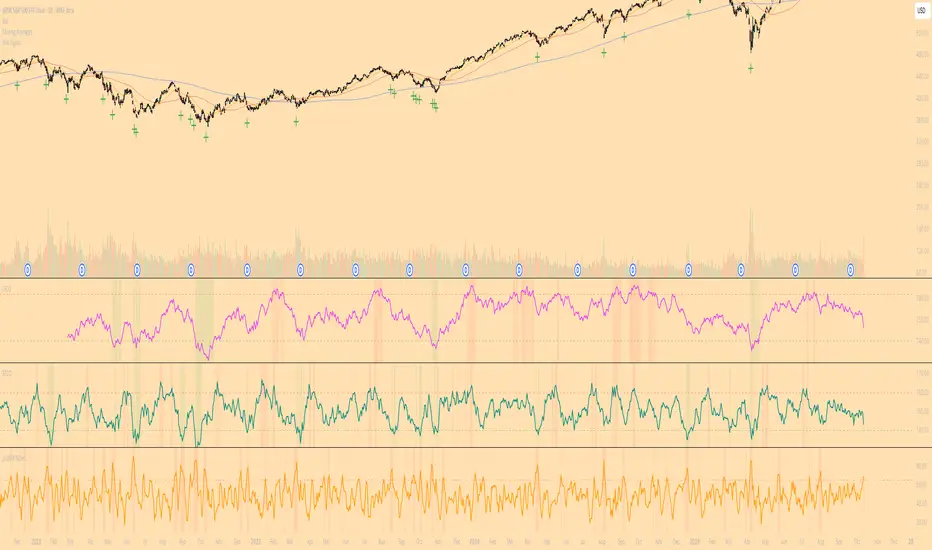
Diodato 'All Stars Align' SignalDescription:
This indicator is an overlay that plots the "All Stars Align" buy signal from Chris Diodato's 2019 CMT paper, "Making The Most Of Panic." It is designed to identify high-conviction, short-term buying opportunities by requiring a confluence of both price-based momentum and market-internal weakness.
What It Is
This script works entirely in the background, calculating three separate indicators: the 14-day Slow Stochastic, the Short-Term Capitulation Oscillator (STCO), and the 3-DMA of % Declining Issues. It then plots a signal directly on the main price chart only when the specific "All Stars Align" conditions are met.
How to Interpret
A green cross (+) appears below a price bar when a high-conviction buy signal is generated. This signal triggers only when two primary conditions are true:
The 14-day Slow Stochastic is in "oversold" territory (e.g., below 20).
AND at least one of the market internal indicators shows a state of panic:
Either the STCO is oversold (e.g., below 140).
Or the 3-DMA % Declines shows a panic spike (e.g., above 65).
This confluence signifies a potential exhaustion of sellers and can mark an opportune moment to look for entries.
Settings
Trigger Thresholds: You can customize the exact levels that define an "oversold" or "panic" state for each of the three underlying indicators.
Data Sources: Allows toggling the use of "Unchanged" data for the background calculations.
Stochastic Settings: You can adjust the parameters for the Slow Stochastic calculation.

Volume Quintiles - 10 Trading Days, Time-of-Day Awarethis logging in the last 20 trading days in the same time.

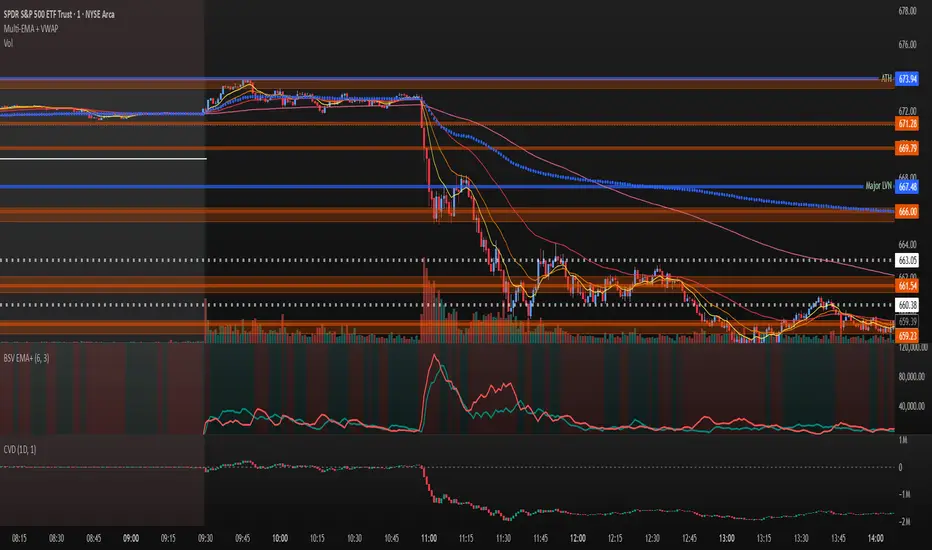
Volume Exponential Moving Averages (EMA)
Description:
This script is a simple script that plots a desired exponential moving average of buy and sell volume as a line chart with a tunable smoothing factor. There is a highlight on the plot area of either green or red to denote if the EMA of buy volume or sell volume is of a higher value. This indicator uses basic math of exponential averages and calculates volume using the formulas: "buy volume" = the product of total volume and the "closing price" minus the "low price" divided by "high price" minus the "low price" for a specific candle. Conversely, "sell volume" = the product of "total volume" and the "high price" minus the "close price" divided by "high price" minus the "low price" for a specific candle.
Utility:
This indicator is an effective way to gauge the acceleration/ deceleration of buyers and sellers in the market and can be used in combination with market structure and important levels to understand if buyers or sellers are taking over at any given time.
How to use this indicator:
There are two settings for this indicator:
1. The Length of the EMA: The length of the EMA can be adjusted based on your preference for a running number of candles' data. If you are interested to know short term changes in volume (e.g. over the past few candles at a major level) you can adjust this setting lower (~3-9 length). Conversely, if you are interested in volume trends over a greater number of candles you can increase this to your liking.
Personal preference : Because I am a short term daytrader/ scalper, I keep this setting at 6 length to see immediate changes in the acceleration or deceleration of buyers/ sellers.
2. The Smoothing Factor: The smoothing factor can be adjusted to further tune the size of trend you are interested in with 1 = No smoothing of the EMA line. Smoothing of the EMA line increases as the value for smoothing increases, resulting in a less volatile, more smooth EMA line. However, the more smooth the line, the less sensitive the EMA will be to immediate changes in volume pace. The less smoothing factor is applied, the more volatile data will be, resulting in quicker observation of shorter term trends. Again the same rules apply as the EMA length as these are similar in function: If you are interested to know short term changes in volume (e.g. over the past few candles at a major level) you can adjust this setting lower (~2-6). Conversely, if you are interested in volume trends over a greater number of candles you can increase this to your liking.
Personal preference : Because I am a short term daytrader/ scalper, I keep this setting at 2-4 smoothing factor to see immediate changes in the acceleration or deceleration of buyers/ sellers.
You should, of course, play with these settings to your exact preferences based on your trading style.
Tips for using this indicator:
General Use:
When the buy volume EMA is moving up, buyers are increasing the pace of buying and when the buy volume EMA is moving down, buyers are decreasing the pace of buying. Conversely, when the sell volume EMA is moving up, sellers are increasing the pace of selling and when the sell volume EMA is moving down, sellers are decreasing the pace of selling. The overall movement of the stock is relative to the combination of these rates. e.g. If both buyers and sellers are increasing at the same rate (EMAs slopes are roughly equal) there will be not a large change in price. If the slope of the buy volume EMA is greater than the slope of sell volume EMA, the price should move up. Conversely, if the slope of the sell volume EMA is greater than the slope of buy volume EMA, the price should move down.
Predicting pullbacks, reversals, and continuations:
This indicator allows you to see if buyers or sellers are increasing their pace, even if the stock price is in consolidation. This allows you to predict if out of the consolidation buyers or sellers are likely to win based on the momentum of the volume in consolidation. e.g. If price is in consolidation after an uptrend and the buy volume EMA starts to decrease, this could be a sign that buyers are running out of steam at this price level. Another example, If at a major support the buy volume EMA begins to trend up then buyers are accelerating the pace of buying at this level.
EMA crosses: There is something to be said about the point at which the buy volume EMA and sell volume EMA cross. This signifies that at this moment there is a shift in which the acceleration of one party outpaces that of the other and can result in increased speed of the movement of the stock price.
Considerations
Because volume changes constantly, this indicator is best to identify short term changes in volume that could impact price movements. It is not guaranteed to continue just because buyers or sellers have had a change in pace. Therefore it is advised to use this indicator in combination with significant price levels such as pivot points, or price levels from volume profile tools to identify the price zones where significant volume changes are likely to impact price movements. It is also advised to continue to monitor the changes in pace in buyers and sellers using this volume EMA indicator to determine if a change in pace is short lived or if it will continue for a longer duration.
Examples of use:
Bullish Reversal:
Bearish Continuation:
Bearish EMA Crossover: (Settings: Length 6, Smoothing factor 3)
Bullish EMA Crossover: (Settings: Length 6, Smoothing factor 4)
Multiple Symbol Trend Screener [Pineify]Multiple Symbol Trend Screener Pineify – Ultimate Multi-Indicator Scanner for TradingView
Empower your trading with deep market insights across multiple symbols using this feature-rich Pine Script screener. The Multiple Symbol Trend Screener Pineify enables traders to monitor and compare trends, reversals, and consolidations in real-time across the biggest equity symbols on TradingView, through a synergistic blend of popular technical indicators.
Key Features
Monitor up to 15 symbols and their trends simultaneously
Integrates 7 professional-grade indicators: MA Distance, Aroon, Parabolic SAR (PSAR), ADX, Supertrend, Keltner Channel, and BBTrend
Color-coded table display for instant visual assessment
Customizable lookback periods, indicator types, and calculation methods
SEO optimized for multi-symbol trend detection, screener, and advanced TradingView indicator
How It Works
This indicator leverages TradingView’s Pine Script v6 and request.security() to process multiple symbols across selected timeframes. Data populates a dynamic table, updating each cell based on the calculated value of every underlying indicator. MA Distance highlights deviation from moving averages; Aroon flags emerging trend strength; PSAR marks potential trend reversals; ADX assesses trend momentum; Supertrend detects bullish/bearish phases; Keltner Channel and BBTrend offer volatility and power insights.
Set up your preferred symbols and timeframes
Each indicator runs its calculation per symbol using its parameter group
All results are displayed in a table for a comprehensive dashboard view
Trading Ideas and Insights
Traders can use this screener for cross-market comparison, directional bias, entry/exit filtering, and comprehensive trend evaluation. The screener is excellent for swing trading, day trading, and portfolio tracking. It enables confirmation across multiple frameworks — for example, spotting momentum with ADX before confirming direction with Supertrend and PSAR.
Identify correlated movements or divergences across selected assets
Spot synchronized trend changes for basket trading ideas
Filter symbols by volatility, strength, or trend status for precise trade selection
How Multiple Indicators Work Together
The screener’s edge lies in its intelligent correlation of popular indicators. MA Distance measures the proximity to chosen moving averages, ideal for spotting overbought/oversold conditions. Aroon reveals the strength of new price trends, PSAR indicates reversal signals, and ADX quantifies the momentum of these trends. Supertrend provides a directional phase, while Keltner Channel & BBTrend analyze volatility shifts and band compressions. This amalgamation allows for a robust, multi-dimensional market snapshot, capturing details missed by single-indicator tools.
By displaying all key metrics side-by-side, the screener enables holistic decision-making, revealing confluence zones and contradiction areas across multiple tickers and timeframes.
Unique Aspects
Original implementation combining seven independent trend and momentum indicators for each symbol
Rich customization for symbols, timeframes, and all indicator parameters
Intuitive color-coding for quick reading of bullish/bearish/neutral signals
Comprehensive dashboard for instant actionable insights
How to Use
Load the indicator onto your TradingView chart
Go to the script’s settings and input your preferred symbols and relevant timeframes
Set your desired parameters for each indicator group: Moving Average type, Aroon length, PSAR values, ADX smoothing, etc.
Observe the results in the top-right table, then use it to filter candidates and validate trade setups
The screener is suitable for all timeframes and asset classes available on TradingView. Make sure your chart’s timeframe matches the one used in the scanner for optimal accuracy.
Customization
Choose up to 15 symbols to monitor in a single dashboard
Customize lookback periods, indicator types, colors, and display settings
Configure alerting options and thresholds for advanced trade automation
Conclusion
The Multiple Symbol Trend Screener Pineify sets a new standard for multi-asset screening on TradingView. By elegantly merging seven proven technical indicators, the screener delivers powerful trend detection, reversal analysis, and volatility monitoring — all in one dashboard. Take your trading to new heights with in-depth, customizable market surveillance.

ShockDrop Alerts v1⚡ ShockDrop Alerts — Rapid Drop & Drawdown Detector
ShockDrop Alerts helps you react instantly to sudden market shocks.
It tracks both fast price drops and intraday drawdowns, plotting clean visual arrows and sending alerts when volatility spikes — so you can respond before small dips turn into major moves.
⚙️ How It Works
• Fast Drop (FAST) – detects sharp declines (e.g. 2 % in 4 minutes) using 1-minute data across any timeframe.
• Drawdown (DD) – triggers when price trades a set percentage below the day’s session high (e.g. 2 %).
Each alert type has its own independent cooldown timer and can be toggled on or off.
🎯 What You’ll See
• FAST → 🔴 red arrow above the bar (rapid drop detection)
• DD → 🟠 orange arrow below the bar (intraday drawdown)
These appear only when your defined conditions are met. Connect them to TradingView alerts for instant popup, email, mobile, or webhook notifications.
🧭 Key Features
• Detects high-velocity price shocks in real time
• Separate cooldowns for FAST and DD triggers
• Extended-hours toggle to include pre/post-market data
• Clean, clutter-free visuals — only actionable arrows
• Uses 1-minute precision data, works on any symbol or timeframe
• Supports server-side alerts (TradingView Pro +)
📬 Why Traders Use It
• Get early warnings during flash crashes or liquidity spikes
• Automate risk-based exits when markets accelerate downward
• Track SPY, QQQ, crypto, or futures for rapid reversals
• Stay alert to high-impact news events — such as surprise policy comments, earnings releases, or market-moving presidential posts — that can cause sudden volatility
Requires TradingView Pro + for continuous server-side alerting.

NYSE FOMO Indicator (Up/Down Volume Ratio)This script plots the NYSE Sentiment Gauge, based on the daily Up/Down Volume Ratio (UVOL ÷ DVOL).
It measures crowd emotion in the overall market:
• ≥ 3 = Red: FOMO, extreme buying.
• 2–3 = Yellow: Cautious optimism.
• 0.5–2 = Grey: Neutral zone.
• 0.33–0.5 = Green: Emerging fear.
• ≤ 0.33 = Bright Green: Panic selling, potential bottom.
The line color and chart background change according to these zones, visually showing shifts in market sentiment.

Swing Data - SimplifiedThe swing data indicator by jfsrev but simplified. Thank you jfsrev for your work!
Larry Williams Oops StrategyThis strategy is a modern take on Larry Williams’ classic Oops setup. It trades intraday while referencing daily bars to detect opening gaps and align entries with the prior day’s direction. Risk is managed with day-based stops, and—unlike the original—all positions are closed at the end of the session (or at the last bar’s close), not at a fixed profit target or the first profitable open.
Entry Rules
Long setup (bullish reversion): Today opens below yesterday’s low (down gap) and yesterday’s candle was bearish. Place a buy stop at yesterday’s low + Filter (ticks).
Short setup (bearish reversion): Today opens above yesterday’s high (up gap) and yesterday’s candle was bullish. Place a sell stop at yesterday’s high − Filter (ticks).
Longs are only taken on down-gap days; shorts only on up-gap days.
Protective Stop
If long, stop loss trails the current day’s low.
If short, stop loss trails the current day’s high.
Exit Logic
Positions are force-closed at the end of the session (in the last bar), ensuring no overnight exposure. There is no take-profit; only stop loss or end-of-day flat.
Notes
This strategy is designed for intraday charts (minutes/seconds) using daily data for gaps and prior-day direction.
Longs/shorts can be enabled or disabled independently.

Larry Williams Bonus Track PatternThis strategy trades the day immediately following an Inside Day, under specific directional and timing conditions. It is designed for daily-based setups but executed on intraday charts to ensure orders are placed exactly at the open of the following day, rather than at the daily bar close.
Entry Conditions
Only trades on Monday, Thursday, or Friday.
The previous day must be an Inside Day (its high is lower than the prior high and its low is higher than the prior low).
The bar before the Inside Day must be bullish (close > open).
On the following day (t):
The daily open must be below both the Inside Day’s high and the highest high of the two days before that.
A buy stop is placed at the highest high of the three previous days (Inside Day and the two days before it).
If the new day’s open is already above that level (gap up), the strategy enters long immediately at the open.
Exit Rules
Stop Loss: Fixed, defined in points or percentage (user input).
FPO (First Profitable Open): the position is closed at the first daily open after the entry day where the open price is above the average entry price (the first profitable open).
Notes
The script must be applied on an intraday timeframe (e.g., 15-minute or 1-hour) so that the strategy can:
Detect the Inside Day pattern using daily data (request.security).
Execute orders in real time at the next day’s open.
Running it directly on the daily timeframe will delay executions by one bar due to Pine Script’s evaluation model.
