Technical Analysis - Panel Info//A. Oscillators & B. Moving Averages base on TradingView's Technical Analysis by ThiagoSchmitz
//C.Pivot base on Ultimate Pivot Points Alerts by elbartt
//D. Summary & Panel info by anhnguyen14
Panel Info base on these indicators:
A. Oscillators
1. Rsi (14)
2. Stochastic (14,3,3)
3. CCI (20)
4. ADX (14)
5. AO
6. Momentum (10)
7. MACD (12,26)
8. Stoch RSI (3,3,14,14)
9. %R (14)
10. Bull bear
11. UO (7,14,28)
B. Moving Averages
1. SMA & EMA: 5-10-20-30-50-100-200
2. Ichimoku Cloud - Baseline (26)
3. Hull MA (9)
C. Pivot
1. Traditional
2. Fibonacci
3. Woodie
4. Camarilla
D. Summary
Sum_red=A_red+B_red+C_red
Sum_blue=A_blue+B_blue+C_blue
sell_point=(Sum_red/32)*100
buy_point=(Sum_blue/32)*100
sell =
Sum_red>Sum_blue
and sell_point>50
Strong_sell =
A_red>A_blue
and B_red>B_blue
and C_red>C_blue
and sell_point>50
and not crossunder(sell_point,75)
buy =
Sum_red>Sum_blue
and buy_point>50
Strong_buy =
A_red50
and not crossunder(buy_point,75)
neutral = not sell and not Strong_sell and not buy and not Strong_buy
在脚本中搜索"小鹏汽车港股3月28日收盘价"

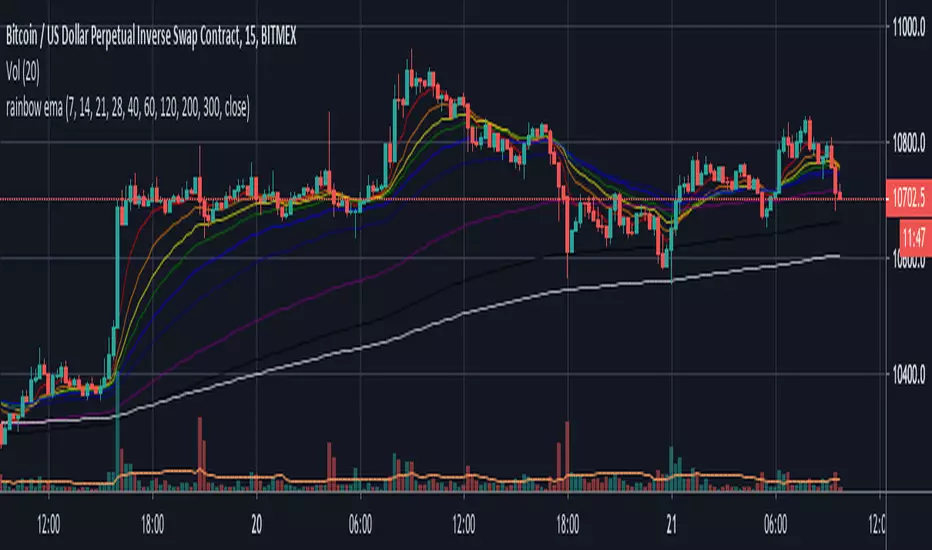
rainbow emaHi guys,
This is a multiple EMA script. Editing is free for use if you swap ema to sma as a base setting.
You can use several ema lines by adding one indicator only, and I put 7,14,21,28,40,60,120,200,300 as a threshold which I frequently use.
It is made as an open source at any time possible, so that you are free for playing with it.
Cheers,
JB
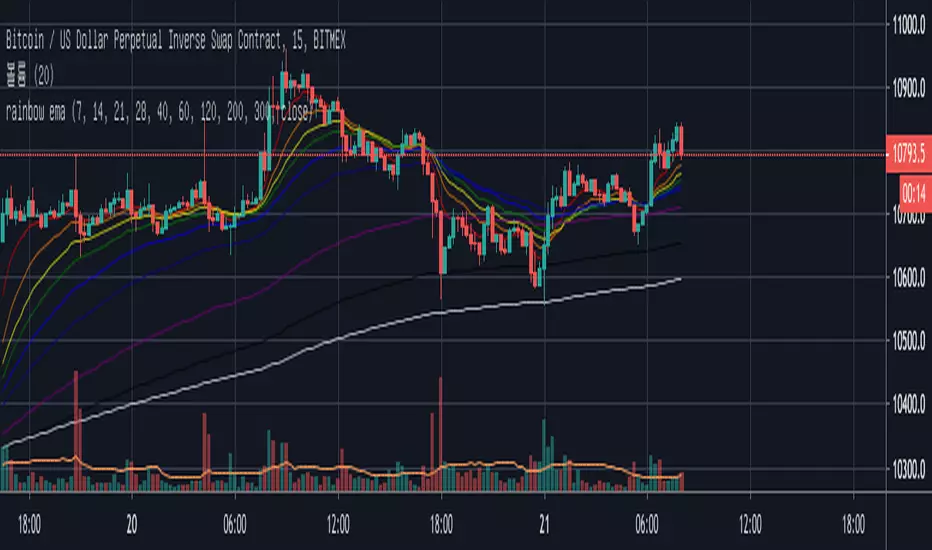
rainbow ema갤럭시님 이평선 토대로 JB가 에디트한 지수이평선 모음입니다. 편집하시면 일반 이평선으로도 사용이 가능합니다.
하나의 지표 추가 만으로 여러개의 지수이평선을 사용하실 수 있고, 제가 자주 사용하는 7,14,21,28,40,60,120,200,300선 넣어 놨습니다.
에디트 언제든 가능하시게 오픈소스로 구성되어있으니, 즐겨찾기 넣어 두시고 매매하실때 유용하게 사용하시면 됩니다.
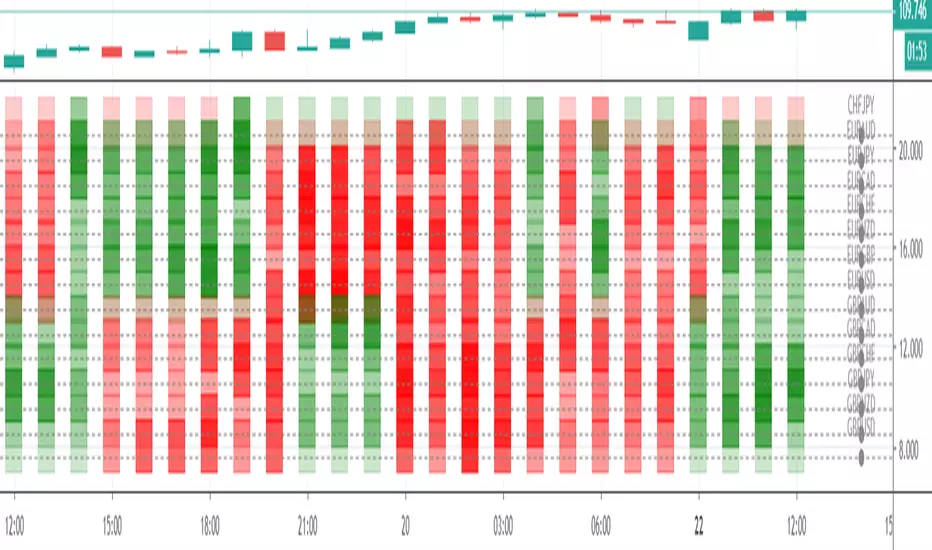
8 Pair Strength - updated by rmireland for CHF/EUR/GBPCurrency Strength meter
First created by Glaz in 2015 and updated a few times by JustUncleL in 2017 , I have stripped out the plot functions and color coded results against pairs.
I feel this makes the results easier to interpret. The darker the color the stronger the asset.
As Pine Script only allows a maximum of outputs, I have split this into 2 Scripts to cover all 28 pairs.
8 Pair Strength - AUD/CAD/NZD/USD for AUD/CAD - AUD/CHF - AUD/JPY - AUD/NZD
AUD/USD - CAD/CHF - CAD/JPY - NZD/CAD
NZD/CHF - NZD/JPY - NZD/USD - USD/CAD
USD/CHF - USD/JPY
8 Pair Strength - CHF/EUR/GBP for CHF/JPY - EUR/AUD - EUR/JPY - EUR/CAD
EUR/CHF - EUR/NZD - EUR/GBP - EUR/USD
GBP/AUD - GBP/CAD - GBP/CHF - GBP/JPY
GBP/NZD - GBP/USD
Enjoy
8 Pair Strength - updated by rmireland for AUD/CAD/NZD/USDCurrency Strength meter
First created by Glaz in 2015 and updated a few times by JustUncleL in 2017 , I have stripped out the plot functions and color coded results against pairs.
I feel this makes the results easier to interpret. The darker the color the stronger the asset.
As Pine Script only allows a maximum of outputs, I have split this into 2 Scripts to cover all 28 pairs.
8 Pair Strength - AUD/CAD/NZD/USD for AUD/CAD - AUD/CHF - AUD/JPY - AUD/NZD
AUD/USD - CAD/CHF - CAD/JPY - NZD/CAD
NZD/CHF - NZD/JPY - NZD/USD - USD/CAD
USD/CHF - USD/JPY
8 Pair Strength - CHF/EUR/GBP for CHF/JPY - EUR/AUD - EUR/JPY - EUR/CAD
EUR/CHF - EUR/NZD - EUR/GBP - EUR/USD
GBP/AUD - GBP/CAD - GBP/CHF - GBP/JPY
GBP/NZD - GBP/USD
Enjoy

Multiple lines EMA/SMA [AKUBI] Ver.2 - 5本の指数平滑・移動平均線単純移動平均線と指数平滑移動平均線(SMA/EMA)を最大5本引けるインジケーターです。
これまでのものとの違いは
・線の太さ
・名前の変更←これ重要
です。いままでのものをそのまま使用いただいても、問題はありません。
通常、トレーディングビューでは、
移動平均線を5本同時に表示させるには「5つのインジケーターを必要とします」。
しかし、 このインジケーターは1つ使えば最大5本まで同時に表示させることができます 。
また、余計なオプションは一切ありませんので、 どなたにでも、すぐにご使用いただけます 。
1)まず、この画面の右下にある「お気に入りに追加」をクリックしてください。
そうすると、インジケーターの「お気に入り」からいつでも呼び出せます。
もしくはインジケーターの検索欄から「AKUBI」と検索しても見つけられます。
使い方は簡単。
2)EMA(指数平滑移動平均線)か SMA(単純移動平均線)のいずれかを選択。
3)その後、お好きな期間を入力してください。
単純移動平均線(SMA)というのは、「5」と入力すれば、5本分のローソク足の終値の平均が表示され、それを結んだ線です。
指数平滑移動平均線(EMA)というのは、少し計算を複雑にして、より素早い動作を実現したものです。
デフォルトでは期間として(7,28,84,100,500)の5種類があらかじめ入力されています。
このまま使っても問題ありませんが、ネットで「移動平均線 設定」と検索すれば、いろいろな設定が紹介されていますので、参考にしてみてください。
不要な線があれば、チェックを外すだけです。
とっても簡単、便利です。
It is all in one. You can use 5 moving average lines with this one indicator only.
It is so easy. Just add this indicator. Next step, please add your favorite periods.
If you think this is an unnecessary line, you just remove in the check box.
Thank you!

Relative Major Currency Volume (RMCV)The point of this indicator is to determine which currencies as a whole, rather than pairs, are experiencing high volume.
It does this by drawing volume information from all 28 major pairs. It then takes two simple moving averages, one short-term and one long-term, and compares and normalizes the difference between these two (this difference is called relative volume). These relative volumes for each pair are then averaged together to find the relative volume for the entire currency. If relative volume is greater than 0, then the currency is experiencing higher volume than average as a whole. If relative volume is less than 0, the currency as a whole is experiencing low volume.
This can be used as a starting point to find specific pairs that are experiencing high volumes, or to determine which currencies are likely to undergo major changes in the near future.

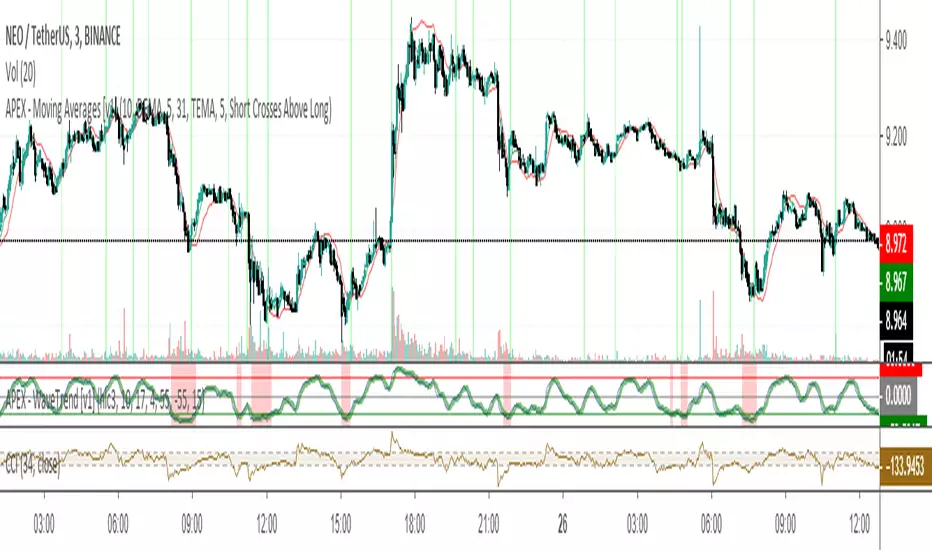
APEX - Moving Averages [v1]A moving average is the most known indicator that takes into consideration price from the last several periods of the price and calculates a smoothed line also known as a Moving average. This way you will cut out a lot of the noise and have a different view.
The most common usage is the moving average crossover system when you buy and sell when a crossover happens. This system is in general not very profitable but can be used effectively in trending markets.
There is really no general rule to what length should be used. The most well-known and respected lengths are 20 / 50 / 100 / 200 for almost all average. These values are respected as strong resistance and support levels. but if you plan to use a crossover Systems the most profitable settings tend to be when the averages are close together 14 and 28 etc. But this is an area I would appeal to for you to really try out what works and what does not.
Other uses of moving averages are the following:
Crossover system
Moving averages are pointing up and price crosses below (Buy Pullback)
The slow-moving average is Below the fast moving average to help to identify possible bullishness
Can be used as support and resistance lines
If you are an advanced user you may want to try out the following techniques:
Create your own moving average by combining several of those together with the source function
Using the Average True Range to create Keltner Channels
Using Standard deviation to create Bollinger bands (Bollinger bands are also accessible on their own)
You can use Moving averages to smooth the noise on other indicators such as RSI / CCI / MFI
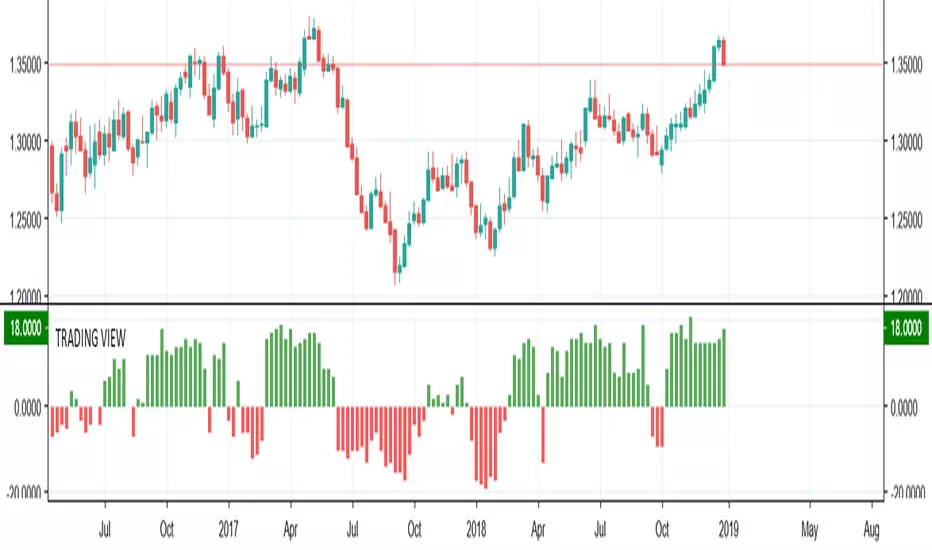
TRADING VIEW INDICATOR - PINE TUTORIAL 5After a long gap, I have written the 5th tutorial for the pine script. You can find the others below, if you read through all of these you should be good to do your own writing.
This script mimics the Trading View Indicator . For example this one below.
www.tradingview.com
It shows the net result of the 28 indicator, either as buy or sell. I have worked hard to make sure it matches the trading view results but I am not in hundred percent agreement with tradingView on SMA, EMA and Ichimoku indicator.
There are many commented plots because I needed to check separately if each indicator is working correctly.
Someone else wrote this code but they did not make it public. It took me about 3 weeks to write this and to be honest it could be cleaner and better commented.
If you find any mistake please let me know. I hope it will be useful in your learning.
Creating long term bitcoin data
One of the problems, with bitcoin, is that we miss long term bitcoin data. There is not a single source from which to gather the value of bitcoin in any moment from it's inception. Or at least from when it was first exchanged into exchanges. If you look at coinmarketcap the data go back to the 28 apr 2013. But mtgox started in July 2010. If you go to yahoo, you will be able to gather data, but once you start working with this data you soon find out how poor is it. Basically it follows mtgox data while mtgox was alive, and then switched to some other exchange. But this means that we see a sudden jump in data which makes any indicator go wild. Basically it's really difficult to gather long term data on bitcoin. Also consider that mtgox did not just "go away" when it stopped trading. But in the database here it is still present with the fixed exchange rate of when it stopped.
So I tried to create the data we need. How? By taking three exchanges, and taking the median between them. The three exchanges I took were MTGOX: , BITFINEX: and KRAKEN: XBTUSD . We cannot avoid mtgox because it's the only source of data for the first years. But then as soon as the other exchanges come in we are going to use the median between them.
The indicator must be overlaid on another chart. And I use the forex usdeur which I then hide (If someone has a better idea, maybe something which is open 24/7, I would be happy to hear it).

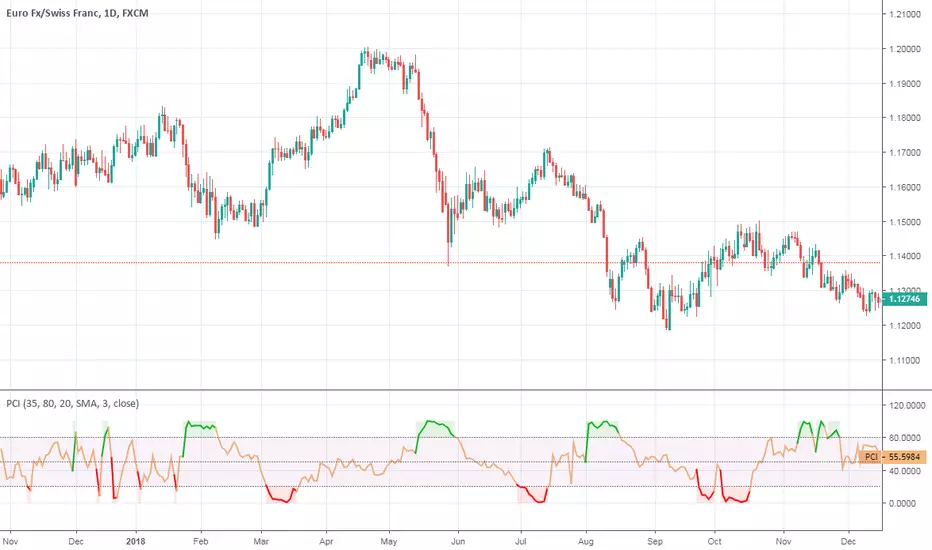
Phase Change IndexPhase Change Index script.
This indicator was developed and described by M. H. Pee (Stocks & Commodities V.22:5 (28-37): Phase Change Index).
Other indicators of M. H. Pee:

RSI Oversold bounce - Scaling in levels (30, 28, 26, 24, 22, 20)Oversold bounce entry levels based on RSI
Helps to gauge levels for scaling into a position based on oversold rsi levels.

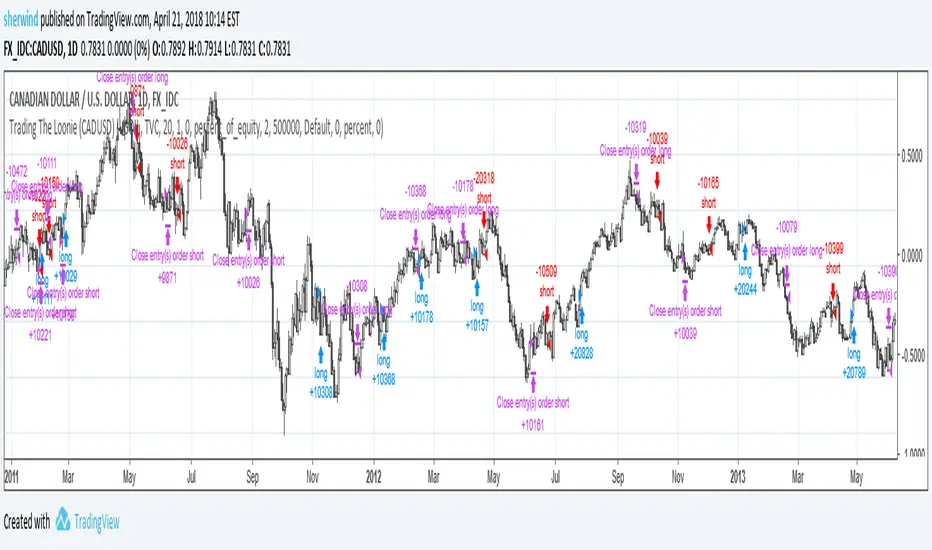
Trading The Loonie (CADUSD)A port of the trading strategy described at technical.traders.com
"In “Trading The Loonie,” which appeared in the December 2015 issue of STOCKS & COMMODITIES, author Markos Katsanos
explains the heavy correlation between the Canadian dollar and crude oil. He then goes on to describe how one could
trade this correlation. Using similar logic as that employed in Bollinger Bands, Katsanos has built a study to
provide buy and sell signals for trading the Canadian dollar future."
See Also:
- Backtesting and forwardtesting (of TradingView Strategies)
- 9 Mistakes Quants Make that Cause Backtests to Lie (blog.quantopian.com)
- When Backtests Meet Reality (financial-hacker.com)
- Why MT4 backtesting does not work (www.stevehopwoodforex.com)
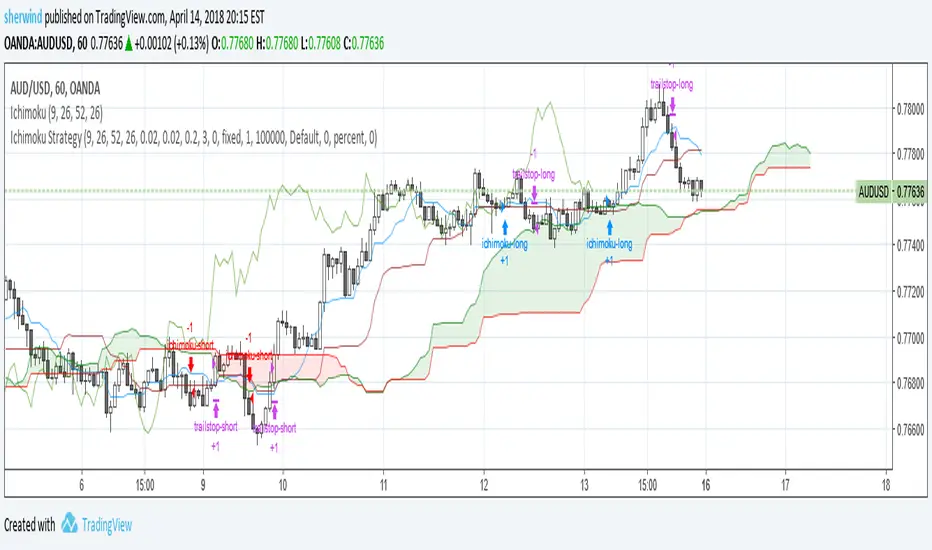
Ichimoku Cloud StrategyBased on the trading strategy described at
stockcharts.com
See Also:
- Backtesting and forwardtesting (of TradingView Strategies)
- 9 Mistakes Quants Make that Cause Backtests to Lie
- When Backtests Meet Reality
- Why MT4 backtesting does not work
Mean-Reversion Swing Trading Strategy v1A port of the TradeStation EasyLanguage code for a mean-revision strategy described at
traders.com
"In “Mean-Reversion Swing Trading,” which appeared in the December 2016 issue of STOCKS & COMMODITIES, author Ken Calhoun
describes a trading methodology where the trader attempts to enter an existing trend after there has been a pullback.
He suggests looking for 50% pullbacks in strong trends and waiting for price to move back in the direction of the trend
before entering the trade."
See Also:
- 9 Mistakes Quants Make that Cause Backtests to Lie (blog.quantopian.com)
- When Backtests Meet Reality (financial-hacker.com)
- Why MT4 backtesting does not work (www.stevehopwoodforex.com)

Trend Trigger FactorTrend Trigger Factor indicator script. This indicator was originally developed by M. H. Pee (Stocks & Commodities V.22:12 (28-36): Trend Trigger Factor).

Estimate exchange/broker fee commission from trade volumeThis script is used to estimate how much an exchange/broker makes off a particular pair/symbol. If Coinbase(GDAX) has a 0.25% taker fee and a 0.15% maker fee per trade and you estimate the average commission fee at 0.19% then you simple input that, and how many periods you'd like to know the total fee for (30 periods on the 1 day chart = last 30 days, 28 periods on 4 hour chart = last 7 days, etc).
This is for broad estimates of a single pair and only works well on exchanges that show only the volume on that exchange (stock markets may be less useful for this tool).
THIS TOOL IS TO PROVIDE A BROAD ESTIMATE , NOT AN EXACT FIGURE!
// percentage fee rate is entered as a percent: 3.5=3.5%, not 350%.
// pbtc , the one for calculating the USD value of fees that are in bitcoin, uses the price at time fees were realized. IE chart is on
// 1 day interval and XBARFEE is set at 4, then PBTC gives the USD value as if the exchange sold all btc at the end of each day for
// 4 days. i.e.:
// Day 1: BTCUSD= $5000 fees=1.5, Day 2: BTCUSD = $5000 fees=3.0, Day 3 BTCUSD = $10,000 fees=1.0, Day 4 BTCUSD = $20,000 fees=1.0
// PBTC would NOT show (1.5+ 3 + 1 + 1) = 6.5 * $20k = $130,000. It would do: (1.5*5000)+(3*5000)... = $52,500.

Free Strategy #08 (Combo of #01 and #02) (ES / SPY)This strategy was designed to be traded on daily data on the ES and SPY—the strategy was originally developed for NinjaTrader, which displays daily ES data based on RTH hours instead of 24 hours (1440 minute) like TradingView does, so we are presenting the results on the SPY until we figure out how to overcome this hurdle.
The strategy combines the two ideas from strategy #01 and strategy #02 .
Strategy #08
Quantity 100
Slippage: 2 ticks
Commission: 4.95 per order
Net Profit: 26,044.60
Max Drawdown: 3,947.60
Buy and Hold (Custom)
Quantity 100
Slippage: 2 ticks
Commission: 4.95 per order
Entry Long: 1993-02-01 @ 43.99
Exit Long: 2017-07-28 @ 246.34
Net Profit: 20,225.10
Max Drawdown: 9,042.00

Free Strategy #02 (ES / SPY)This strategy was designed to be traded on daily data on the ES and SPY—the strategy was originally developed for NinjaTrader, which displays daily ES data based on RTH hours instead of 24 hours (1440 minute) like TradingView does, so we are presenting the results on the SPY until we figure out how to overcome this hurdle.
Strategy #02
Quantity 100
Slippage: 2 ticks
Commission: 4.95 per order
Net Profit: 10,118.30
Max Drawdown: 4.037.60
Buy and Hold (Custom)
Quantity 100
Slippage: 2 ticks
Commission: 4.95 per order
Entry Long: 1993-02-01 @ 43.99
Exit Long: 2017-07-28 @ 246.34
Net Profit: 20,225.10
Max Drawdown: 9,042.00

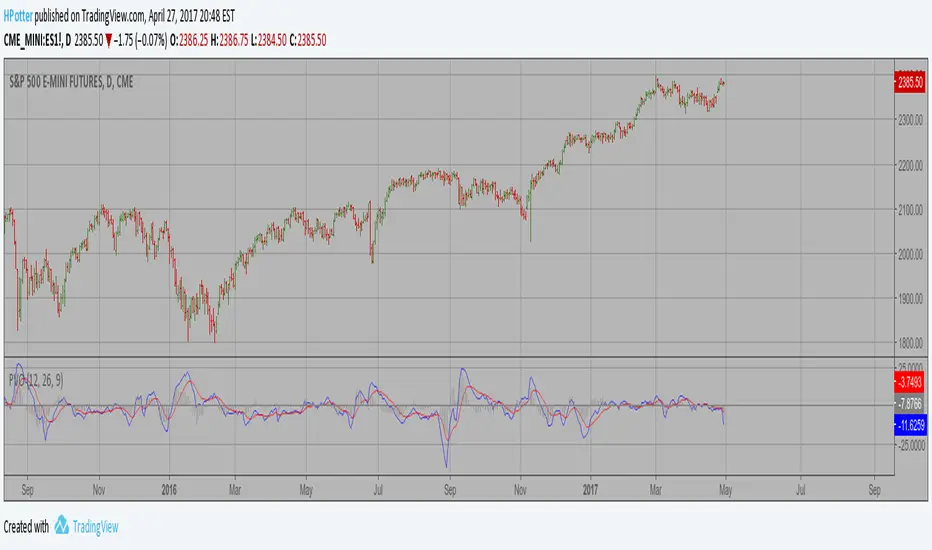
Percentage Volume Oscillator (PVO) Copyright by HPotter v1.0 28/04/2017
The Percentage Volume Oscillator (PVO) is a momentum oscillator for volume.
PVO measures the difference between two volume-based moving averages as a
percentage of the larger moving average. As with MACD and the Percentage Price
Oscillator (PPO), it is shown with a signal line, a histogram and a centerline.
PVO is positive when the shorter volume EMA is above the longer volume EMA and
negative when the shorter volume EMA is below. This indicator can be used to define
the ups and downs for volume, which can then be use to confirm or refute other signals.
Typically, a breakout or support break is validated when PVO is rising or positive.
Open/Close Vertical Line by WiscoDishOpen and close lines. I used a 4 minute timeframe, so the open price goes on 08:28-08:32 central time for the 8:30 open. You can change those times if you want, just copy/paste the script and edit.

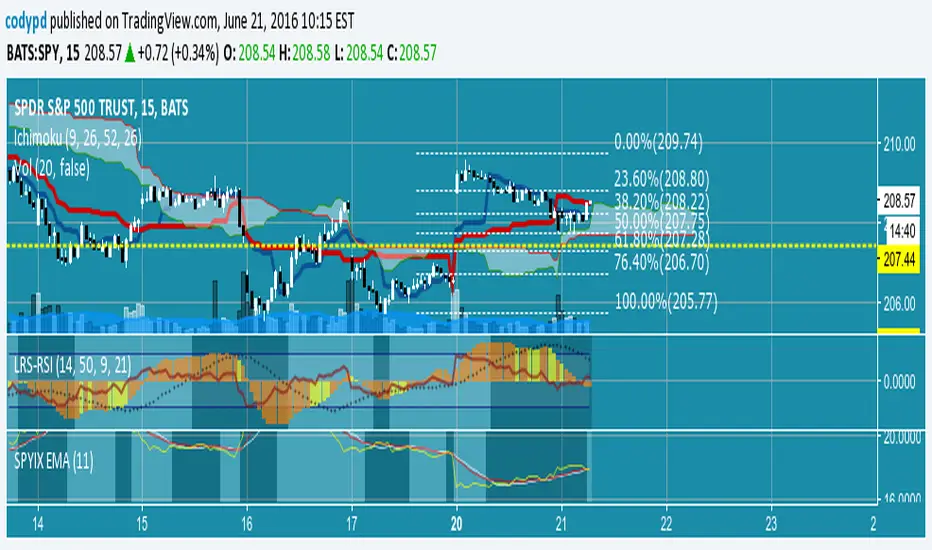
SPYIX EMAVariation on idea at url below using SPYIX from BATS instead of VIX
from marketsci.wordpress.com
Aids in identifying changes in volatility direction.
EDIT: just noticed that URL is now password protected. The concept from the author is simple: use EMA and SMA smoothing of the VIX as two signal lines. When they cross you have a change in VIX direction. I simply coded that for SPYIX which is a slightly different (but theoretically similar) index vs VIX. SPYIX provides intraday updates without a subscription so this indicator can be used for intraday tracking.