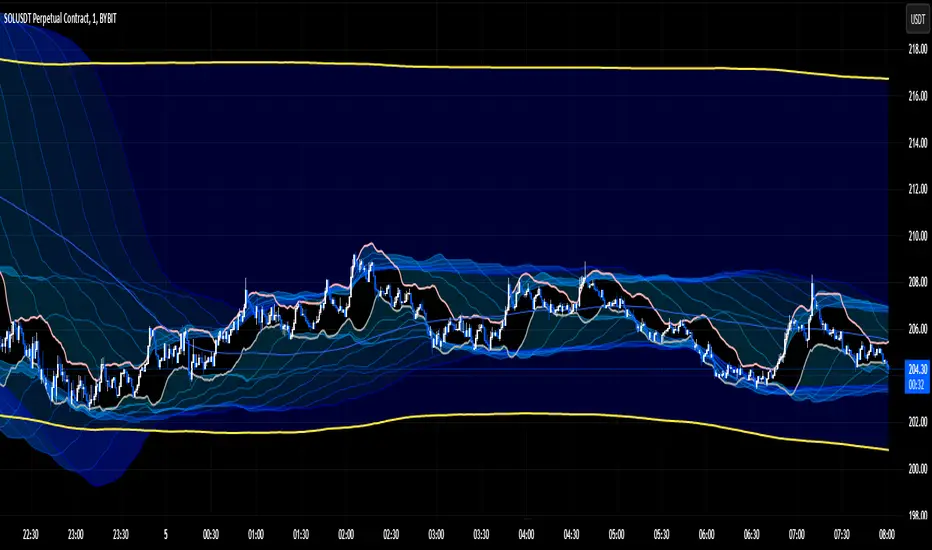
Bollinger Bands and SMA Channel Buy and Sell
This Indicator is a combination of a standard BB indicator incorporated with a SSL Channel by ErwinBeckers which is Simple Moving average with a length of set at 10 (Default) and calculates the high and low set for the default 10 to form a Channel.
The Settings for the Bollinger Band is the standard settings on a normal Bollinger Band - Length 20, source close and Standard dev 2
The setting for the SMA is length 10 and the high and low calculated or that length to form a channel.
The SMA Channel gives a green line for the Up channel and the Red line for the down Channel.
The basis of the indicator is that the Candle close above the Basis line of the BB and the SMA green line will give a buy indicator
and the same for Sell indicator the candle close below the basis BB and the SMA line Red will give a Sell indicator.
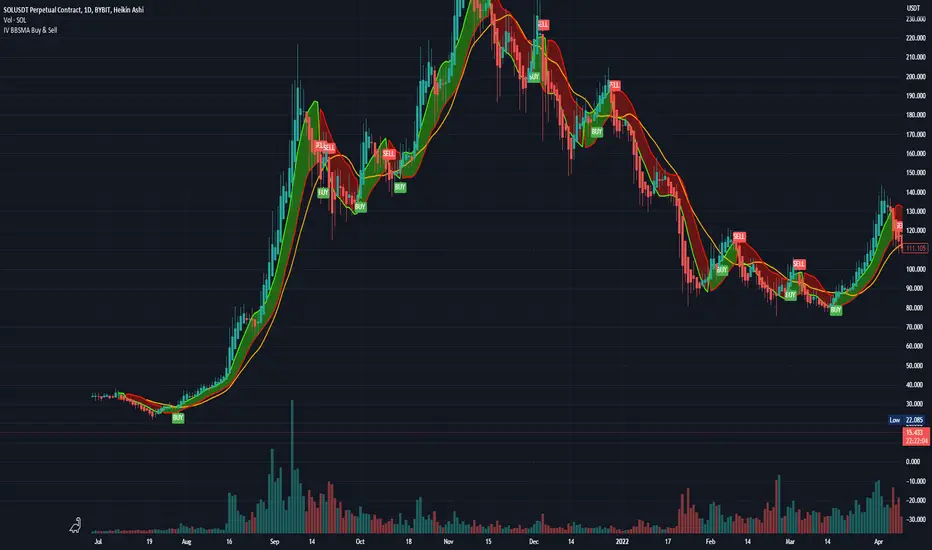
Please note that this indicator is a mix of 2 basic indicators found in Trading view, giving Buy and Sell indicators to make things easier to not look for this visually.
This code will be open source for anyone to use or back test or use it for whatever they want.
This code is for my own personal trading and cannot be relied upon. This indicator cannot be used and cannot guarantee anything, and caution should always be taken when trading. Use this with other indicators to give certanty.
Again use this for Paper Trading only.
I want to thank TradingView for its platform that facilitates development and learning.
在脚本中搜索"布林线boll指标使用详细讲解"
Ignition Band Angles are Bollinger Bands with numeric angleI developed Bollinger Bands that provide a numeric value indicating their strength. To achieve this, I used the degree of the angle of attack and color-coded the numbers. The top band displays the number in the upper corner of the chart, the bottom band in the bottom corner, and the Basis is in the left middle. These numbers quantify the slope of the bands, which can be difficult to discern on a chart because stretching out the x and y axis can flatten or exaggerate a slope. With my Bollinger Bands, you get a constant reading that provides an accurate measurement of the angle and strength of a trend. I hope this helps.

Bollinger Bands SignalsDescription:
This indicator works well in trendy markets on long runs and in mean-reverting markets, at almost any timeframe.
That said, higher timeframes are much preferred for their intrinsic ability to cut out noise. The example chart is in 3H TF.
Be mindful, the script shows somewhat erratic jigsaw-like behaviour during consolidation periods when the price
jumps up and down in indecision which way to go. Fortunately, there are scripts out there that detect such periods.
You can choose between 4 Moving Averages, Vidya being the default. Period, Deviation and Bands Width parameters
all of them affect the signal generation.
For the Pine Script coder this script is pretty obvious.
It uses a standard technical analysis indicator - Bollinger Bands - and appends it with a 'width' parameter and
a signal generation procedure.
The signal generation procedure is the heart of this script that keeps the script pumping signals.
The BB width is used as a filter.
You can use this procedure in your own scripts and it will continue generate signals according to your rules.

Currency Strength by Bollinger BandsOVERVIEW
This indicator is a currency strength by bollinger band.
CONCEPTS
- The currency strength of the passage is determined by each deviation of the Bollinger Bands.
- Wins if price is above MA, ±1σ, ±2σ. Mark is "○".
- Lose if price is below MA, ±1σ, ±2σ. Mark is "●".
- Display up to 9 currency combinations
- Support for bar indexes other than the latest

[KL] Bollinger bands + RSI StrategyThis strategy is based on two of my previous scripts, one called “RSI14 + 10”; the other one called “Bollinger Bands Consolidation”. At its core, it combines the main setups from each of those two scripts but excludes the auxiliary features that were considered as experimental. This strategy will identify periods of squeeze, and then enter long during consolidation with a trailing stop loss set.
Primary indicator will be the Bollinger Bands. By comparing the width of the BBs with the ATR of the same lookback period (i.e. 2 standard deviations of the 20 recent closing prices vs ATR(20) x2), we begin to look for confirmation for entry whenever the standard deviation of prices is less than the ATR. This can be seen visually in the plots (i.e. default gray lines representing ATRx2 relative to BB center line).
Confirmation for entry will be the RSIs (slow-14, and fast-10). If both are upward sloping, then we assume prices are in an uptrend and may eventually break above upper band. RSIs are typically in mid-range when prices are consolidating, therefore no need to measure it.
Exits will happen in two cases, (1) when trailing stop loss hits, or (2) when RSIs signal that the instrument is overbought. No. 1 is self-explanatory. No. 2 happens, when RSI14 reaches above 70 (can be changed), followed by RSI10 catching up and surpassing RSI14.

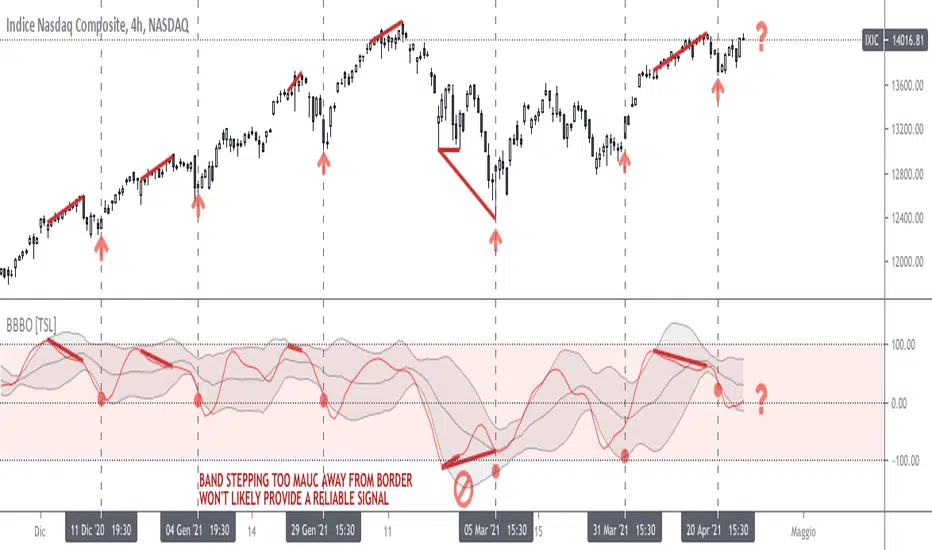
Bollinger on Bollinger OscillatorThis study is a user-friendly workaround to the BBOE+ (attached at the bottom).
I applied Bollinger Bands on BB Oscillator which spend his time bouncing between +100 -100 levels both representing extremes market conditions. You can use it to spot reliable entries/exits opportunities.
During an uptrend when the oscillator tends to -100 and the lower BB turn up you should consider a BUY. Do the same thing when the oscillator pushes under the lower BB nearby the Zero Line.
Make the opposite during a downtrend.
Also look for divergencies that occurs nearby the borders and BB squeezes too.
You can vary both the lenght for the Oscillator and BB.
Use “Upper Multiplier” and “Lower Multiplier” to set two different StDev from the basis (if you need).
You may also consider to apply an offset to the BB.
Is up to you to match the configuration that better-fits your market and time frame.
Default settings could well fits this IXIC 4H Chart.
So that this is basically a price-based indicator you would better consider to pair it with a volume-based or an absolute-momentum-based one.
SHARING IS INTENDED FOR EDUCATIONAL PURPOSE ONLY. NOT FOR PROFESSIONAL USE.
WILL APPRECIATE ANY FEEDBACK, QUESTION, SUGGESTION. (*)
(*) Please don’t ask me for “magic-setting” that do not exit, nor for “kaleidoscopic effects” cause I’m a big fan of such a minimalistic yet profession layouts.
FOLLOW UP TO CHECK UPDATES!
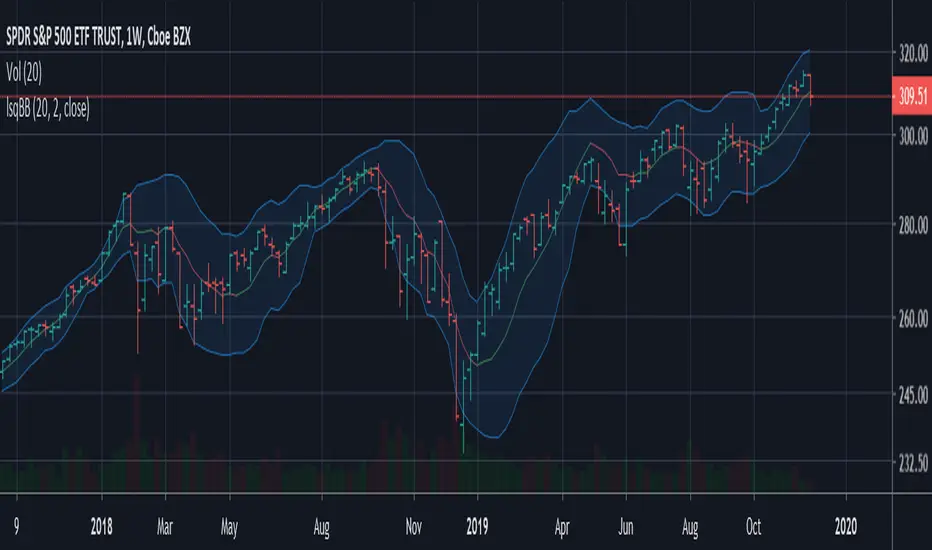
Bollinger DCA v1Simple "benchmark" strategy for ETFs, Stocks and Crypto! Super-easy to implement for beginners, a BTD (buy-the-dip) strategy means that you buy a fixed amount of an ETF / Stock / Crypto every time it falls. For instance, to BTD the S&P 500 ( SPY ), you could purchase $500 USD each time the price falls. Assuming the macro-economic conditions of the underlying country remain favourable, BTD strategies will result in capital gains over a period of many years, e.g. 10 years.
Recommended Chart Settings:
Asset Class: ETF / Stocks / Crypto
Time Frame: H1 (Hourly) / D1 (Daily) / W1 (Weekly) / M1 (Monthly)
Necessary ETF Macro Conditions:
1. Country must have healthy demographics, good ratio of young > old
2. Country population must be increasing
3. Country must be experiencing price-inflation
Necessary Stock Conditions:
1. Growing revenue
2. Growing net income
3. Consistent net margins
4. Higher gross/net profit margin compared to its peers in the industry
5. Growing share holders equity
6. Current ratios > 1
7. Debt to equity ratio (compare to peers )
8. Debt servicing ratio < 30%
9. Wide economic moat
10. Products and services used daily, and will stay relevant for at least 1 decade
Necessary Crypto Conditions:
1. Honest founders
2. Competent technical co-founders
3. Fair or non-existent pre-mine
4. Solid marketing and PR
5. Legitimate use-cases / adoption
Default Robot Settings:
Contribution (USD): $500
When: Dips below lower Bollinger Band
*Robot buys $500 worth of ETF , Stock, Crypto, every time price falls below the lower Bollinger Band
*Equity curve can be seen from the bottom panel*
Risk Warning:
This strategy is low-risk, however it assumes you have a long time horizon of at least 5 to 10 years. The longer your holding-period, the better your returns. The only thing the user has to keep-in-mind are the macro-economic conditions as stated above. If unsure, please stick to ETFs rather than buying individual stocks or cryptocurrencies.

Bollinger Band Color BarsThis is a simple addition to the built in Bollinger Bands script. All it does is replaces the traditional plotting of Bollinger Bands with color bars.

Volume Weighted Bollinger Bands 出来高加重ボリンジャーバンドIt is a volume-weighted index of Bollinger Bands.
The central line is vwma so it's quite responsive
The standard deviation is also volume weighted
Charts without volume are not weighted with volume as 1.
It seems that the usage in trading is the same as the Bollinger band
ボリンジャーバンドを出来高加重した指標です
中央線はvwma出来高加重移動平均なのでかなり反応が良いです
標準偏差も出来高加重してしています
出来高の無いチャートは出来高を1として加重しないようにしています
トレードでの使い方はボリンジャーバンドと同じで良いと思われます

Bollinger Channels / EMA and SMAThis is written as a system to replace the BB strategy.
I think it will work well.
It looks pretty stylish.
Description / Usage:
Adjust the length and multiplier based on your location with Bollinger Bands.
The multiplier of 1 provides you with a basic channel with high and low-source EMA (or SMA).
And with the 8-day exponential moving average, you can observe short entries and exits.
I wish good luck to the friends who will use it.
You can support and track new indicators.
Bu, BB stratejisinin yerini alacak bir sistem olarak yazılmıştır.
Oldukça şık görünüyor.
Kullanım
Bollinger Bantları ile bulunduğunuz yere göre uzunluk ve çarpanı ayarlayın.
1 çarpanı size yüksek ve düşük kaynaklı EMA (veya SMA) içeren temel bir kanal sağlar.
Ve 8 günlük üstel hareketli ortalama ile kısa giriş ve çıkışları gözlemleyebilirsiniz.
Kullanacak arkadaşlara bol kazançlar diliyorum.
Yeni indikatör için destek olabilir ve takip edebilirsiniz.

Keltner | Bollinger | SqueezePercent B (%B), it's derivation Percent K (%K) and squeeze indicator combined in one.
blue line = bollinger %
orange line = keltner %
red background = squeeze*
squeeze = bollinger bands are inside (encapsulated by) keltner channel

Bollinger Bands on MacdOnly longs when Macd line is above Bollinger Band and shorts when Macd line is above Bollinger Band, this will avoid many problems.
thumbs up!!!

Least Squares Bollinger BandsSimilar to Bollinger Bands but adjusted for momentum. Instead of having the centerline be a simply moving average and the bands showing the rolling variance, this does a linear regression, and shows the LSMA at the center, while the band width is the average deviation from the regression line instead of from the SMA.
This means that unlike for normal Bollinger bands, momentum does not make the bands wider, and that the bands tend to be much better centered around the price action with band walks being more reliable indicators of undersold/oversold conditions. They also give a much narrower estimate of current volatility/price range.
Multi Timeframe Bollinger BandsMulti Timeframe Bollinger Bands:
This script calculates and displays the Bollinger Bands for three different timeframes. The timeframes, moving averages and sigma values can be adjusted to personal likings. I publish this with an open visibility, feel free to tinker with it or suggest improvements.
Enjoy,
s0ullight

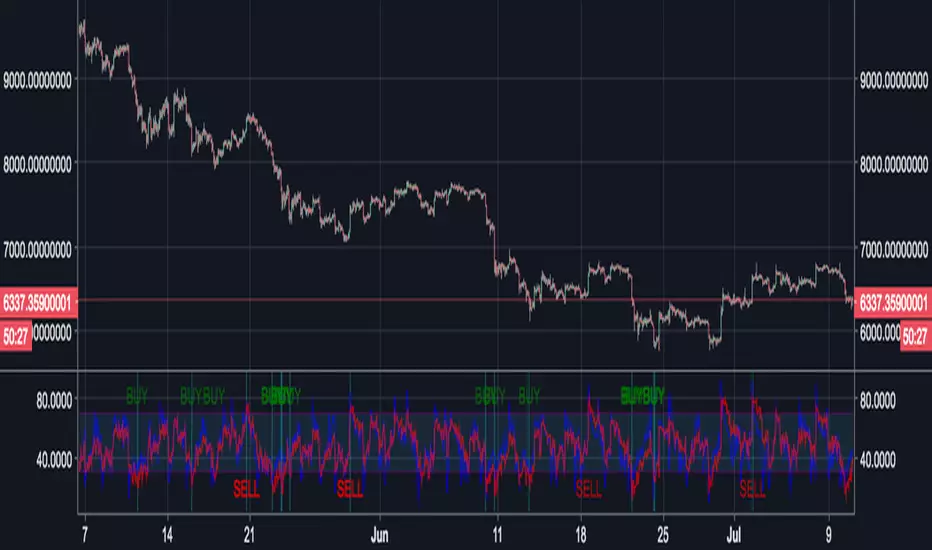
Bollinger Bands %bb (normalised) & RSIIndicator for displaying both Bollinger Bands %bb (normalised) and RSI simultaneously (Usual 0 - 1 range of BB normalised to the 30 - 70 range of RSI).
When both Bollinger Bands %bb and RSI are OB/OS then the column will turn blue and a buy/sell arrow will appear in the indicator provided other conditions pertaining to the OB/OS condition in one of the last two candles are also met.
I use this mainly for Cryptocurrencies for shorter time periods to indicate possible trade opportunities.
You could also set an alert on the arrow indicator appearing to auto trade.
[f(x)] Bollinger Donchian RemixThis is my version of a mixture of Bollinger and Donchian (BB/DC Remix)
It is a modified fork of Dolchian/Bollinger Hybrid by Ricardo Santos ( DBH.V0)
this is the two pictures comparing it.
Made this Fork because Santos' code starts getting chopping with my type of settings.
His time input is 24, but mine varies between 13 and 21.
You really notice in scalping and sometimes intraday timeframes with my settings.
His also differ from mine based on the trendline, where he modifies his Simple Moving Average, which is default color is black, and I use the the default one, which the default color is red.
Also you can change the trendline type input (open,close,hl2,etc...) to tailor your preference.
Note: Default is close, Santos use hl2, I use ohlc4.

RSI Bollinger BandsThis RSI indicator has a Bollinger Bands indicator around it, and a simple moving average.
I still haven't decided yet if the Bollinger Bands should be at 20 (like normal) or at 14 (like the RSI).
Experiment with it and have fun :)

4EMA (8,13,21,55) + Bollinger BandsFive indicators in one.
4 Moving Average Exponential : 8, 13, 21, 55 - as per @Philakone strategy
Bollinger Bands
Check out my other scripts for RSI and Stoch RSI all in one, and 4EMA + Death Cross + Bollinger Bands.

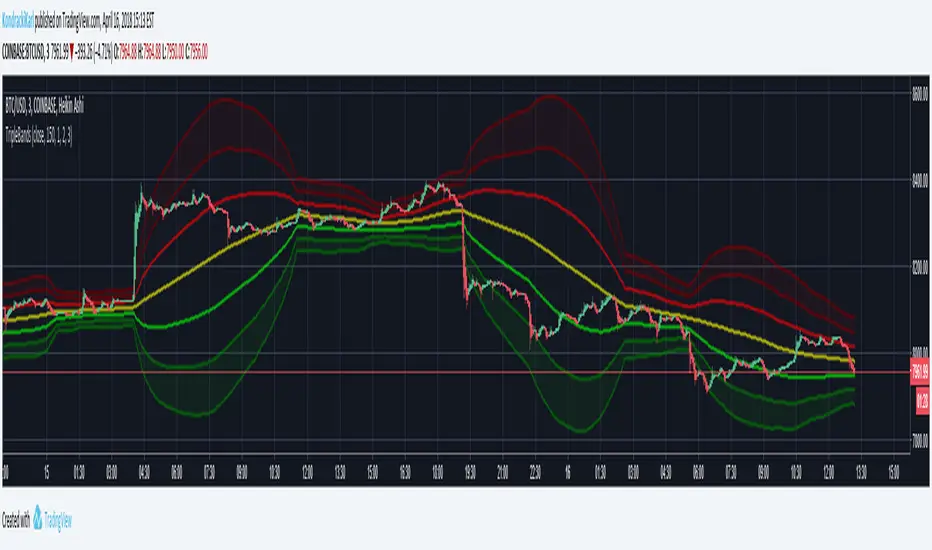
Triple Bollinger BandsTriple Bollinger Bands by Karl Kondracki
Hopefully this script can be of use.
Personally I really enjoy the reliability of Bollinger Bands set to a longer moving average.
Adding two extra deviation settings on the set of bands with the longer ma setting helps to easily show trends.
I tried to make the set as easy to see without drawing attention from other information.
The settings are intended to be as adjustable as possible while keeping things basic.
Hull Moving Average + Bollinger BandsThis study make use of Hull Moving Average and Bollinger Bands.
The crosses give signal about HMA and BB crossovers, they are a bit lagging, if you stare well you will spot them a little earlier. It look like a good idea to buy and sell when HMA is near or on the outside of the outer bands.
By default the Bollinger Bands uses Simple Moving Average with 21 periodes, and Hull Moving Average use 9 periodes. You can alter the settings in the format dialog.
Please use as pleased, and if you do something clever with it I'll be happy to know :D

Bollinger Bands Width with AlertsStandard Bollinger Band Width indicator with some convenience alerts -- please only use these alerts in conjunction with the alert-type "Once per Bar Close" in order to avoid premature (false) signals!
Alerts provided:
- bbw has rounded (started to decrease after period of rising)
- bbw has started rising (after a period of falling)
Many thanks again to J. Bollinger for his indicators and efforts in education.

Bollinger Bands V2 [Super Trend]################################## Anglais ######################################
With the News Bollinger Bands V2 , you can choose the source of the color (Color with Price or Color with the Super Trend ATR).
You can also view the Super Trend on the chart and the configure.
this allows you to quickly identify trends and the acceleration phase and accumulation
Sorry for my basic English
//J.Dow
################################## Français ######################################
Avec les Nouvelles Bollinger Bands V2 , vous pouvez choisir la source de la couleur ( couleur avec le prix ou la couleur avec le Super Tendance ATR ) .
Vous pouvez aussi consulter le Super Tendance sur le graphique et le configure.
cela vous permet d'identifier rapidement les tendances et la phase d'accélération et d'accumulation
//J.Dow

Bollinger Band ribbonThis indicator plots 9 upper and lower lines with increasing length. Lines are 0.618 upper and lower level of Bollinger band.