在脚本中搜索"布林线boll指标使用详细讲解"


Bollinger Bands - Breakout StrategyThe Bollinger Bands - Breakout Strategy is a trend-following optimized for short-term trading in the crypto market. This strategy employs the Bollinger Bands, a widely recognized technical indicator, as its primary instrument for pinpointing potential trades. It is capable of executing both long and short positions, depending on whether the market is in a spot or futures, and is particularly effective in trending markets.
The strategy boasts a high degree of configurability, allowing users to set the Bollinger Bands period and deviation, trend filter, volatility filter, trade direction filter, rate of change filter, and date filter. Furthermore, it offers options for Take Profit, Stop Loss, and Trailing Stop for both long and short positions, ensuring a comprehensive risk management approach. The inclusion of a maximum intraday loss feature adds another layer of protection, making this strategy a valuable tool for traders seeking a professional and adaptable trading system.
Name : Bollinger Bands - Breakout Strategy
Category : Trend Follower based on Bollinger Bands
Operating mode : Long and Short on Futures or Long on Spot
Trade duration : Intraday
Timeframe : 2H, 3H, 4H, 5H
Market : Crypto
Suggested usage : Trending Markets
Entry : When the price crosses above or below the Bollinger Bands
Exit : Opposite Cross or Profit target, Trailing stop or Stop loss
Configuration :
- Bollinger Bands period and deviation
- Trend Filter
- Volatility Filter
- Trade direction filter
- Rate of Change filter
- Date Filter (for backtesting purposes)
- Take Profit, Stop Loss and Trailing Stop for long and short positions
- Risk Management: Max Intraday Loss
Backtesting :
⁃ Exchange: BINANCE
⁃ Pair: BTCUSDT.P
⁃ Timeframe: 4H
⁃ Fee: 0.025%
⁃ Slippage: 1
- Initial Capital: 10000 USDT
- Position sizing: 10% of Equity
- Start : 2019-09-19 (Out Of Sample from 2022-12-23)
- Bar magnifier: on
Credits :
- LucF of Pine Coders for f_security function to avoid repainting using security.
- QuantNomad for Monthly Table.
Disclaimer : Risk Management is crucial, so adjust stop loss to your comfort level. A tight stop loss can help minimise potential losses. Use at your own risk.
How you or we can improve? Source code is open so share your ideas!
Leave a comment and smash the boost button!
Thanks for your attention, happy to support the TradingView community.

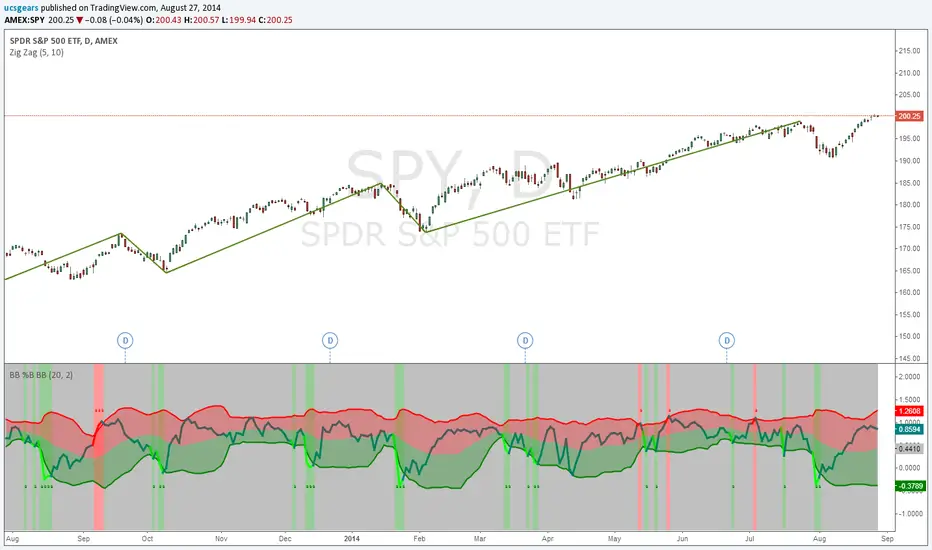
Bollinger Bands %B Bollinger Bands - Version 2Thanks to Chris Moody for his touch
List of All my Indicators - www.tradingview.com
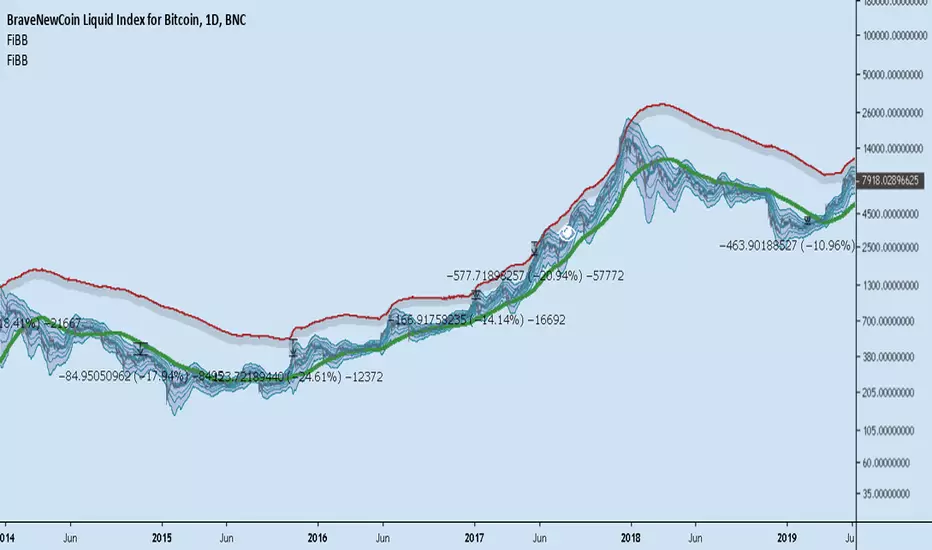
Bollinger Fanboy v3.0I can't be help liable for any losses suffered from the use of this script. Use at your own risk.

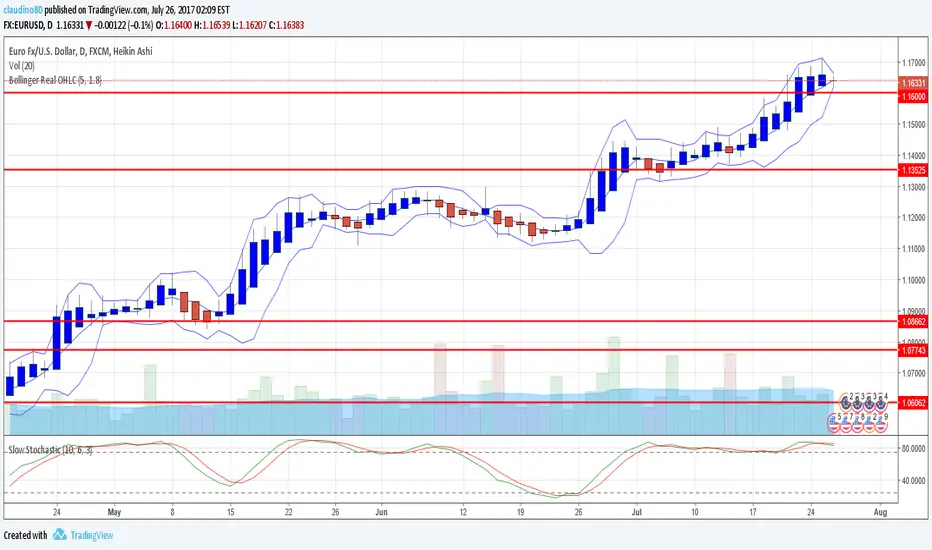
Bollinger Real OHLCThis uses the real OHLC not the one of the chart (useful for not standard chat like Heikin Ashi).
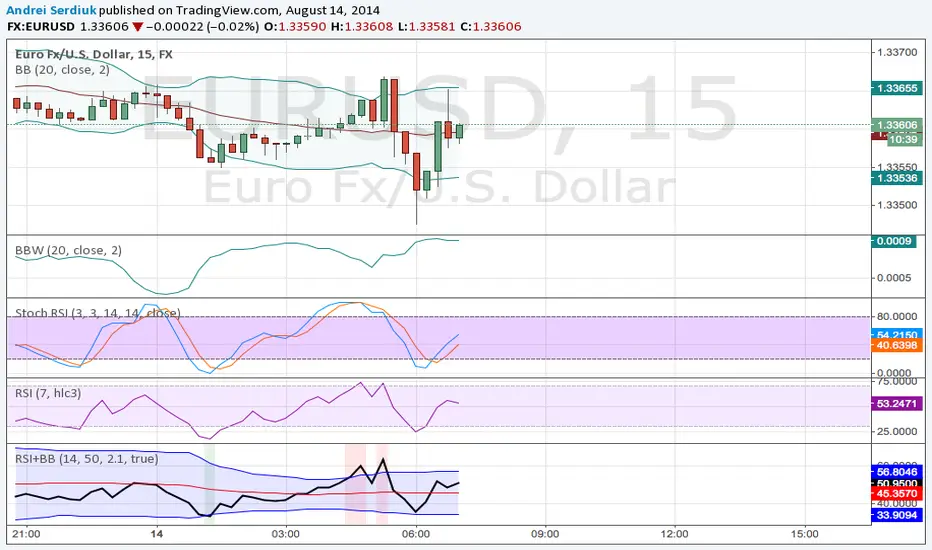
custom Bollinger bands with filters - indicator (AS)-----------Description-------------
This indicator is basically Bollinger bands with many ways to customize. It uses highest and lowest values of upper and lower band for exits. I think something is wrong with the script but cant find any mistakes – most probably smoothing. The ATR filter is implemented but is working incorrectly. In code you can also turn it into strategy but I do not recommend it for now as it is not ready yet.
So this is my first script and I am looking for any advice, ideas to improve this script, sets of parameters, markets to apply, logical mistakes in code or any ideas that you may have. Indicator was initially designed for EURUSD 5MIN but I would be interested in other ideas.
-----------SETTINGS--------------
---START - In starting settings we can choose
Line 1: what parts to use BB/DC/ATR
Line 2: what parts to plot on chart
Line 3 Whether or not apply smoothing to BB or ATR filter
Line 4 Calculate deviation for BB from price or Moving average
Line 5 Fill colors and plot other parts for debug (overlay=false)
Line 6:( for strategy) – enable Long/Short Trades
---BB and DC – here we modify Bollinger bands and Donchian
Line 1: Length and type of BB middle line and also length of DC from BB
Line 2: Length and type of BB standard deviation and multiplier
Line 3: Length and type of BB smoothing and %width for BB filter
---ATR filter – (not ready fully yet)
Line 1: type and length of ATR
Line 2: threshold and smoothing value of ATR
---DATE and SESSION
Line 1: apply custom date or session?
Line 2: session hours settings
Line 3:Custom starting date
Line 4: Custom Ending date
-----------HOW TO USE--------------
We open Long if BB width is bigger than threshold and close when upper band is no longer highest in the period set. Exact opposite with Short

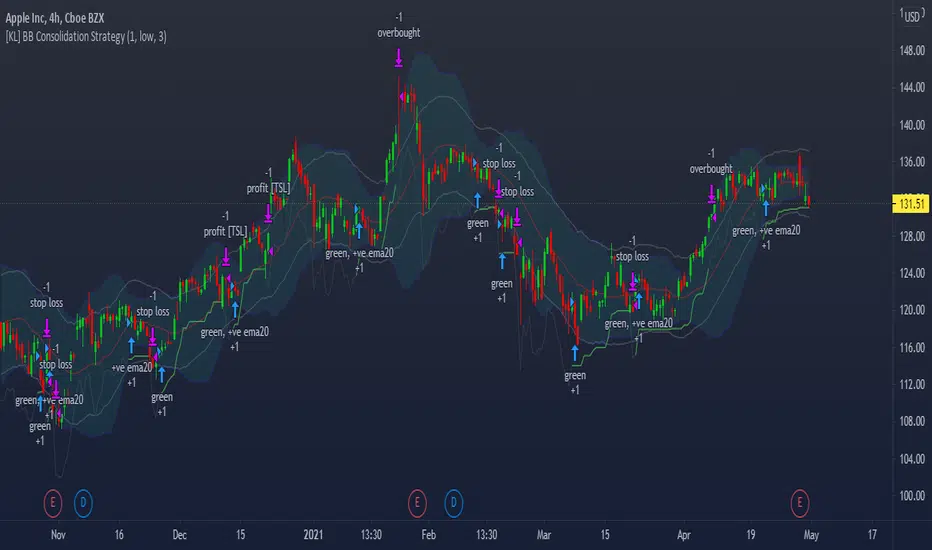
[KL] Bollinger Bands Consolidation StrategyThis strategy will enter into long position based on the volatility of prices implied by indicators of (a) Bollinger bands, and (b) ATR.
Application of Bollinger bands ("BOLL")
Using plain vanilla settings for BOLL (i.e. 20 period moving average, and 2 standard deviations of closing prices), we are interested to know about the shape of the area that is bounded by the upper and lower bands.
In theory, consolidation happens when volatility of price decreases. Visually speaking, this is represented by the narrowing of the upper/lower bands. This strategy considers the narrowing of BOLL bands as the primary indicator for long-entry.
Application of ATRs (as confirmations)
Firstly, to confirm that BOLL bands are narrowing (as mentioned above), the ATR at a potential point of entry is compared against the standard deviation of prices over BOLL's lookback periods. Once again, visualizing the shape of BOLL bands during consolidation, we assume the lines begin to squeeze when the distance between the center line and upper/lower band is less than two current ATRs.
Secondly, this strategy looks into the moving average of ATRs to assure that prices are not too choppy when entering into market. If the moving average of ATR decreases at a point in time such that all the above conditions are met, then we can assert that the volatility of price is decreasing.
Thirdly, ATR is used for determining the size of our trailing stop loss. We will keep the multiplier fixed at two.
Bollinger Band BreakoutIt is a long only strategy.
1. Buy when price breaks out of the upper band.
2. Exit has two options. Option 1 allows you to exit using lower band. Option 2 allows you to exit using moving average.
3. Option 1 preferred over option 2 if the instrument is highly volatile.
4. Slippage and commissions are not considered in the return calculation.

ViVen-Multi Time Frame Bollinger Band StrategyThis indicator created to identify the strong Support and Resistance levels based on the Bollinger Bands. When two different time frame Bollinger Bands are travelling together then its a strong Support or Resistance Levels.
I have added 5 Min, 15 Min, 30 Min, 1 Hr and 1 Day time frame Bollinger Bands in one Chart. You can select and combine whichever the TF you want.
Default values considered - Period - 20 and Std.Dev is 2
You can on/off the indicator based on the requirement.
Trade plan:
BUY - When price comes near to the Bottom Bollinger Band level (look for candle confirmation is plus). If multiple Bollinger bands travels together then is Strong Support. (Exit if Price Breaks down the BB)
SELL - When price reaches the Upper Bollinger Band level (look for candle confirmation is plus). If multiple Bollinger bands travels together then is Strong Support. (Exit if Price Breaks Up the BB)
Middle Line - is the 20 SMA line
When the Gap between Upper and Lower Band is narrow then we can expect a trending movement soon.

two BollingersThe Double Bollinger Band consists of an average and two Bollingers and two backgrounds, each of which has separate settings and can be approved more strongly for trades. Moves and vice versa. With the price chart coming out of the second band, the price is much more likely to move in the same direction.
To use this feature, we had to use two Bollinger indicators with different settings at the same time, but we no longer need to do this with the Double Bollinger .
Its main use is crypto, but it can be used in all markets

John Bollinger's Bollinger BandsJapanese below / 日本語説明は下記
This indicator replicates how John Bollinger, the inventor of Bollinger Bands, uses Bollinger Bands, displaying Bollinger Bands, %B and Bandwidth in one indicator with alerts and signals.
Bollinger Bands is created by John Bollinger in 1980s who is an American financial trader and analyst. He introduced %B and Bandwidth 30 years later.
🟦 What's different from other Bollinger Bands indicator?
Unlike the default Bollinger Bands or other custom Bollinger Bands indicators on TradingView, this indicator enables to display three Bollinger Bands tools into a single indicator with signals and alerts capability.
You can plot the classic Bollinger Bands together with either %B or Bandwidth or three tools altogether which requires the specific setting(see below settings).
This makes it easy to quantitatively monitor volatility changes and price position in relation to Bollinger Bands in one place.
🟦 Features:
Plots Bollinger Bands (Upper, Basis, Lower) with fill between bands.
Option to display %B or Bandwidth with Bollinger Bands.
Plots highest and lowest Bandwidth levels over a customizable lookback period.
Adds visual markers when Bandwidth reaches its highest (Bulge) or lowest (Squeeze) value.
Includes ready-to-use alert conditions for Bulge and Squeeze events.
📈Chart
Green triangles and red triangles in the bottom chart mark Bulges and Squeezes respectively.
🟦 Settings:
Length: Number of bars used for Bollinger Band middleline calculation.
Basis MA Type: Choose SMA, EMA, SMMA (RMA), WMA, or VWMA for the midline.
StdDev: Standard deviation multiplier (default = 2.0).
Option: Select "Bandwidth" or "%B" (add the indicator twice if you want to display both).
Period for Squeeze and Bulge: Lookback period for detecting the highest and lowest Bandwidth levels.(default = 125 as specified by John Bollinger )
Style Settings: Colors, line thickness, and transparency can be customized.
📈Chart
The chart below shows an example of three Bollinger Bands tools: Bollinger Band, %B and Bandwidth are in display.
To do this, you need to add this indicator TWICE where you select %B from Option in the first addition of this indicator and Bandwidth from Option in the second addition.
🟦 Usage:
🟠Monitor Volatility:
Watch Bandwidth values to spot volatility contractions (Squeeze) and expansions (Bulge) that often precede strong price moves.
John Bollinger defines Squeeze and Bulge as follows;
Squeeze:
The lowest bandwidth in the past 125 period, where trend is born.
Bulge:
The highest bandwidth in the past 125 period where trend is going to die.
According to John Bollinger, this 125 period can be used in any timeframe.
📈Chart1
Example of Squeeze
You can see uptrends start after squeeze(red triangles)
📈Chart2
Example of Bulge
You can see the trend reversal from downtrend to uptrends at the bulge(green triangles)
📈Chart3
Bulge DOES NOT NECESSARILY mean the beginning of a trend in opposite direction.
For example, you can see a bulge happening in the right side of the chart where green triangles are marked. Nevertheless, uptrend still continues after the bulge.
In this case, the bulge marks the beginning of a consolidation which lead to the continuation of the trend. It means that a phase of the trend highlighted in the light blue box came to an end.
Note: light blue box is not drawn by the indicator.
Like other technical analysis methods or tools, these setups do not guarantee birth of new trends and trend reversals. Traders should be carefully observing these setups along with other factors for making decisions.
🟠Track Price Position:
Use %B to see where price is located in relation to the Bollinger Bands.
If %B is close to 1, the price is near upper band while %B is close to 0, the price is near lower band.
🟠Set Alerts:
Receive alerts when Bandwidth hits highest and lowest values of bandwidth, helping you prepare for potential breakout, ending of trends and trend reversal opportunities.
🟠Combine with Other Tools:
This indicator would work best when combined with price action, trend analysis, or
market environmental analysis.
—————————————————————————————
このインジケーターはボリンジャーバンドの考案者であるジョン・ボリンジャー氏が提唱するボリンジャーバンドの使い方を再現するために、ボリンジャーバンド、%B、バンドウィズ(Bandwidth) の3つを1つのインジケーターで表示可能にしたものです。シグナルやアラートにも対応しています。
ボリンジャーバンドは1980年代にアメリカ人トレーダー兼アナリストのジョン・ボリンジャー氏によって開発されました。彼はその30年後に%Bとバンドウィズを導入しました。
🟦 他のボリンジャーバンドとの違い
TradingView標準のボリンジャーバンドや他のボリンジャーバンドとは異なり、このインジケーターでは3つのボリンジャーバンドツールを1つのインジケーターで表示し、シグナルやアラート機能も利用できるようになっています。
一般的に知られている通常のボリンジャーバンドに加え、%Bやバンドウィズを組み合わせて表示でき、設定次第では3つすべてを同時にモニターすることも可能です。これにより、価格とボリンジャーバンドの位置関係とボラティリティ変化をひと目で、かつ定量的に把握することができます。
🟦 機能:
ボリンジャーバンド(アッパーバンド・基準線・ロワーバンド)を描画し、バンド間を塗りつぶし表示。
オプションで%Bまたはバンドウィズを追加表示可能。
バンドウィズの最高値・最安値を、任意の期間で検出して表示。
バンドウィズが指定期間の最高値(バルジ※)または最安値(スクイーズ)に達した際にシグナルを表示。
※バルジは一般的にボリンジャーバンドで用いられるエクスパンションとほぼ同じ意味ですが、定義が異なります。(下記参照)
バルジおよびスクイーズ発生時のアラート設定が可能。
📈 チャート例
下記チャートの緑の三角と赤の三角は、それぞれバルジとスクイーズを示しています。
🟦 設定:
Length: ボリンジャーバンドの基準線計算に使う期間。
Basis MA Type: SMA, EMA, SMMA (RMA), WMA, VWMAから選択可能。
StdDev: 標準偏差の乗数(デフォルト2.0)。
Option: 「Bandwidth」または「%B」を選択(両方表示するにはこのインジケーターを2回追加)。
Period for Squeeze and Bulge: Bandwidthの最高値・最安値を検出する期間(デフォルトはジョン・ボリンジャー氏が推奨する125)。
Style Settings: 色、線の太さ、透明度などをカスタマイズ可能。
📈 チャート例
下のチャートは「ボリンジャーバンド」「%B」「バンドウィズ」の3つを同時に表示した例です。
この場合、インジケーターを2回追加し、最初に追加した方ではOptionを「%B」に、次に追加した方では「Bandwidth」を選択します。
🟦 使い方:
🟠 ボラティリティを監視する:
バンドウィズの値を見ることで、価格変動の収縮(スクイーズ)や拡大(バルジ)を確認できます。
これらはしばしば強い値動きの前兆となります。
ジョン・ボリンジャー氏はスクイーズとバルジを次のように定義しています:
スクイーズ: 過去125期間の中で最も低いバンドウィズ→ 新しいトレンドが生まれる場所。
バルジ: 過去125期間の中で最も高いバンドウィズ → トレンドが終わりを迎える場所。
この「125期間」はどのタイムフレームでも利用可能とされています。
📈 チャート1
スクイーズの例
赤い三角のスクイーズの後に上昇トレンドが始まっているのが確認できます。
📈 チャート2
バルジの例
緑の三角のバルジの箇所で下降トレンドから上昇トレンドへの反転が見られます。
📈 チャート3
バルジが必ずしも反転を意味しない例
下記のチャート右側の緑の三角で示されたバルジの後も、上昇トレンドが継続しています。
この場合、バルジは反転ではなく「トレンド一時的な調整(レンジ入り)」を示しており、結果的に上昇トレンドが継続しています。
この場合、バルジは水色のボックスで示されたトレンドのフェーズの終わりを示しています。
※水色のボックスはインジケーターが描画したものではありません。
また、他のテクニカル分析と同様に、これらのセットアップは必ず新しいトレンドの発生やトレンド転換を保証するものではありません。トレーダーは他の要素も考慮し、慎重に意思決定する必要があります。
🟠 価格とボリンジャーバンドの位置関係を確認する:
%Bを利用すれば、価格がバンドのどこに位置しているかを簡単に把握できます。
%Bが1に近ければ価格はアッパーバンド付近、0に近ければロワーバンド付近にあります。
🟠 アラートを設定する:
バンドウィズが一定期間の最高値または最安値に到達した際にアラートを設定することで、ブレイクアウトやトレンド終了、反転の可能性に備えることができます。
🟠 他のツールと組み合わせる:
このインジケーターは、プライスアクション、トレンド分析、環境認識などと組み合わせて活用すると最も効果的です。

Dual Bollinger Band Mean ReversionSimple but solid mean reversion indicator with sl and tp levels. Most of the code is based on the built in bollinger bands script. Designed for scalping 1-5 minute timeframes.
The indicator consists of two sets of bollinger bands.
Price has to close below the lower (fast) bollinger band, above the moving average of the (slower) bollinger band.
If price now closes above the lower (fast) bb, the indicator draws a label at the open of the next candle (which would be a potential entry point). Take profit becomes the upper bollinger band, stop loss the same distance below the open of the candle.
I've built in a simple backtesting function that calculates the potential win/loss-ratio. Loss and profit levels are 1:1. Exit strategy could be improved on.
Adjusting the lengths depending on the asset proves to be a good idea.
The slower bollinger bands can help to identify ranging markets and/or trends following regular bollinger bands theory.
Feel free to comment with any changes that you'd like to be made.

Ichimoku Cloud and Bollinger Bands (by Coinrule)The Ichimoku Cloud is a collection of technical indicators that show support and resistance levels, as well as momentum and trend direction. It does this by taking multiple averages and plotting them on a chart. It also uses these figures to compute a “cloud” that attempts to forecast where the price may find support or resistance in the future.
The Ichimoku Cloud was developed by Goichi Hosoda, a Japanese journalist, and published in the late 1960s. It provides more data points than the standard candlestick chart. While it seems complicated at first glance, those familiar with how to read the charts often find it easy to understand with well-defined trading signals.
The Ichimoku Cloud is composed of five lines or calculations, two of which comprise a cloud where the difference between the two lines is shaded in.
The lines include a nine-period average, a 26-period average, an average of those two averages, a 52-period average, and a lagging closing price line.
The cloud is a key part of the indicator. When the price is below the cloud, the trend is down. When the price is above the cloud, the trend is up.
The above trend signals are strengthened if the cloud is moving in the same direction as the price. For example, during an uptrend, the top of the cloud is moving up, or during a downtrend, the bottom of the cloud is moving down.
The Bollinger Bands are among the most famous and widely used indicators. A Bollinger Band is a technical analysis tool defined by a set of trendlines plotted two standard deviations (positively and negatively) away from a simple moving average ( SMA ) of a security's price, but which can be adjusted to user preferences. They can suggest when an asset is oversold or overbought in the short term, thus providing the best time for buying and selling it.
This strategy combines the Ichimoku Cloud with Bollinger Bands to better enter trades.
Long orders are placed when these basic signals are triggered.
Long Position:
Tenkan-Sen is above the Kijun-Sen
Chikou-Span is above the close of 26 bars ago
Close is above the Kumo Cloud
The closing price is greater than the upper standard deviation of the Bollinger Bands
Short Position:
Tenkan-Sen is below the Kijun-Sen
Chikou-Span is below the close of 26 bars ago
Close is below the Kumo Cloud
The upper standard deviation of the Bollinger Band is greater than the closing price
The script is backtested from 1 January 2022 and provides good returns.
The strategy assumes each order is using 30% of the available coins to make the results more realistic and to simulate you only ran this strategy on 30% of your holdings. A trading fee of 0.1% is also taken into account and is aligned to the base fee applied on Binance.
This script also works well on BTC 30m/1h, ETH 2h, MATIC 2h/30m, AVAX 1h/2h, SOL 45m timeframes

Waddah Attar Explosion V3 [NHK] -Bollinger - MACDWaddah Attar Explosion Version3 indicator to work in Forex and Crypto, This indicator oscillates above and below zero and the Bollinger band is plotted over the MACD Histogram to take quick decisions, Colors are changed for enhanced look. dead zone is plotted in a background area and option is provided to hide dead zone. One can easily detect sideways market movement using Bollinger band and volume. when volume is in between Bollinger band no trades are to be taken as volume is low and market moving in sideways
credits to: @shayankm and @LazyBear
Read the main description below...
- - - - - - - - - - - - - - - - - - - - - - - - - - - - - - - - - - - - - - -
This is a port of a famous MT4 indicator. This indicator uses MACD /BB to track trend direction and strength. Author suggests using this indicator on 30mins.
Explanation from the indicator developer:
"Various components of the indicator are:
Dead Zone Line: Works as a filter for weak signals. Do not trade when the up or down histogram is in between Dead Zone.
Histograms:
- Pink histogram shows the current down trend.
- Blue histogram shows the current up trend.
- Sienna line / Bollinger Band shows the explosion in price up or down.
Signal for ENTER_BUY: All the following conditions must be met.
- Blue histogram is raising.
- Blue histogram above Explosion line.
- Explosion line raising.
- Both Blue histogram and Explosion line above DeadZone line.
Signal for EXIT_BUY: Exit when Blue histogram crosses below Explosion line / Bollinger Band.
Signal for ENTER_SELL: All the following conditions must be met.
- Pink histogram is raising.
- Pink histogram above Explosion line.
- Explosion line raising.
- Both Pink histogram and Explosion line above DeadZone line.
Signal for EXIT_SELL: Exit when Pink histogram crosses below Explosion line.
All of the parameters are configurable via options page. You may have to tune it for your instrument.

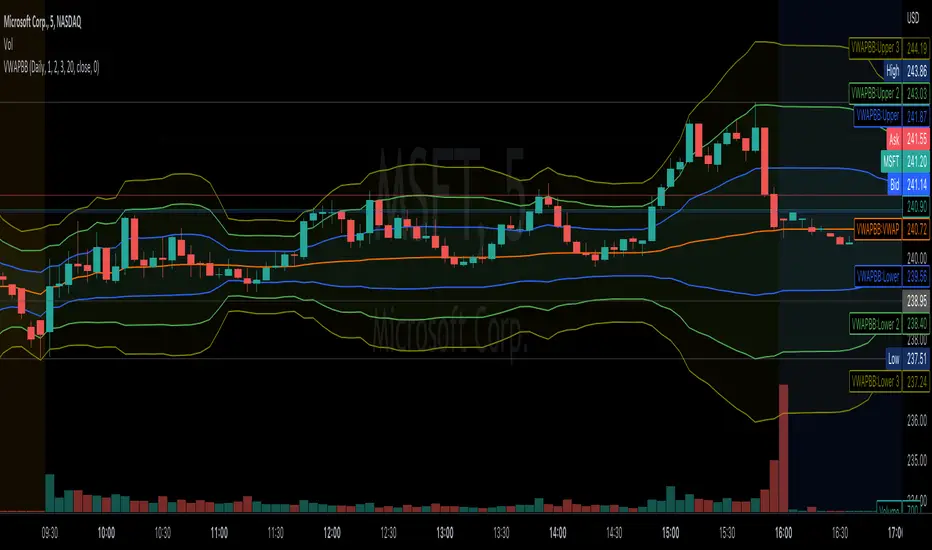
VWAP Bollinger BandsWhat makes this different from vwap bands / bollinger bands?
This indicator takes a bit of inspiration from bollinger but instead of utilizing built in pine script std dev that uses simple moving average internally, this version replaces that with vwap.
Also instead of traditional bollinger band basis of 20 period simple moving average, the basis here for the bands is the vwap.
How to use it?
Usage is similar to vwap itself, though the standard deviation bands will expand and contract like normal bollinger bands instead of vwap bands that just widen as the market movement continues. The bands tell a slightly different story from bollinger bands as the underlying data utilized is the vwap itself.
Which markets is this meant for?
Any market.
What conditions?
This aids in finding conditions of entry standard to vwap, but the bands could give key areas of focus for entries and exits better than standard bollinger bands or vwap bands.
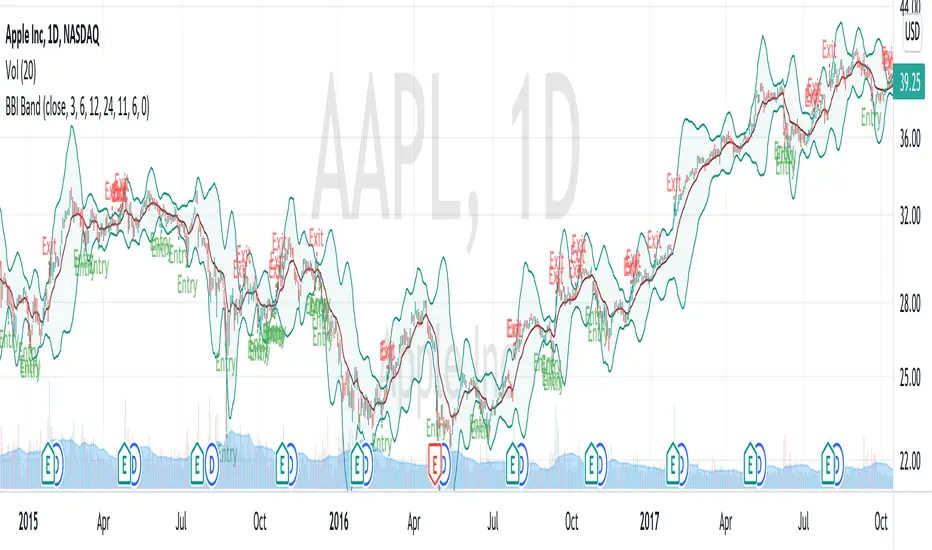
BBI Bollinger BandsBBI (Bull and Bear Index) is an indicator aims on measuring the general short/mid-term (< 1 month) trend and sentiment of the stock/market. It used an average of 4 SMAs (3, 6, 12, 24) as a cut-off of a bullish/bearish trend. In general, YMMV, you can enter when close> BBI and exit when close
BBSS - Bollinger Bands Scalping SignalsModified Bollinger Bands Indicator
Added:
- color change divergence (green) and narrowing (red) of the upper and lower bands
- color change of the moving average - upward trend (green) and downward trend (red)
- the appearance of a potential signal for long and short positions when the candle closes behind the upper or lower bands.
How to use the indicator:
Long conditions:
- the price breaks through the upper band
- Bollinger bands are expanding and should be green
- the mid-line is green
- the trigger candle should be green
Short conditions:
- the price breaks through the lower band
- Bollinger bands are expanding and should be red
- the mid-line is red
- the trigger candle should be red

Williams %R w/ Bollinger Bands [Loxx]Williams %R w/ Bollinger Bands is a Williams %R indicator with Bollinger bands. The Bollinger bands are used to determine when breakouts/breakdowns occur.
What is Williams %R?
Williams %R , also known as the Williams Percent Range, is a type of momentum indicator that moves between 0 and -100 and measures overbought and oversold levels. The Williams %R may be used to find entry and exit points in the market. The indicator is very similar to the Stochastic oscillator and is used in the same way. It was developed by Larry Williams and it compares a stock’s closing price to the high-low range over a specific period, typically 14 days or periods.
Included:
bar coloring
signals
alerts

Advanced Bollinger Bands StrategyAdvanced Bollinger Bands Strategy
Why is it an advanced Bollinger Bands Strategy?
The purpose of Bollinger Bands is to provide a relative definition of high and low prices of a market. By definition, prices are high at the upper band and low at the lower band. This definition can aid in rigorous pattern recognition and is useful in comparing price action to the action of indicators to arrive at systematic trading decisions. Adding a Moving Average filter which only allows trades if MA and Price are outside of the BB increases the probability of profitable trades with the sacrifice of a lower trade-frequency.
Inputs for Bollinger Bands
-> BB Source
-> BB Length
-> BB Multiplier
-> Moving Average Period
-> Moving Average Source
-> Strategy Condition Options:
-> Exit Trades if Price crosses Basis Line
-> Enable Moving Average Filter

Regression Fit Bollinger Bands [Spiritualhealer117]This indicator is best suited for mean reversion trading, shorting at the upper band and buying at the lower band, but it can be used in all the same ways as a standard bollinger band.
It differs from a normal bollinger band because it is centered around the linear regression line, as opposed to the moving average line, and uses the linear regression of the standard deviation as opposed to the standard deviation.
This script was an experiment with the new vertical gradient fill feature.
