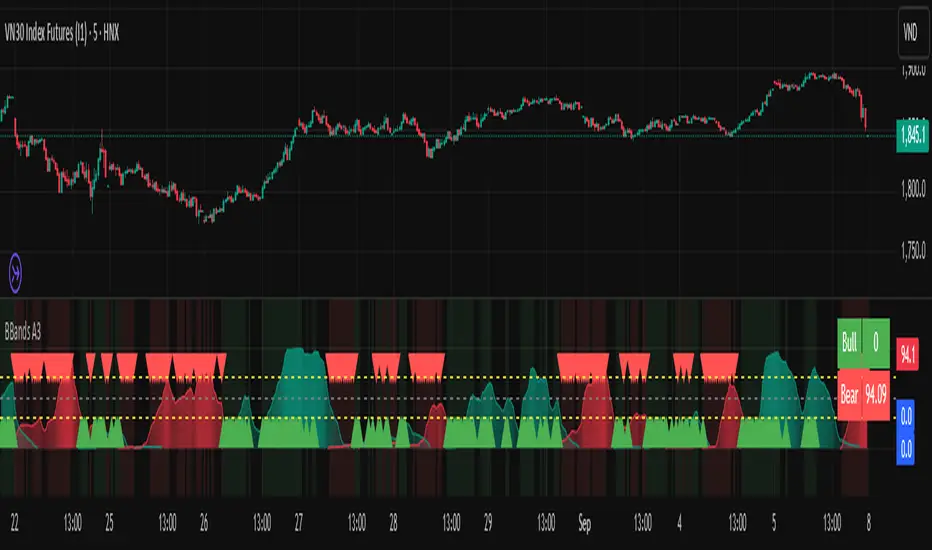
Bollinger Bands Entry/Exit ThresholdsBollinger Bands Entry/Exit Thresholds
Author of enhancements: chuckaschultz
Inspired and adapted from the original 'Bollinger Bands Breakout Oscillator' by LuxAlgo
Overview
Pairs nicely with Contrarian 100 MA
The Bollinger Bands Entry/Exit Thresholds is a powerful momentum-based indicator designed to help traders identify potential entry and exit points in trending or breakout markets. By leveraging Bollinger Bands, this indicator quantifies price deviations from the bands to generate bullish and bearish momentum signals, displayed as an oscillator. It includes customizable entry and exit signals based on user-defined thresholds, with visual cues plotted either on the oscillator panel or directly on the price chart.
This indicator is ideal for traders looking to capture breakout opportunities or confirm trend strength, with flexible settings to adapt to various markets and trading styles.
How It Works
The Bollinger Bands Entry/Exit Thresholds calculates two key metrics:
Bullish Momentum (Bull): Measures the extent to which the price exceeds the upper Bollinger Band, expressed as a percentage (0–100).
Bearish Momentum (Bear): Measures the extent to which the price falls below the lower Bollinger Band, also expressed as a percentage (0–100).
The indicator generates:
Long Entry Signals: Triggered when the bearish momentum (bear) crosses below a user-defined Long Threshold (default: 40). This suggests weakening bearish pressure, potentially indicating a reversal or breakout to the upside.
Exit Signals: Triggered when the bullish momentum (bull) crosses below a user-defined Sell Threshold (default: 80), indicating a potential reduction in bullish momentum and a signal to exit long positions.
Signals are visualized as tiny colored dots:
Long Entry: Blue dots, plotted either at the bottom of the oscillator or below the price bar (depending on user settings).
Exit Signal: White dots, plotted either at the top of the oscillator or above the price bar.
Calculation Methodology
Bollinger Bands:
A user-defined Length (default: 14) is used to calculate an Exponential Moving Average (EMA) of the source price (default: close).
Standard deviation is computed over the same length, multiplied by a user-defined Multiplier (default: 1.0).
Upper Band = EMA + (Standard Deviation × Multiplier)
Lower Band = EMA - (Standard Deviation × Multiplier)
Bull and Bear Momentum:
For each bar in the lookback period (length), the indicator calculates:
Bullish Momentum: The sum of positive deviations of the price above the upper band, normalized by the total absolute deviation from the upper band, scaled to a 0–100 range.
Bearish Momentum: The sum of positive deviations of the price below the lower band, normalized by the total absolute deviation from the lower band, scaled to a 0–100 range.
Formula:
bull = (sum of max(price - upper, 0) / sum of abs(price - upper)) * 100
bear = (sum of max(lower - price, 0) / sum of abs(lower - price)) * 100
Signal Generation:
Long Entry: Triggered when bear crosses below the Long Threshold.
Exit: Triggered when bull crosses below the Sell Threshold.
Settings
Length: Lookback period for EMA and standard deviation (default: 14).
Multiplier: Multiplier for standard deviation to adjust Bollinger Band width (default: 1.0).
Source: Input price data (default: close).
Long Threshold: Bearish momentum level below which a long entry signal is generated (default: 40).
Sell Threshold: Bullish momentum level below which an exit signal is generated (default: 80).
Plot Signals on Main Chart: Option to display entry/exit signals on the price chart instead of the oscillator panel (default: false).
Style:
Bullish Color: Color for bullish momentum plot (default: #f23645).
Bearish Color: Color for bearish momentum plot (default: #089981).
Visual Features
Bull and Bear Plots: Displayed as colored lines with gradient fills for visual clarity.
Midline: Horizontal line at 50 for reference.
Threshold Lines: Dashed green line for Long Threshold and dashed red line for Sell Threshold.
Signal Dots:
Long Entry: Tiny blue dots (below price bar or at oscillator bottom).
Exit: Tiny white dots (above price bar or at oscillator top).
How to Use
Add to Chart: Apply the indicator to your TradingView chart.
Adjust Settings: Customize the Length, Multiplier, Long Threshold, and Sell Threshold to suit your trading strategy.
Interpret Signals:
Enter a long position when a blue dot appears, indicating bearish momentum dropping below the Long Threshold.
Exit the long position when a white dot appears, indicating bullish momentum dropping below the Sell Threshold.
Toggle Plot Location: Enable Plot Signals on Main Chart to display signals on the price chart for easier integration with price action analysis.
Combine with Other Tools: Use alongside other indicators (e.g., trendlines, support/resistance) to confirm signals.
Notes
This indicator is inspired by LuxAlgo’s Bollinger Bands Breakout Oscillator but has been enhanced with customizable entry/exit thresholds and signal plotting options.
Best used in conjunction with other technical analysis tools to filter false signals, especially in choppy or range-bound markets.
Adjust the Multiplier to make the Bollinger Bands wider or narrower, affecting the sensitivity of the momentum calculations.
Disclaimer
This indicator is provided for educational and informational purposes only.
在脚本中搜索"布林线boll指标使用详细讲解"

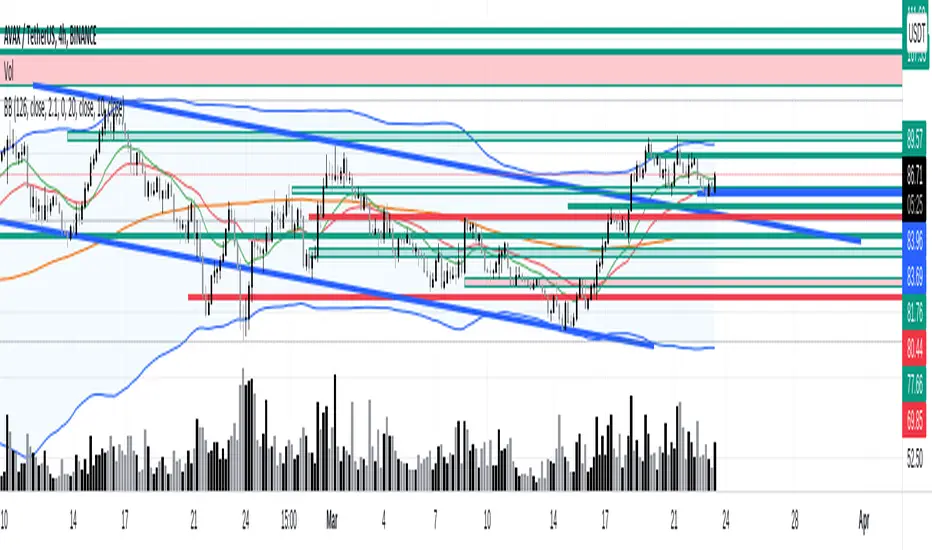
Bollinger Bands [LePasha]Bollinger Bands : Advanced Volatility Analysis Made Simple
Discover a refined take on Bollinger Bands that offers clearer market insights and deeper volatility understanding — perfect for traders seeking precision and confidence.
What Is the Bollinger Bands Indicator?
The Bollinger Bands indicator is a powerful, overlay chart tool designed to help traders visualize price volatility and identify potential market extremes more effectively.
Unlike classic Bollinger Bands which use just two standard deviation bands, this enhanced version employs multiple deviation levels around a simple moving average (SMA) to give a richer picture of market dynamics.
Key Features
Multiple Deviation Bands: Instead of only ±2 standard deviations, it uses three extended levels: 2.5, 3.0, and 3.5 standard deviations to highlight subtle and extreme price movements.
Color-coded Volatility Zones: Each band range is filled with translucent red or teal shades to help traders visually grasp the intensity of price moves.
Customizable Length and Toggle: Adjust the length of the bands and enable or disable the indicator easily through inputs.
Why Three Deviation Levels?
Traditional Bollinger Bands (±2 standard deviations) cover approximately 95% of price action, but markets often present significant moves beyond this range that are important to identify for better risk management and trading decisions.
The three deviation levels serve distinct purposes:
Deviation Level Approximate Purpose Market Insight Provided
±2.5 SD Captures strong but fairly common moves Entry/exit trigger zones for trending moves
±3.0 SD Highlights more extreme, less frequent moves Indicates breakout strength or overextension
±3.5 SD Marks rare and extreme price deviations Signals potential reversal or exhaustion
This graduated scale allows traders to differentiate between normal volatility, strong momentum, and possible exhaustion—making it easier to tailor trading decisions according to market context.
How to Use Bollinger Bands
Identify Volatility Zones:
Observe how price interacts with the colored bands:
Price touching or crossing the ±2.5 SD band may indicate a strong move is underway.
Price breaching the ±3.0 or ±3.5 SD bands signals rare, extreme market conditions, which could be either a breakout or a setup for reversal.
Combine With Trend Analysis:
Use in conjunction with trend indicators like moving averages or volume to confirm the direction or strength of moves indicated by the bands.
Adjust Your Stops and Targets:
The layered bands help you set more intelligent stop losses and take profit zones by understanding how far price can reasonably stray.
Visual Clarity for Market Phases:
The shaded fills between bands give intuitive visual cues of volatility expansion and contraction phases.
Why Traders Choose Bollinger Bands
Greater Precision: More nuanced volatility detection than traditional Bollinger Bands.
Visual Elegance: Soft translucent fills and clear band lines reduce clutter while delivering maximum insight.
User-Friendly: Easy to toggle and adjust with minimal setup.
Versatile: Effective across assets, timeframes, and trading styles.
Final Thoughts
The Bollinger Bands indicator is more than just a volatility tool — it's your visual guide to understanding how extreme price moves develop in real-time. Whether you’re entering new trades, managing risk, or hunting reversals, this indicator equips you with superior clarity and confidence.
Add Bollinger Bands to your TradingView toolkit and see volatility like never before.

Bollinger Bands Mean Reversion by Kevin Davey Bollinger Bands Mean Reversion Strategy Description
The Bollinger Bands Mean Reversion Strategy is a popular trading approach based on the concept of volatility and market overreaction. The strategy leverages Bollinger Bands, which consist of an upper and lower band plotted around a central moving average, typically using standard deviations to measure volatility. When the price moves beyond these bands, it signals potential overbought or oversold conditions, and the strategy seeks to exploit a reversion back to the mean (the central band).
Strategy Components:
1. Bollinger Bands:
The bands are calculated using a 20-period Simple Moving Average (SMA) and a multiple (usually 2.0) of the standard deviation of the asset’s price over the same period. The upper band represents the SMA plus two standard deviations, while the lower band is the SMA minus two standard deviations. The distance between the bands increases with higher volatility and decreases with lower volatility.
2. Mean Reversion:
Mean reversion theory suggests that, over time, prices tend to move back toward their historical average. In this strategy, a buy signal is triggered when the price falls below the lower Bollinger Band, indicating a potential oversold condition. Conversely, the position is closed when the price rises back above the upper Bollinger Band, signaling an overbought condition.
Entry and Exit Logic:
Buy Condition: The strategy enters a long position when the price closes below the lower Bollinger Band, anticipating a mean reversion to the central band (SMA).
Sell Condition: The long position is exited when the price closes above the upper Bollinger Band, implying that the market is likely overbought and a reversal could occur.
This approach uses mean reversion principles, aiming to capitalize on short-term price extremes and volatility compression, often seen in sideways or non-trending markets. Scientific studies have shown that mean reversion strategies, particularly those based on volatility indicators like Bollinger Bands, can be effective in capturing small but frequent price reversals  .
Scientific Basis for Bollinger Bands:
Bollinger Bands, developed by John Bollinger, are widely regarded in both academic literature and practical trading as an essential tool for volatility analysis and mean reversion strategies. Research has shown that Bollinger Bands effectively identify relative price highs and lows, and can be used to forecast price volatility and detect potential breakouts . Studies in financial markets, such as those by Fernández-Rodríguez et al. (2003), highlight the efficacy of Bollinger Bands in detecting overbought or oversold conditions in various assets .
Who is Kevin Davey?
Kevin Davey is an award-winning algorithmic trader and highly regarded expert in developing and optimizing systematic trading strategies. With over 25 years of experience, Davey gained significant recognition after winning the prestigious World Cup Trading Championships multiple times, where he achieved triple-digit returns with minimal drawdown. His success has made him a key figure in algorithmic trading education, with a focus on disciplined and rule-based trading systems.

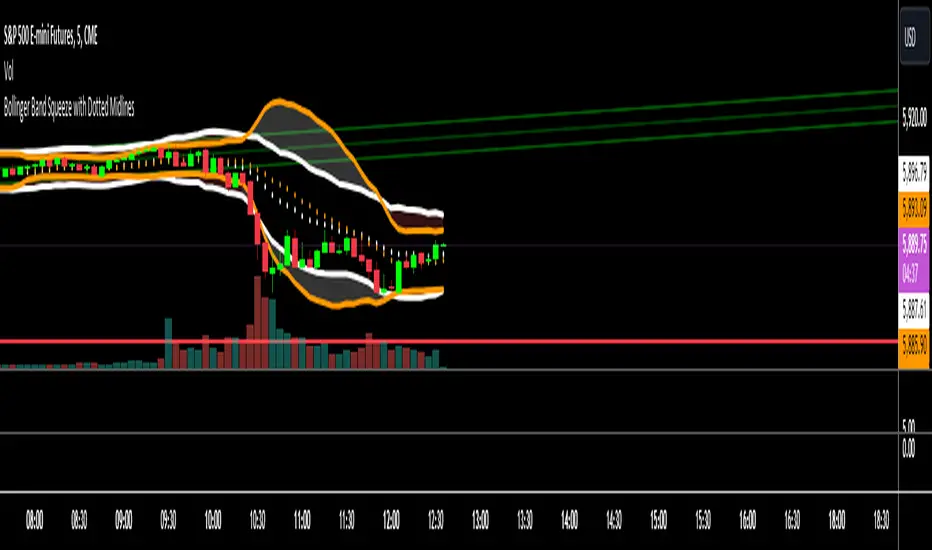
Bollinger Band Squeeze with Dotted MidlinesBollinger Band Squeeze with Dotted Midlines
Overview:
The Bollinger Band Squeeze with Dotted Midlines indicator is a powerful tool designed to identify periods of low volatility in the market, known as "squeeze" conditions, which often precede significant price movements. By combining Bollinger Bands and Keltner Channels, this indicator highlights when the market is consolidating and prepares traders for potential breakouts.
Key Features:
• Squeeze Detection: The indicator fills the area between the Bollinger Bands and Keltner Channels with a semi-transparent red color when both the upper and lower Bollinger Bands are within the Keltner Channels. This visual cue signifies a squeeze condition.
• Dynamic Color Filling: When the Bollinger Bands move outside the Keltner Channels, the fill color changes to a semi-transparent white, indicating the end of the squeeze and the potential start of increased volatility.
• Enhanced Visual Clarity:
o Upper and Lower Bands: The upper and lower lines of both the Bollinger Bands and Keltner Channels are plotted with increased thickness (3pt) for better visibility.
o Midlines with Dotted Effect: The middle lines (50% lines) for both the Bollinger Bands and Keltner Channels are plotted as dotted lines using circles with a thinner line width (1pt), providing a clear yet unobtrusive reference point.
Indicator Components:
1. Bollinger Bands (Orange Lines):
o Upper Bollinger Band: Calculated as the moving average plus a multiple of the standard deviation.
o Lower Bollinger Band: Calculated as the moving average minus a multiple of the standard deviation.
o Middle Bollinger Band: The simple moving average (SMA) of the closing price.
2. Keltner Channels (White Lines):
o Upper Keltner Channel: Calculated as the exponential moving average (EMA) plus a multiple of the average true range (ATR).
o Lower Keltner Channel: Calculated as the EMA minus a multiple of the ATR.
o Middle Keltner Channel: The EMA of the closing price.
3. Squeeze Condition Fill:
o Red Fill (40% Opacity): Indicates a squeeze condition where the Bollinger Bands are entirely within the Keltner Channels.
o White Fill (40% Opacity): Indicates normal market conditions where the Bollinger Bands have moved outside the Keltner Channels.
How to Use:
1. Identifying Squeeze Conditions:
o Look for Red Filled Areas: When you see the area between the Bollinger Bands and Keltner Channels filled in semi-transparent red, it signals a squeeze condition. This means the market is experiencing low volatility and may be preparing for a significant move.
2. Preparing for Potential Breakouts:
o Monitor for Fill Color Changes: A transition from red to white fill suggests that the squeeze is ending, and volatility is increasing. Traders often interpret this as a potential opportunity for a breakout in either direction.
3. Utilizing Midlines:
o Reference Midlines for Trend Direction: The dotted midlines provide insight into the overall trend. Crossing of the price above or below these lines can offer additional confirmation for trading decisions.
Customization Options:
• Bollinger Bands Settings:
o Length: Default is 20 periods. Adjust to change the sensitivity of the bands.
o Multiplier: Default is 2.0. Modify to increase or decrease the band width based on standard deviation.
• Keltner Channels Settings:
o Length: Default is 20 periods. Alter to adjust the responsiveness of the channels.
o Multiplier: Default is 1.5. Change to widen or narrow the channels based on average true range.
Advantages:
• Visual Clarity: Enhanced line thickness and semi-transparent fills make it easy to spot key market conditions at a glance.
• Early Warning System: By identifying squeeze conditions, traders can anticipate potential breakouts and plan their strategies accordingly.
• Flexible Application: Suitable for various timeframes and trading styles, including day trading, swing trading, and position trading.
Limitations:
• False Signals: Like all technical indicators, it may produce false signals, especially in choppy or range-bound markets.
• Should Be Used with Other Indicators: For better accuracy, it's recommended to use this indicator in conjunction with other technical analysis tools and not as a standalone signal generator.
Conclusion:
The Bollinger Band Squeeze with Dotted Midlines indicator is a valuable addition to any trader's toolkit. By effectively highlighting periods of consolidation and potential breakout points, it aids in making informed trading decisions. The visual enhancements improve usability, allowing traders to quickly interpret market conditions and respond appropriately.
Bollinger OTT SpreadBollinger OTT Spread (BOOTS) is a development combining Bollinger Bands with Optimized Trend Tracker (OTT) Indicator by Anıl Özekşi.
Bollinger Bands have originally 3 lines: Simple Moving Average (Middle Line), Upper Band and Lower Band.
BOOTS concentrates on the upper and lower Bollinger band lines.
First, it calculates the OTT using the UPPER and LOWER Bollinger Bands in a period of time (default lengths are 2) instead of closing prices.
After that, Upper and lower bands have more constant values.
There are 2 lines in BOOTS:
-The top (cyan) line is originally an OTT of the Upper Bollinger Band. (BOOTShigh)
-The bottom line (purple) is also an OTT line but conversely uses Lower Bollinger Band in the same period. (BOOTSlow)
Default values:
Bollinger Bands Moving AveragePeriod: 2 Bars
OTT Length: 2 Bars
OTT Optimizing coefficient (percent): %10
Bollinger Bands Standart Deviation Multiplier: 2 (not adjustable)
These values are designed for daily time frame, so they have to be optimized in other timeframes by the user. (Ex: Higher values can be considered in lower time frames)
Originally, Bollinger Bands used a Simple Moving Average in their calculation, but this time, Anıl Özekşi prefers VIDYA (Variable Dynamic Moving Average = VAR) instead of a Simple Moving Average.
Bollinger Bands cannot create significant BUY & SELL signals considering their original logic, but the primary purpose of BOOTS is to have substantial trading signals:
BUY when the price crosses above the BOOTSLower line (purple line)
STOP when the price crosses back below the BOOTSLower line (purple line)
SELL when the price crosses below the BOOTSUpper line (cyan line)
STOP when the price crosses back above the BOOTSUpper line (cyan line)
The price zone between the two lines is the flat zone; traders don't consider taking new positions in that area between the two lines.
Developer Anıl Özekşi advises that traders may have more accurate signals when using a short-period moving average instead of closing prices. So, I added a moving average with the same default length of 2 , which was used in Bollinger Bands calculation. You can check the "SHOW MOVING AVERAGE?" box on the settings tab of the indicator.

BollingerBands Strat + pending order alerts via TradingConnectorSoftware part of algotrading is simpler than you think. TradingView is a great place to do this actually. To present it, I'm publishing each of the default strategies you can find in Pinescript editor's "built-in" list with slight modification - I'm only adding 2 lines of code, which will trigger alerts, ready to be forwarded to your broker via TradingConnector and instantly executed there. Alerts added in this script: 14, 17, 20 and 23.
SCRIPT INCLUDES PENDING ORDERS AND ALERTS! Alert will be sent to MetaTrader when order is triggered, but not yet filled. That means if market conditions change and order does not get filled, it needs to be cancelled as well, and there are alerts for that in the script as well.
How it works:
1. TradingView alert fires.
2. TradingConnector catches it and forwards to MetaTrader4/5 you got from your broker.
3. Trade gets executed inside MetaTrader within 1 second of fired alert.
When configuring alert, make sure to select "alert() function calls only" in CreateAlert popup. One alert per ticker is required.
Adding stop-loss, take-profit, trailing-stop, break-even or executing pending orders is also possible. These topics have been covered in other example posts.
This routing works for Forex, indices, stocks, crypto - anything your broker offers via their MetaTrader4 or 5.
Disclaimer: This concept is presented for educational purposes only. Profitable results of trading this strategy are not guaranteed even if the backtest suggests so. By no means this post can be considered a trading advice. You trade at your own risk.
If you are thinking to execute this particular strategy, make sure to find the instrument, settings and timeframe which you like most. You can do this by your own research only.

Bollinger Bands Z-ScoreBollinger Bands Z-Score Indicator
This indicator transforms the classic Bollinger Bands into a Z-Score oscillator displayed in a separate pane. It standardizes the Bollinger Bands’ basis line by calculating the Z-Score over a user-defined period, allowing you to see how many standard deviations the price deviates from the mean.
Upper and Lower Fixed Lines: These are set at +2 and -2 Z-Score levels, representing common thresholds for overbought and oversold conditions.
Z-Score Oscillator: The normalized Bollinger Bands oscillate smoothly between these fixed boundaries, providing a clearer perspective on volatility extremes.
Z-Score Table: Displayed on the right side, this table shows the current Z-Score value, along with fixed maximum (+2) and minimum (-2) limits, making it easy to track current momentum and volatility in real-time.
Use Cases:
Identify overextended price moves with standardized volatility measures.
Spot potential reversals or continuation setups by observing the Z-Score crossing key levels.
Complement traditional Bollinger Bands analysis with a statistically normalized perspective.
Input Parameters:
Length: The period used for Bollinger Bands and Z-Score calculation.
MA Type: Choose the moving average type for the basis line (SMA, EMA, SMMA, WMA, VWMA).
StdDev: Multiplier for the standard deviation bands.
Z-Score Length: The lookback period used to compute the mean and standard deviation for Z-Score normalization.
This indicator is perfect for traders seeking a statistically sound and visually clear representation of Bollinger Bands volatility and extremes.

Bollinger Bands Multi TFBollinger Bands Multi TF Indicator
Overview
The Bollinger Bands Multi TF Indicator allows traders to overlay two sets of Bollinger Bands from different timeframes onto the same chart. This provides a broader market perspective by helping identify volatility and trend direction across multiple timeframes.
Features
✅ Dual Timeframe Support – Configure Bollinger Bands for two different timeframes (default: 15 min & 5 min).
✅ Customizable Moving Averages – Choose from SMA, EMA, SMMA (RMA), WMA, or VWMA as the basis line for each band.
✅ Dynamic Standard Deviation – Adjust the standard deviation multiplier for each timeframe.
✅ Visual Clarity – Different colors for each Bollinger Band set, with background filling for better visualization.
How to Use
🔹 Use the higher timeframe Bollinger Bands to identify overall trend and key resistance/support levels.
🔹 Use the lower timeframe Bollinger Bands for fine-tuned entry/exit signals within the broader trend.
🔹 A tightening of bands may indicate low volatility, signaling a potential breakout.
🔹 A widening of bands may suggest increased volatility and trend continuation.
Ideal For
📈 Intraday and swing traders looking for multi-timeframe confluence.
📊 Volatility-based traders who use Bollinger Bands for breakouts or reversals.
📍 Any trader wanting a deeper market context beyond a single timeframe.

Bollinger Breakout Strategy with Direction Control [4H crypto]Bollinger Breakout Strategy with Direction Control - User Guide
This strategy leverages Bollinger Bands, RSI, and directional filters to identify potential breakout trading opportunities. It is designed for traders looking to capitalize on significant price movements while maintaining control over trade direction (long, short, or both). Here’s how to use this strategy effectively:
How the Strategy Works
Indicators Used:
Bollinger Bands:
A volatility-based indicator with an upper and lower band around a simple moving average (SMA). The bands expand or contract based on market volatility.
RSI (Relative Strength Index):
Measures momentum to determine overbought or oversold conditions. In this strategy, RSI is used to confirm breakout strength.
Trade Direction Control:
You can select whether to trade:
Long only: Buy positions.
Short only: Sell positions.
Both: Trade in both directions depending on conditions.
Breakout Conditions:
Long Trade:
The price closes above the upper Bollinger Band.
RSI is above the midline (50), confirming upward momentum.
The "Trade Direction" setting allows either "Long" or "Both."
Short Trade:
The price closes below the lower Bollinger Band.
RSI is below the midline (50), confirming downward momentum.
The "Trade Direction" setting allows either "Short" or "Both."
Risk Management:
Stop-Loss:
Long trades: Set at 2% below the entry price.
Short trades: Set at 2% above the entry price.
Take-Profit:
Calculated using a Risk/Reward Ratio (default is 2:1).
Adjust this in the strategy settings.
Inputs and Customization
Key Parameters:
Bollinger Bands Length: Default is 20. Adjust based on the desired sensitivity.
Multiplier: Default is 2.0. Higher values widen the bands; lower values narrow them.
RSI Length: Default is 14, which is standard for RSI.
Risk/Reward Ratio: Default is 2.0. Increase for more aggressive profit targets, decrease for conservative exits.
Trade Direction:
Options: "Long," "Short," or "Both."
Example: Set to "Long" in a bullish market to focus only on buy trades.
How to Use This Strategy
Adding the Strategy:
Paste the script into TradingView’s Pine Editor and add it to your chart.
Setting Parameters:
Adjust the Bollinger Band settings, RSI, and Risk/Reward Ratio to fit the asset and timeframe you're trading.
Analyzing Signals:
Green line (Upper Band): Signals breakout potential for long trades.
Red line (Lower Band): Signals breakout potential for short trades.
Blue line (Basis): Central Bollinger Band (SMA), helpful for understanding price trends.
Testing the Strategy:
Use the Strategy Tester in TradingView to backtest performance on your chosen asset and timeframe.
Optimizing for Assets:
Forex pairs, cryptocurrencies (like BTC), or stocks with high volatility are ideal for this strategy.
Works best on higher timeframes like 4H or Daily.
Best Practices
Combine with Volume: Confirm breakouts with increased volume for higher reliability.
Avoid Sideways Markets: Use additional trend filters (like ADX) to avoid trades in low-volatility conditions.
Optimize Parameters: Regularly adjust the Bollinger Bands multiplier and RSI settings to match the asset's behavior.
By utilizing this strategy, you can effectively trade breakouts while maintaining flexibility in trade direction. Adjust the parameters to match your trading style and market conditions for optimal results!

Bollinger Breakout A3 updateBollinger Breakout A3 update from LuxAlgo signal
You can try it with some another signal.
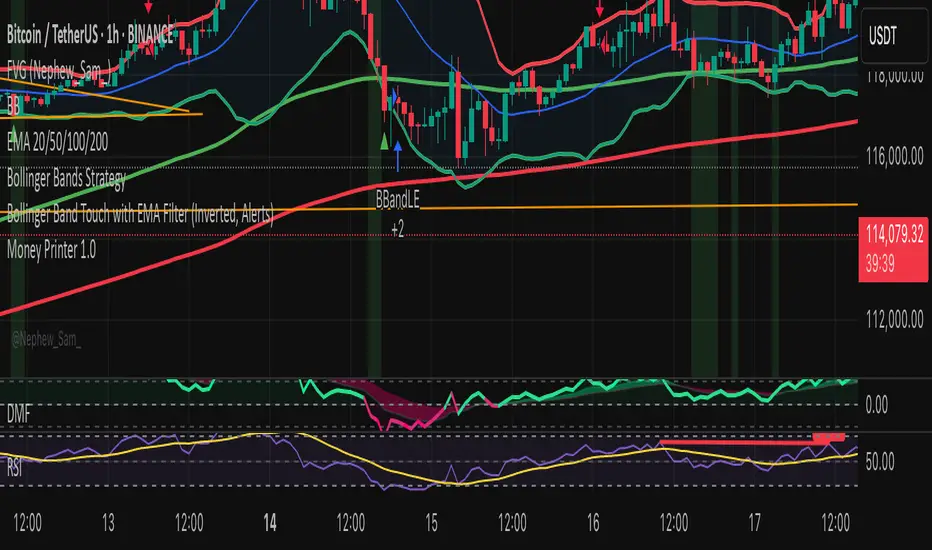
Bollinger Band Touch with EMA Filter (Inverted, Alerts)Bollinger Band Touch with EMA Filter above or below the 100 nd 200 emas


bollingerBandsV2Library "bollingerBandsV2"
Bollinger bands related functions
get_multiple_bollinger_bands(stdv1, stdv2, stdv3, stdv4, stdv5, stdv6, stdv7, length, source)
: Calculates 7 sets of bollinger bands, with 7 different standard deviations
Parameters:
stdv1 (float) : (simple int): standard deviation 1
stdv2 (float) : (simple int): standard deviation 2
stdv3 (float) : (simple int): standard deviation 3
stdv4 (float) : (simple int): standard deviation 4
stdv5 (float) : (simple int): standard deviation 5
stdv6 (float) : (simple int): standard deviation 6
stdv7 (float) : (simple int): standard deviation 7
length (simple int) : (simple int): Length for the bands
source (float) : (simple float): source for the calculation
Returns: : Returns 8 levels plus the range of all the levels.
get_bb_volatility(bb_highest, bb_lowest, ma_length, lookback)
: Provides a volatility indicator based on Bollinger Bands, and indicates wheather the volatility is increasing or decreasing.
Parameters:
bb_highest (float) : (simple float): Top Bollinger Band on which to calculate the range.
bb_lowest (float) : (simple float): Bottom Bollinger Band on which to calculate the range.
ma_length (simple int) : (simple int): Length to use in the smoothing of Bollinger Bands range.
lookback (int) : (simple int): Lookback period to identify a change in the Bollinger Bands range.
Returns: : Returns 8 levels plus the range of all the levels.
get_bbVolatility_data(source, length, stdv1, stdv2, stdv3, stdv4, stdv5, stdv6, stdv7, trend_direction)
: Generates Bollinger Bands Volatility
Parameters:
source (float) : (float): Source for Bollinger Bands
length (simple int) : (int): Length for Bollinger Bands
stdv1 (int) : (int): Standard Deviation 1
stdv2 (int) : (int): Standard Deviation 2
stdv3 (int) : (int): Standard Deviation 3
stdv4 (int) : (int): Standard Deviation 4
stdv5 (int) : (int): Standard Deviation 5
stdv6 (int) : (int): Standard Deviation 6
stdv7 (int) : (int): Standard Deviation 7
trend_direction (string) : (string): Current direction of the trend
Returns: : Returns a map with the levels, plus direction flag and the data table

B.Bands | Augmented | Intra-range | Long-OnlyHere you have the essential trading engine based on Bollinger Bands .
The idea behind is to trade the intra-range of the bands.
How is going to work?
Define which Bollinger Bands we want to use. Classic Bollinger Bands or Augmented Bollinger Bands . Without selecting, the algorithm doesn't show a strategy.
Define the length of the Moving Average and the Standard Deviation by default the classic 20-2.
Define the Bollinger Bands Spread Max Range (Upper-Lower) to be able to determine wheter or not you're in a price range or potential breakout.
Define data source to trigger exit and entry points.
Define profit based on Middle Band or Opposite Band.
Define Stop Loss % and activate Trailing Stop if desired with the percentage required.
Determine if you want to sell only on profit after triggering the entry signal. * Note Stop Loss remains activated.
Choose a date range if you want to study a specific period.
Bear in mind, this is the essential trading engine, open for you to test, try and improve under your requirements. You can determinate when is the ideal market to implement it based on many other indicators. Maybe you wish to change the stop loss settings for ATR, previous low, etc. Totally up to you.
Note the script comes with initial capital, fee % and slippage by deault. This may change for your assets. Make sure you define it in advance.
NOTE: If you trade assets such BTC, you must update the initial capital. By default 5000 (USD) The script doesn't support fraction trading such 0.01BTC.
Will be updated on next version.
Feel free to get in touch if you've got any question.
