Uptrick: Volatility Reversion BandsUptrick: Volatility Reversion Bands is an indicator designed to help traders identify potential reversal points in the market by combining volatility and momentum analysis within one comprehensive framework. It calculates dynamic bands around a simple moving average and issues signals when price interacts with these bands. Below is a fully expanded description, structured in multiple sections, detailing originality, usefulness, uniqueness, and the purpose behind blending standard deviation-based and ATR-based concepts. All references to code have been removed to focus on the written explanation only.
Section 1: Overview
Uptrick: Volatility Reversion Bands centers on a moving average around which various bands are constructed. These bands respond to changes in price volatility and can help gauge potential overbought or oversold conditions. Signals occur when the price moves beyond certain thresholds, which may imply a reversal or significant momentum shift.
Section 2: Originality, Usefulness, Uniqness, Purpose
This indicator merges two distinct volatility measurements—Bollinger Bands and ATR—into one cohesive system. Bollinger Bands use standard deviation around a moving average, offering a baseline for what is statistically “normal” price movement relative to a recent mean. When price hovers near the upper band, it may indicate overbought conditions, whereas price near the lower band suggests oversold conditions. This straightforward construction often proves invaluable in moderate-volatility settings, as it pinpoints likely turning points and gauges a market’s typical trading range.
Yet Bollinger Bands alone can falter in conditions marked by abrupt volatility spikes or sudden gaps that deviate from recent norms. Intraday news, earnings releases, or macroeconomic data can alter market behavior so swiftly that standard-deviation bands do not keep pace. This is where ATR (Average True Range) adds an important layer. ATR tracks recent highs, lows, and potential gaps to produce a dynamic gauge of how much price is truly moving from bar to bar. In quieter times, ATR contracts, reflecting subdued market activity. In fast-moving markets, ATR expands, exposing heightened volatility on each new bar.
By overlaying Bollinger Bands and ATR-based calculations, the indicator achieves a broader situational awareness. Bollinger Bands excel at highlighting relative overbought or oversold areas tied to an established average. ATR simultaneously scales up or down based on real-time market swings, signaling whether conditions are calm or turbulent. When combined, this means a price that barely crosses the Bollinger Band but also triggers a high ATR-based threshold is likely experiencing a volatility surge that goes beyond typical market fluctuations. Conversely, a price breach of a Bollinger Band when ATR remains low may still warrant attention, but not necessarily the same urgency as in a high-volatility regime.
The resulting synergy offers balanced, context-rich signals. In a strong trend, the ATR layer helps confirm whether an apparent price breakout really has momentum or if it is just a temporary spike. In a range-bound market, standard deviation-based Bollinger Bands define normal price extremes, while ATR-based extensions highlight whether a breakout attempt has genuine force behind it. Traders gain clarity on when a move is both statistically unusual and accompanied by real volatility expansion, thus carrying a higher probability of a directional follow-through or eventual reversion.
Practical advantages emerge across timeframes. Scalpers in fast-paced markets appreciate how ATR-based thresholds update rapidly, revealing if a sudden price push is routine or exceptional. Swing traders can rely on both indicators to filter out false signals in stable conditions or identify truly notable moves. By calibrating to changes in volatility, the merged system adapts naturally whether the market is trending, ranging, or transitioning between these phases.
In summary, combining Bollinger Bands (for a static sense of standard-deviation-based overbought/oversold zones) with ATR (for a dynamic read on current volatility) yields an adaptive, intuitive indicator. Traders can better distinguish fleeting noise from meaningful expansions, enabling more informed entries, exits, and risk management. Instead of relying on a single yardstick for all market conditions, this fusion provides a layered perspective, encouraging traders to interpret price moves in the broader context of changing volatility.
Section 3: Why Bollinger Bands and ATR are combined
Bollinger Bands provide a static snapshot of volatility by computing a standard deviation range above and below a central average. ATR, on the other hand, adapts in real time to expansions or contractions in market volatility. When combined, these measures offset each other’s limitations: Bollinger Bands add structure (overbought and oversold references), and ATR ensures responsiveness to rapid price shifts. This synergy helps reduce noisy signals, particularly during sudden market turbulence or extended consolidations.
Section 4: User Inputs
Traders can adjust several parameters to suit their preferences and strategies. These typically include:
1. Lookback length for calculating the moving average and standard deviation.
2. Multipliers to control the width of Bollinger Bands.
3. An ATR multiplier to set the distance for additional reversal bands.
4. An option to display weaker signals when the price merely approaches but does not cross the outer bands.
Section 5: Main Calculations
At the core of this indicator are four important steps:
1. Calculate a basis using a simple moving average.
2. Derive Bollinger Bands by adding and subtracting a product of the standard deviation and a user-defined multiplier.
3. Compute ATR over the same lookback period and multiply it by the selected factor.
4. Combine ATR-based distance with the Bollinger Bands to set the outer reversal bands, which serve as stronger signal thresholds.
Section 6: Signal Generation
The script interprets meaningful reversal points when the price:
1. Crosses below the lower outer band, potentially highlighting oversold conditions where a bullish reversal may occur.
2. Crosses above the upper outer band, potentially indicating overbought conditions where a bearish reversal may develop.
Section 7: Visualization
The indicator provides visual clarity through labeled signals and color-coded references:
1. Distinct colors for upper and lower reversal bands.
2. Markers that appear above or below bars to denote possible buying or selling signals.
3. A gradient bar color scheme indicating a bar’s position between the lower and upper bands, helping traders quickly see if the price is near either extreme.
Section 8: Weak Signals (Optional)
For those preferring early cues, the script can highlight areas where the price nears the outer bands. When weak signals are enabled:
1. Bars closer to the upper reversal zone receive a subtle marker suggesting a less robust, yet still noteworthy, potential selling area.
2. Bars closer to the lower reversal zone receive a subtle marker suggesting a less robust, yet still noteworthy, potential buying area.
Section 9: Simplicity, Effectiveness, and Lower Timeframes
Although combining standard deviation and ATR involves sophisticated volatility concepts, this indicator is visually straightforward. Reversal bands and gradient-colored bars make it easy to see at a glance when price approaches or crosses a threshold. Day traders operating on lower timeframes benefit from such clarity because it helps filter out minor fluctuations and focus on more meaningful signals.
Section 10: Adaptability across Market Phases
Because both the standard deviation (for Bollinger Bands) and ATR adapt to changing volatility, the indicator naturally adjusts to various environments:
1. Trending: The additional ATR-based outer bands help distinguish between temporary pullbacks and deeper reversals.
2. Ranging: Bollinger Bands often remain narrower, identifying smaller reversals, while the outer ATR bands remain relatively close to the main bands.
Section 11: Reduced Noise in High-Volatility Scenarios
By factoring ATR into the band calculations, the script widens or narrows the thresholds during rapid market fluctuations. This reduces the amount of false triggers typically found in indicators that rely solely on fixed calculations, preventing overreactions to abrupt but short-lived price spikes.
Section 12: Incorporation with Other Technical Tools
Many traders combine this indicator with oscillators such as RSI, MACD, or Stochastic, as well as volume metrics. Overbought or oversold signals in momentum oscillators can provide additional confirmation when price reaches the outer bands, while volume spikes may reinforce the significance of a breakout or potential reversal.
Section 13: Risk Management Considerations
All trading strategies carry risk. This indicator, like any tool, can and does produce losing trades if price unexpectedly reverses again or if broader market conditions shift rapidly. Prudent traders employ protective measures:
1. Stop-loss orders or trailing stops.
2. Position sizing that accounts for market volatility.
3. Diversification across different asset classes when possible.
Section 14: Overbought and Oversold Identification
Standard Bollinger Bands highlight regions where price might be overextended relative to its recent average. The extended ATR-based reversal bands serve as secondary lines of defense, identifying moments when price truly stretches beyond typical volatility bounds.
Section 15: Parameter Customization for Different Needs
Users can tailor the script to their unique preferences:
1. Shorter lookback settings yield faster signals but risk more noise.
2. Higher multipliers spread the bands further apart, filtering out small moves but generating fewer signals.
3. Longer lookback periods smooth out market noise, often leading to more stable but less frequent trading cues.
Section 16: Examples of Different Trading Styles
1. Day Traders: Often reduce the length to capture quick price swings.
2. Swing Traders: May use moderate lengths such as 20 to 50 bars.
3. Position Traders: Might opt for significantly longer settings to detect macro-level reversals.
Section 17: Performance Limitations and Reality Check
No technical indicator is free from false signals. Sudden fundamental news events, extreme sentiment changes, or low-liquidity conditions can render signals less reliable. Backtesting and forward-testing remain essential steps to gauge whether the indicator aligns well with a trader’s timeframe, risk tolerance, and instrument of choice.
Section 18: Merging Volatility and Momentum
A critical uniqueness of this indicator lies in how it merges Bollinger Bands (standard deviation-based) with ATR (pure volatility measure). Bollinger Bands provide a relative measure of price extremes, while ATR dynamically reacts to market expansions and contractions. Together, they offer an enhanced perspective on potential market turns, ideally reducing random noise and highlighting moments where price has traveled beyond typical bounds.
Section 19: Purpose of this Merger
The fundamental purpose behind blending standard deviation measures with real-time volatility data is to accommodate different market behaviors. Static standard deviation alone can underreact or overreact in abnormally volatile conditions. ATR alone lacks a baseline reference to normality. By merging them, the indicator aims to provide:
1. A versatile dynamic range for both typical and extreme moves.
2. A filter against frequent whipsaws, especially in choppy environments.
3. A visual framework that novices and experts can interpret rapidly.
Section 20: Summary and Practical Tips
Uptrick: Volatility Reversion Bands offers a powerful tool for traders looking to combine volatility-based signals with momentum-derived reversals. It emphasizes clarity through color-coded bars, defined reversal zones, and optional weak signal markers. While potentially useful across all major timeframes, it demands ongoing risk management, realistic expectations, and careful study of how signals behave under different market conditions. No indicator serves as a crystal ball, so integrating this script into an overall strategy—possibly alongside volume data, fundamentals, or momentum oscillators—often yields the best results.
Disclaimer and Educational Use
This script is intended for educational and informational purposes. It does not constitute financial advice, nor does it guarantee trading success. Sudden economic events, low-liquidity times, and unexpected market behaviors can all undermine technical signals. Traders should use proper testing procedures (backtesting and forward-testing) and maintain disciplined risk management measures.
在脚本中搜索"布林线boll指标使用详细讲解"

Adaptive Range Scalper - KetBotAIThe Adaptive Scalper is designed to dynamically adjust entry, take-profit (TP), and stop-loss (SL) levels based on the latest market price. It combines multiple tools to provide traders with actionable insights, suitable for a range of trading styles and timeframes.
How the Indicator Works
Dynamic Levels:
- Yellow Dotted Line: Represents the entry level, following the latest price dynamically.
- Green Line: The Take Profit (TP) level, calculated as a multiple of the current price, adapts in real-time.
- Red Line: The Stop Loss (SL) level, placed below the price and also dynamically adjusts.
Bollinger Bands:
Provides context for market volatility and potential overbought/oversold zones.
Narrowing bands signal consolidation, while expanding bands indicate increased volatility.
Buy and Sell Signals:
Buy Signal: Triggered when the price crosses above the lower Bollinger Band.
Sell Signal: Triggered when the price crosses below the upper Bollinger Band.
These signals help traders time entries and exits based on momentum shifts.
Risk/Reward Analysis:
Visual shading shows the favorable risk/reward zone between the stop loss and take profit levels.
Timeframe Suggestions
Short-Term Traders (Scalping):
Use on 5-minute to 15-minute charts.
Focus on high-volatility periods for quick entries and exits.
Intraday Traders:
Ideal for 30-minute to 1-hour charts.
Provides more stable signals and less noise.
Swing Traders:
Best suited for 4-hour or daily charts.
Captures broader trends with fewer signals, allowing for larger moves.
Tool Combination
Volume Profile:
Combine with volume-based tools to confirm key support/resistance zones around TP and SL levels.
Trend Indicators:
Use with Moving Averages (e.g., 20-period or 50-period) to identify the broader trend direction.
Example: Only take buy signals in an uptrend and sell signals in a downtrend.
Momentum Oscillators:
Pair with tools like RSI or MACD to avoid entering overbought/oversold conditions.
Support/Resistance Lines:
Manually mark significant levels to confirm alignment with the indicator’s TP and SL zones.
Useful Advice for Traders
Risk Management:
- Always assess the risk/reward ratio; aim for at least 1:2 (risking 1 to gain 2).
- Adjust the multiplier to match your trading style (e.g., higher multiplier for swing trades, lower for scalping).
Avoid Overtrading:
Use the indicator in conjunction with clear rules to avoid false signals during low-volatility periods.
Monitor market volatility:
Pay attention to narrowing Bollinger Bands, which signal consolidations. Avoid trading until a breakout occurs.
Test on Demo Accounts:
Practice using the indicator on a demo account to understand its behavior across different assets and timeframes.
Focus on High-Liquidity Markets:
For the best results, trade highly liquid instruments like major currency pairs, gold, or stock indices.
Summary
The Adaptive Range Indicator dynamically adjusts to market conditions, offering clear entry and exit levels. By combining it with Bollinger Bands and other tools, traders can better navigate market trends and avoid noise. It’s versatile across multiple timeframes and assets, making it a valuable addition to any trader’s toolkit.

Uptrick: Smart BoundariesThis script is an indicator that combines the RSI (Relative Strength Index) and Bollinger Bands to highlight potential points where price momentum and volatility may both be at extreme levels. Below is a detailed explanation of its components, how it calculates signals, and why these two indicators have been merged into one tool. This script is intended solely for educational purposes and for traders who want to explore the combined use of momentum and volatility measures. Please remember that no single indicator guarantees profitable results.
Purpose of This Script
This script is designed to serve as a concise, all-in-one tool for traders seeking to track both momentum and volatility extremes in real time. By overlaying RSI signals with Bollinger Band boundaries, it helps users quickly identify points on a chart where price movement may be highly stretched. The goal is to offer a clearer snapshot of potential overbought or oversold conditions without requiring two separate indicators. Additionally, its optional pyramiding feature enables users to manage how many times they initiate trades when signals repeat in the same direction. Through these combined functions, the script aims to streamline technical analysis by consolidating two popular measures—momentum via RSI and volatility via Bollinger Bands—into a single, manageable interface.
1. Why Combine RSI and Bollinger Bands
• RSI (Relative Strength Index): This is a momentum oscillator that measures the speed and magnitude of recent price changes. It typically ranges between 0 and 100. Traders often watch for RSI crossing into “overbought” or “oversold” levels because it may indicate a potential shift in momentum.
• Bollinger Bands: These bands are plotted around a moving average, using a standard deviation multiplier to create an upper and lower boundary. They help illustrate how volatile the price has been relative to its recent average. When price moves outside these boundaries, some traders see it as a sign the price may be overstretched and could revert closer to the average.
Combining these two can be useful because it blends two different perspectives on market movement. RSI attempts to identify momentum extremes, while Bollinger Bands track volatility extremes. By looking for moments when both conditions agree, the script tries to highlight points where price might be unusually stretched in terms of both momentum and volatility.
2. How Signals Are Generated
• Buy Condition:
- RSI dips below a specified “oversold” level (for example, 30 by default).
- Price closes below the lower Bollinger Band.
When these occur together, the script draws a label indicating a potential bullish opportunity. The underlying reasoning is that momentum (RSI) suggests a stronger-than-usual sell-off, and price is also stretched below the lower Bollinger Band.
• Sell Condition:
- RSI rises above a specified “overbought” level (for example, 70 by default).
- Price closes above the upper Bollinger Band.
When these occur together, a label is plotted for a potential bearish opportunity. The rationale is that momentum (RSI) may be overheated, and the price is trading outside the top of its volatility range.
3. Pyramiding Logic and Trade Count Management
• Pyramiding refers to taking multiple positions in the same direction when signals keep firing. While some traders prefer just one position per signal, others like to scale into a trade if the market keeps pushing in their favor.
• This script uses variables that keep track of how many recent buy or sell signals have fired. If the count reaches a user-defined maximum, no more signals of that type will trigger additional labels. This protects traders from over-committing to one direction if the market conditions remain “extreme” for a prolonged period.
• If you disable the pyramiding feature, the script will only plot one label per side until the condition resets (i.e., until RSI and price conditions are no longer met).
4. Labels and Visual Feedback
• Whenever a buy or sell condition appears, the script plots a label directly on the chart:
- Buy labels under the price bar.
- Sell labels above the price bar.
These labels make it easier to review where both RSI and Bollinger Band conditions align. It can be helpful for visually scanning the chart to see if the signals show any patterns related to market reversals or trend continuations.
• The Bollinger Bands themselves are plotted so traders can see when the price is approaching or exceeding the upper or lower band. Watching the RSI and Bollinger Band plots simultaneously can give traders more context for each signal.
5. Originality and Usefulness
This script provides a distinct approach by merging two well-established concepts—RSI and Bollinger Bands—within a single framework, complemented by optional pyramiding controls. Rather than using each indicator separately, it attempts to uncover moments when momentum signals from RSI align with volatility extremes highlighted by Bollinger Bands. This combined perspective can aid in spotting areas of possible overextension in price. Additionally, the built-in pyramiding mechanism offers a method to manage multiple signals in the same direction, allowing users to adjust how aggressively they scale into trades. By integrating these elements together, the script aims to deliver a tool that caters to diverse trading styles while remaining straightforward to configure and interpret.
6. How to Use the Indicator
• Configure the Inputs:
- RSI Length (the lookback period used for the RSI calculation).
- RSI Overbought and Oversold Levels.
- Bollinger Bands Length and Multiplier (defines the moving average period and the degree of deviation).
- Option to reduce pyramiding.
• Set Alerts (Optional):
- You can create TradingView alerts for when these conditions occur, so you do not have to monitor the chart constantly. Choose the buy or sell alert conditions in your alert settings.
• Integration in a Trading Plan:
- This script alone is not a complete trading system. Consider combining it with other forms of analysis, such as support and resistance, volume profiles, or candlestick patterns. Thorough research, testing on historical data, and risk management are always recommended.
7. No Performance Guarantees
• This script does not promise any specific trading results. It is crucial to remember that no single indicator can accurately predict future market movements all the time. The script simply tries to highlight moments when two well-known indicators both point to an extreme condition.
• Actual trading decisions should factor in a range of market information, including personal risk tolerance and broader market conditions.
8. Purpose and Limitations
• Purpose:
- Provide a combined view of momentum (RSI) and volatility (Bollinger Bands) in a single script.
- Assist in spotting times when price may be at an extreme.
- Offer a configurable system for labeling potential buy or sell points based on these extremes.
• Limitations:
- Overbought and oversold conditions can persist for an extended period in trending markets.
- Bollinger Band breakouts do not always result in immediate reversals. Sometimes price keeps moving in the same direction.
- The script does not include a built-in exit strategy or risk management rules. Traders must handle these themselves.
Additional Disclosures
This script is published open-source and does not rely on any external or private libraries. It does not use lookahead methods or repaint signals; all calculations are performed on the current bar without referencing future data. Furthermore, the script is designed for standard candlestick or bar charts rather than non-standard chart types (e.g., Heikin Ashi, Renko). Traders should keep in mind that while the script can help locate potential momentum and volatility extremes, it does not include an exit strategy or account for factors like slippage or commission. All code comes from built-in Pine Script functions and standard formulas for RSI and Bollinger Bands. Anyone reviewing or modifying this script should exercise caution and incorporate proper risk management when applying it to their own trading.
Calculation Details
The script computes RSI by examining a user-defined number of prior bars (the RSI Length) and determining the average of up-moves relative to the average of down-moves over that period. This ratio is then scaled to a 0–100 range, so lower values typically indicate stronger downward momentum, while higher values suggest stronger upward momentum. In parallel, Bollinger Bands are generated by first calculating a simple moving average (SMA) of the closing price for the user-specified length. The script then measures the standard deviation of closing prices over the same period and multiplies it by the chosen factor (the Bollinger Bands Multiplier) to form the upper and lower boundaries around the SMA. These two measures are checked in tandem: if the RSI dips below a certain oversold threshold and price trades below the lower Bollinger Band, a condition is met that may imply a strong short-term sell-off; similarly, if the RSI surpasses the overbought threshold and price rises above the upper Band, it may indicate an overextended move to the upside. The pyramiding counters track how many of these signals occur in sequence, preventing excessive stacking of labels on the chart if conditions remain extreme for multiple bars.
Conclusion
This indicator aims to provide a more complete view of potential market extremes by overlaying the RSI’s momentum readings on top of Bollinger Band volatility signals. By doing so, it attempts to help traders see when both indicators suggest that the market might be oversold or overbought. The optional reduced pyramiding logic further refines how many signals appear, giving users the choice of a single entry or multiple scaling entries. It does not claim any guaranteed success or predictive power, but rather serves as a tool for those wanting to explore this combined approach. Always be cautious and consider multiple factors before placing any trades.

MACD+RSI+BBDESCRIPTION
The MACD + RSI + Bollinger Bands Indicator is a comprehensive technical analysis tool designed for traders and investors to identify potential market trends and reversals. This script combines three indicators: the Moving Average Convergence Divergence (MACD), the Relative Strength Index (RSI), and Bollinger Bands. Each of these indicators provides unique insights into market behavior.
FEATURES
MACD (Moving Average Convergence Divergence)
The MACD is a trend-following momentum indicator that shows the relationship between two moving averages of a security’s price.
The script calculates the MACD line, the signal line, and the histogram, which visually represents the difference between the MACD line and the signal line.
RSI (Relative Strength Index)
The RSI is a momentum oscillator that measures the speed and change of price movements. It ranges from 0 to 100 and is typically used to identify overbought or oversold conditions.
The script allows users to set custom upper and lower thresholds for the RSI, with default values of 70 and 30, respectively.
Bollinger Bands
Bollinger Bands consist of a middle band (EMA) and two outer bands (standard deviations away from the EMA). They help traders identify volatility and potential price reversals.
The script allows users to customize the length of the Bollinger Bands and the multiplier for the standard deviation.
Color-Coding Logic
The histogram color changes based on the following conditions:
Black: If the RSI is above the upper threshold and the closing price is above the upper Bollinger Band, or if the RSI is below the lower threshold and the closing price is below the lower Bollinger Band.
Green (#4caf50): If the RSI is above the upper threshold but the closing price is not above the upper Bollinger Band.
Light Green (#a5d6a7): If the histogram is positive and the RSI is not above the upper threshold.
Red (#f23645): If the RSI is below the lower threshold but the closing price is not below the lower Bollinger Band.
Light Red (#faa1a4): If the histogram is negative and the RSI is not below the lower threshold.
Inputs
Bollinger Bands Settings
Length: The number of periods for the moving average.
Basis MA Type: The type of moving average (SMA, EMA, SMMA, WMA, VWMA).
Source: The price source for the Bollinger Bands calculation.
StdDev: The multiplier for the standard deviation.
RSI Settings
RSI Length: The number of periods for the RSI calculation.
RSI Upper: The upper threshold for the RSI.
RSI Lower: The lower threshold for the RSI.
Source: The price source for the RSI calculation.
MACD Settings
Fast Length: The length for the fast moving average.
Slow Length: The length for the slow moving average.
Signal Smoothing: The length for the signal line smoothing.
Oscillator MA Type: The type of moving average for the MACD calculation.
Signal Line MA Type: The type of moving average for the signal line.
Usage
This indicator is suitable for various trading strategies, including day trading, swing trading, and long-term investing.
Traders can use the MACD histogram to identify potential buy and sell signals, while the RSI can help confirm overbought or oversold conditions.
The Bollinger Bands provide context for price volatility and potential breakout or reversal points.
Example:
From the example, it can clearly see that the Selling Climax and Buying Climax, marked as orange circle when a black histogram occurs.
Conclusion
The MACD + RSI + Bollinger Bands Indicator is a versatile tool that combines multiple technical analysis methods to provide traders with a comprehensive view of market conditions. By utilizing this script, traders can enhance their analysis and improve their decision-making process.

Bitcoin CME-Spot Z-Spread - Strategy [presentTrading]This time is a swing trading strategy! It measures the sentiment of the Bitcoin market through the spread of CME Bitcoin Futures and Bitfinex BTCUSD Spot prices. By applying Bollinger Bands to the spread, the strategy seeks to capture mean-reversion opportunities when prices deviate significantly from their historical norms
█ Introduction and How it is Different
The Bitcoin CME-Spot Bollinger Bands Strategy is designed to capture mean-reversion opportunities by exploiting the spread between CME Bitcoin Futures and Bitfinex BTCUSD Spot prices. The strategy uses Bollinger Bands to detect when the spread between these two correlated assets has deviated significantly from its historical norm, signaling potential overbought or oversold conditions.
What sets this strategy apart is its focus on spread trading between futures and spot markets rather than price-based indicators. By applying Bollinger Bands to the spread rather than individual prices, the strategy identifies price inefficiencies across markets, allowing traders to take advantage of the natural reversion to the mean that often occurs in these correlated assets.
BTCUSD 8hr Performance
█ Strategy, How It Works: Detailed Explanation
The strategy relies on Bollinger Bands to assess the volatility and relative deviation of the spread between CME Bitcoin Futures and Bitfinex BTCUSD Spot prices. Bollinger Bands consist of a moving average and two standard deviation bands, which help measure how much the spread deviates from its historical mean.
🔶 Spread Calculation:
The spread is calculated by subtracting the Bitfinex spot price from the CME Bitcoin futures price:
Spread = CME Price - Bitfinex Price
This spread represents the difference between the futures and spot markets, which may widen or narrow based on supply and demand dynamics in each market. By analyzing the spread, the strategy can detect when prices are too far apart (potentially overbought or oversold), indicating a trading opportunity.
🔶 Bollinger Bands Calculation:
The Bollinger Bands for the spread are calculated using a simple moving average (SMA) and the standard deviation of the spread over a defined period.
1. Moving Average (SMA):
The simple moving average of the spread (mu_S) over a specified period P is calculated as:
mu_S = (1/P) * sum(S_i from i=1 to P)
Where S_i represents the spread at time i, and P is the lookback period (default is 200 bars). The moving average provides a baseline for the normal spread behavior.
2. Standard Deviation:
The standard deviation (sigma_S) of the spread is calculated to measure the volatility of the spread:
sigma_S = sqrt((1/P) * sum((S_i - mu_S)^2 from i=1 to P))
3. Upper and Lower Bollinger Bands:
The upper and lower Bollinger Bands are derived by adding and subtracting a multiple of the standard deviation from the moving average. The number of standard deviations is determined by a user-defined parameter k (default is 2.618).
- Upper Band:
Upper Band = mu_S + (k * sigma_S)
- Lower Band:
Lower Band = mu_S - (k * sigma_S)
These bands provide a dynamic range within which the spread typically fluctuates. When the spread moves outside of these bands, it is considered overbought or oversold, potentially offering trading opportunities.
Local view
🔶 Entry Conditions:
- Long Entry: A long position is triggered when the spread crosses below the lower Bollinger Band, indicating that the spread has become oversold and is likely to revert upward.
Spread < Lower Band
- Short Entry: A short position is triggered when the spread crosses above the upper Bollinger Band, indicating that the spread has become overbought and is likely to revert downward.
Spread > Upper Band
🔶 Risk Management and Profit-Taking:
The strategy incorporates multi-step take profits to lock in gains as the trade moves in favor. The position is gradually reduced at predefined profit levels, reducing risk while allowing part of the trade to continue running if the price keeps moving favorably.
Additionally, the strategy uses a hold period exit mechanism. If the trade does not hit any of the take-profit levels within a certain number of bars, the position is closed automatically to avoid excessive exposure to market risks.
█ Trade Direction
The trade direction is based on deviations of the spread from its historical norm:
- Long Trade: The strategy enters a long position when the spread crosses below the lower Bollinger Band, signaling an oversold condition where the spread is expected to narrow.
- Short Trade: The strategy enters a short position when the spread crosses above the upper Bollinger Band, signaling an overbought condition where the spread is expected to widen.
These entries rely on the assumption of mean reversion, where extreme deviations from the average spread are likely to revert over time.
█ Usage
The Bitcoin CME-Spot Bollinger Bands Strategy is ideal for traders looking to capitalize on price inefficiencies between Bitcoin futures and spot markets. It’s especially useful in volatile markets where large deviations between futures and spot prices occur.
- Market Conditions: This strategy is most effective in correlated markets, like CME futures and spot Bitcoin. Traders can adjust the Bollinger Bands period and standard deviation multiplier to suit different volatility regimes.
- Backtesting: Before deployment, backtesting the strategy across different market conditions and timeframes is recommended to ensure robustness. Adjust the take-profit steps and hold periods to reflect the trader’s risk tolerance and market behavior.
█ Default Settings
The default settings provide a balanced approach to spread trading using Bollinger Bands but can be adjusted depending on market conditions or personal trading preferences.
🔶 Bollinger Bands Period (200 bars):
This defines the number of bars used to calculate the moving average and standard deviation for the Bollinger Bands. A longer period smooths out short-term fluctuations and focuses on larger, more significant trends. Adjusting the period affects the responsiveness of the strategy:
- Shorter periods (e.g., 100 bars): Makes the strategy more reactive to short-term market fluctuations, potentially generating more signals but increasing the risk of false positives.
- Longer periods (e.g., 300 bars): Focuses on longer-term trends, reducing the frequency of trades and focusing only on significant deviations.
🔶 Standard Deviation Multiplier (2.618):
The multiplier controls how wide the Bollinger Bands are around the moving average. By default, the bands are set at 2.618 standard deviations away from the average, ensuring that only significant deviations trigger trades.
- Higher multipliers (e.g., 3.0): Require a more extreme deviation to trigger trades, reducing trade frequency but potentially increasing the accuracy of signals.
- Lower multipliers (e.g., 2.0): Make the bands narrower, increasing the number of trade signals but potentially decreasing their reliability.
🔶 Take-Profit Levels:
The strategy has four take-profit levels to gradually lock in profits:
- Level 1 (3%): 25% of the position is closed at a 3% profit.
- Level 2 (8%): 20% of the position is closed at an 8% profit.
- Level 3 (14%): 15% of the position is closed at a 14% profit.
- Level 4 (21%): 10% of the position is closed at a 21% profit.
Adjusting these take-profit levels affects how quickly profits are realized:
- Lower take-profit levels: Capture gains more quickly, reducing risk but potentially cutting off larger profits.
- Higher take-profit levels: Let trades run longer, aiming for bigger gains but increasing the risk of price reversals before profits are locked in.
🔶 Hold Days (20 bars):
The strategy automatically closes the position after 20 bars if none of the take-profit levels are hit. This feature prevents trades from being held indefinitely, especially if market conditions are stagnant. Adjusting this:
- Shorter hold periods: Reduce the duration of exposure, minimizing risks from market changes but potentially closing trades too early.
- Longer hold periods: Allow trades to stay open longer, increasing the chance for mean reversion but also increasing exposure to unfavorable market conditions.
By understanding how these default settings affect the strategy’s performance, traders can optimize the Bitcoin CME-Spot Bollinger Bands Strategy to their preferences, adapting it to different market environments and risk tolerances.

Logical Trading Indicator V.1Features of the Logical Trading Indicator V.1
ATR-Based Trailing Stop Loss
The Logical Trading Indicator V.1 utilizes the Average True Range (ATR) to implement a dynamic trailing stop loss. You can customize the sensitivity of your alerts by adjusting the ATR Multiple and ATR Period settings.
Higher ATR Multiple values create wider stops, while lower values result in tighter stops. This feature ensures that your trades are protected against adverse price movements. For best practice, use higher values on higher timeframes and lower values on lower term timeframes.
Bollinger Bands
The Logical Trading Indicator V.1 includes Bollinger Bands, which can be customized to use either a Simple Moving Average (SMA) or an Exponential Moving Average (EMA) as the basis.
You can adjust the length and standard deviation multiplier of the Bollinger Bands to fine-tune your strategy. The color of the basis line changes to green when price is above and red when price is below the line to represent the trend.
The bands show a range vs a single band that also represents when the price is in overbought and oversold ranges similar to an RSI. These bands also control the take profit signals.
You also have the ability to change the band colors as well as toggle them off, which only affects the view, they are still active which will still fire the take profit signals.
Momentum Indicator
Our indicator offers a momentum filter option that highlights market momentum directly on the candlesticks, identifying periods of bullish, bearish, or consolidation phases. You can enable or disable this filter as needed, providing valuable insights into market conditions.
By default, you will see the candlestick colors represent the momentum direction as green or red, and consolidation periods as white, but the filter on the BUY and SELL signals is not active. The view options and filter can be toggled on and off in the settings.
Buy and Sell Signals
The Logical Trading Indicator V.1 generates buy and sell signals based on a combination of ATR-based filtering, Bollinger Band basis crossover, and optional momentum conditions if selected in the settings. These signals help you make informed decisions about when to enter or exit a trade. You can also enable a consolidation filter to stay out of trades during tight ranges.
Basically a BUY signal fires when the price closes above the basis line, and the price meets or exceeds the ATR multiple from the previous candle length, which is also editable in the settings.
If the momentum filter is engaged, it will not fire BUY signals when in consolidation periods. It works just the opposite for SELL signals.
Take Profit Signals
We've integrated a Take Profit feature that helps you identify points to exit your trades with profits. The indicator marks Long Take Profit when prices close below the upper zone line of the Bollinger Bands after the previous candle closes inside the band, suggesting an optimal point to exit a long trade or consider a short position.
Conversely, Short Take Profit signals appear when prices close above the lower zone after the previous candle closes inside of it, indicating the right time to exit a short trade or contemplate a long position.
Alerts for Informed Trading
The Logical Trading Indicator V.1 comes equipped with alert conditions for buy signals, sell signals, take profit points, and more. Receive real-time notifications to your preferred devices or platforms to stay updated on market movements and trading opportunities.

VOLD Ratio (Volume Difference Ratio) by TenozenAnother helpful indicator is here! VOLD Ratio is calculated by the net volume of a buying candle, divided by the net volume of a sell candle.
Formula:
buying net volume/selling net volume
It's a simple indicator, but don't underestimate this simplicity. It's a powerful indicator that would help you to decide whether the volume is getting interested in the direction that the market would take. So assume when the market is above the Bollinger Bands, it means that the volume is at a buying extreme, by that, we could expect the market to get back towards the mean, as there is a lot of buying demand that entered the market. How about below the Bollinger Bands? it means that the volume is at a selling extreme, we could expect that there is a lot of volume getting in toward the sellers, so we could take advantage of the opportunity to go for a long. Lastly, the Bollinger Bands would help you guys to determine the liquidity of the market, if the Bollinger Bands get smaller over time, it means there is no interest for the market to enter yet, and if the Bollinger Bands get bigger over time, it means there is interest for the market to enter in the session.
Tips & Reminder:
- We shouldn't use this indicator by itself, make sure to use an Indicator that would help you guys to determine the momentum and the liquidity of the market.
- The higher the timeframe, the slower this indicator would signal an entry, by that use a smaller timeframe... I suggest using a 15M chart for the execution.
- Always trade in the medium-longterm direction if you want to have a high probability trade.
- Be patient in your execution, it's more likely the market would go higher or lower after going in the extreme of the Bollinger Bands.
Well, that's it! Hope you guys enjoy using this indicator, let me know if there is any question or suggestion. Ciao...

Moving Averages + BB & R.VWAP StDev (multi-tf)█ Moving Averages + Bollinger Bands and Rolling Volume Weighted Average Price with Standard Deviation Bands (Multi Timeframe)
Multiple moving averages can be independently applied.
The length , type and timeframe of each moving average are configurable .
The lines and colors are customizable too.
This script can display:
Moving Averages
Bollinger Bands
Rolling VWAP and Standard Deviation Bands
Types of Moving Averages:
Simple Moving Average (SMA)
Exponential Moving Average (EMA)
Smoothed Moving Average (SMMA)
Weighted Moving Average (WMA)
Volume Weighted Moving Average (VWMA)
Least Squares Moving Average (LSMA)
Hull Moving Average (HMA)
Arnaud Legoux Moving Average (ALMA)
█ Moving Average
Moving Averages are price based, lagging (or reactive) indicators that display the average price of a security over a set period of time.
A Moving Average is a good way to gauge momentum as well as to confirm trends, and define areas of support and resistance.
█ Bollinger Bands
Bollinger Bands consist of a band of three lines which are plotted in relation to security prices.
The line in the middle is usually a Simple Moving Average (SMA) set to a period of 20 days (the type of trend line and period can be changed by the trader, a 20 day moving average is by far the most popular).
The SMA then serves as a base for the Upper and Lower Bands which are used as a way to measure volatility by observing the relationship between the Bands and price.
█ Rolling VWAP
The typical VWAP is designed to be used on intraday charts, as it resets at the beginning of the day.
Such VWAPs cannot be used on daily, weekly or monthly charts. Instead, this rolling VWAP uses a time period that automatically adjusts to the chart's timeframe.
You can thus use the rolling VWAP on any chart that includes volume information in its data feed.
Because the rolling VWAP uses a moving window, it does not exhibit the jumpiness of VWAP plots that reset.
Based on the previous script :

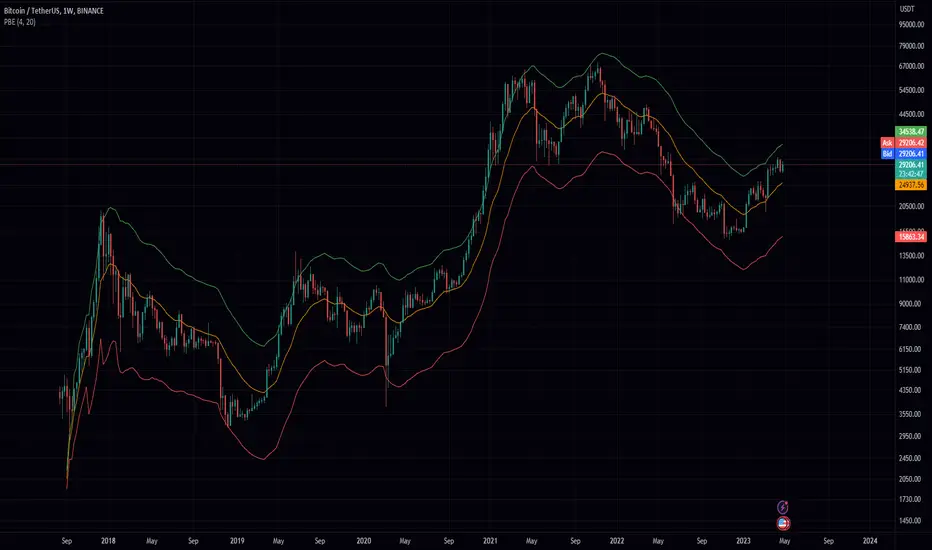
Probability Envelopes (PBE)Introduction
In the world of trading, technical analysis is vital for making informed decisions about the future direction of an asset's price. One such tool is the use of indicators, mathematical calculations that can help traders predict market trends. This article delves into an innovative indicator called the Probability Envelopes Indicator, which offers valuable insights into the potential price levels an asset may reach based on historical data. This in-depth look explores the statistical foundations of the indicator, highlighting its key components and benefits.
Section 1: Calculating Price Movements with Log Returns and Percentages
The Probability Envelopes Indicator provides the option to use either log returns or percentage changes when calculating price movements. Each method has its advantages:
Log Returns: These are calculated as the natural logarithm of the ratio of the current price to the previous price. Log returns are considered more stable and less sensitive to extreme price fluctuations.
Percentage Changes: These are calculated as the percentage difference between the current price and the previous price. They are simpler to interpret and easier to understand for most traders.
Section 2: Understanding Mean, Variance, and Standard Deviation
The Probability Envelopes Indicator utilizes various statistical measures to analyze historical price movements:
Mean: This is the average of a set of numbers. In the context of this indicator, it represents the average price movement for bullish (green) and bearish (red) scenarios.
Variance: This measure represents the dispersion of data points in a dataset. A higher variance indicates a greater spread of data points from the mean. Variance is calculated as the average of the squared differences from the mean.
Standard Deviation: This is the square root of the variance. It is a measure of the amount of variation or dispersion in a dataset. In the context of this indicator, standard deviations are used to calculate the width of the bands around the expected mean.
Section 3: Analyzing Historical Price Movements and Probabilities
The Probability Envelopes Indicator examines historical price movements and calculates probabilities based on their frequency:
The indicator first identifies and categorizes price movements into bullish (green) and bearish (red) scenarios.
It then calculates the probability of each price movement occurring by dividing the frequency of the movement by the total number of occurrences in each category (bullish or bearish).
The expected green and red movements are calculated by multiplying the probabilities by their respective price movements and summing the results.
The total expected movement, or weighted average, is calculated by combining the expected green and red movements and dividing by the total number of occurrences.
Section 4: Constructing the Probability Envelopes
The Probability Envelopes Indicator utilizes the calculated statistics to construct its bands:
The expected mean is calculated using the total expected movement and applied to the current open price.
An exponential moving average (EMA) is used to smooth the expected mean, with the smoothing length determining the degree of responsiveness.
The upper and lower bands are calculated by adding and subtracting the mean green and red movements, respectively, along with their standard deviations multiplied by a user-defined multiplier.
Section 5: Benefits of the Probability Envelopes Indicator
The Probability Envelopes Indicator offers numerous advantages to traders:
Enhanced Decision-Making: By providing probability-based estimations of future price levels, the indicator can help traders make more informed decisions and potentially improve their trading strategies.
Versatility: The indicator is applicable to various financial instruments, such as stocks, forex, commodities, and cryptocurrencies, making it a valuable tool for traders in different markets.
Customization: The indicator's parameters, including the use of log returns, multiplier values, and smoothing length, can be adjusted according to the user's preferences and trading style. This flexibility allows traders to fine-tune the Probability Envelopes Indicator to better suit their needs and goals.
Risk Management: The Probability Envelopes Indicator can be used as a component of a risk management strategy by providing insight into potential price movements. By identifying potential areas of support and resistance, traders can set stop-loss and take-profit levels more effectively.
Visualization: The graphical representation of the indicator, with its clear upper and lower bands, makes it easy for traders to quickly assess the market and potential price levels.
Section 6: Integrating the Probability Envelopes Indicator into Your Trading Strategy
When incorporating the Probability Envelopes Indicator into your trading strategy, consider the following tips:
Confirmation Signals: Use the indicator in conjunction with other technical analysis tools, such as trend lines, moving averages, or oscillators, to confirm the strength and direction of the market trend.
Timeframes: Experiment with different timeframes to find the optimal settings for your trading strategy. Keep in mind that shorter timeframes may generate more frequent signals but may also increase the likelihood of false signals.
Risk Management: Always establish a proper risk management strategy that includes setting stop-loss and take-profit levels, as well as managing your position sizes.
Backtesting: Test the Probability Envelopes Indicator on historical data to evaluate its effectiveness and fine-tune its parameters to optimize your trading strategy.
Section 7: Cons and Limitations of the Probability Envelopes Indicator
While the Probability Envelopes Indicator offers several advantages to traders, it is essential to be aware of its potential cons and limitations. Understanding these can help you make better-informed decisions when incorporating the indicator into your trading strategy.
Lagging Nature: The Probability Envelopes Indicator is primarily based on historical data and price movements. As a result, it may be less responsive to real-time changes in market conditions, and the predicted price levels may not always accurately reflect the market's current state. This lagging nature can lead to late entry and exit signals.
False Signals: As with any technical analysis tool, the Probability Envelopes Indicator can generate false signals. These occur when the indicator suggests a potential price movement, but the market does not follow through. It is crucial to use other technical analysis tools to confirm the signals and minimize the impact of false signals on your trading decisions.
Complex Statistical Concepts: The Probability Envelopes Indicator relies on complex statistical concepts and calculations, which may be challenging to grasp for some traders, particularly beginners. This complexity can lead to misunderstandings and misuse of the indicator if not adequately understood.
Overemphasis on Past Data: While historical data can be informative, relying too heavily on past performance to predict future movements can be limiting. Market conditions can change rapidly, and relying solely on past data may not provide an accurate representation of the current market environment.
No Guarantees: The Probability Envelopes Indicator, like all technical analysis tools, cannot guarantee success. It is essential to approach trading with realistic expectations and understand that no indicator or strategy can provide foolproof results.
To overcome these limitations, it is crucial to combine the Probability Envelopes Indicator with other technical analysis tools and utilize a comprehensive risk management strategy. By doing so, you can better understand the market and increase your chances of success in the ever-changing financial markets.
Section 8: Probability Envelopes Indicator vs. Bollinger Bands
Bollinger Bands and the Probability Envelopes Indicator are both technical analysis tools designed to identify potential support and resistance levels, as well as potential trend reversals. However, they differ in their underlying concepts, calculations, and applications. This section will provide a deep dive into the differences between these two indicators and how they can complement each other in a trading strategy.
Underlying Concepts and Calculations:
Bollinger Bands:
Bollinger Bands are based on a simple moving average (SMA) of the price data, with upper and lower bands plotted at a specified number of standard deviations away from the SMA.
The distance between the bands widens during periods of increased price volatility and narrows during periods of low volatility, indicating potential trend reversals or breakouts.
The standard settings for Bollinger Bands typically involve a 20-period SMA and a 2 standard deviation distance for the upper and lower bands.
Probability Envelopes Indicator:
The Probability Envelopes Indicator calculates the expected price movements based on historical data and probabilities, utilizing mean and standard deviation calculations for both upward and downward price movements.
It generates upper and lower bands based on the calculated expected mean movement and the standard deviation of historical price changes, multiplied by a user-defined multiplier.
The Probability Envelopes Indicator also allows users to choose between using log returns or percentage changes for the calculations, adding flexibility to the indicator.
Key Differences:
Calculation Method: Bollinger Bands are based on a simple moving average and standard deviations, while the Probability Envelopes Indicator uses statistical probability calculations derived from historical price changes.
Flexibility: The Probability Envelopes Indicator allows users to choose between log returns or percentage changes and adjust the multiplier, offering more customization options compared to Bollinger Bands.
Risk Management: Bollinger Bands primarily focus on volatility, while the Probability Envelopes Indicator incorporates probability calculations to provide additional insights into potential price movements, which can be helpful for risk management purposes.
Complementary Use:
Using both Bollinger Bands and the Probability Envelopes Indicator in your trading strategy can offer valuable insights into market conditions and potential price levels.
Bollinger Bands can provide insights into market volatility and potential breakouts or trend reversals based on the widening or narrowing of the bands.
The Probability Envelopes Indicator can offer additional information on the expected price movements based on historical data and probabilities, which can be helpful in anticipating potential support and resistance levels.
Combining these two indicators can help traders to better understand market dynamics and increase their chances of identifying profitable trading opportunities.
In conclusion, while both Bollinger Bands and the Probability Envelopes Indicator aim to identify potential support and resistance levels, they differ significantly in their underlying concepts, calculations, and applications. By understanding these differences and incorporating both tools into your trading strategy, you can gain a more comprehensive understanding of the market and make more informed trading decisions.
In conclusion, the Probability Envelopes Indicator is a powerful and versatile technical analysis tool that offers unique insights into expected price movements based on historical data and probability calculations. It provides traders with the ability to identify potential support and resistance levels, as well as potential trend reversals. When compared to Bollinger Bands, the Probability Envelopes Indicator offers more customization options and incorporates probability-based calculations for a different perspective on market dynamics.
Although the Probability Envelopes Indicator has its limitations and potential cons, such as the reliance on historical data and the assumption that past performance is indicative of future results, it remains a valuable addition to any trader's toolkit. By using the Probability Envelopes Indicator in conjunction with other technical analysis tools, such as Bollinger Bands, traders can gain a more comprehensive understanding of the market and make more informed trading decisions.
Ultimately, the success of any trading strategy relies on the ability to interpret and apply multiple indicators effectively. The Probability Envelopes Indicator serves as a unique and valuable tool in this regard, providing traders with a deeper understanding of the market and its potential price movements. By utilizing this indicator in combination with other tools and techniques, traders can increase their chances of success and optimize their trading strategies.
LibIndicadoresUteisLibrary "LibIndicadoresUteis"
Collection of useful indicators. This collection does not do any type of plotting on the graph, as the methods implemented can and should be used to get the return of mathematical formulas, in a way that speeds up the development of new scripts. The current version contains methods for stochastic return, slow stochastic, IFR, leverage calculation for B3 futures market, leverage calculation for B3 stock market, bollinger bands and the range of change.
estocastico(PeriodoEstocastico)
Returns the value of stochastic
Parameters:
PeriodoEstocastico : Period for calculation basis
Returns: Float with the stochastic value of the period
estocasticoLento(PeriodoEstocastico, PeriodoMedia)
Returns the value of slow stochastic
Parameters:
PeriodoEstocastico : Stochastic period for calculation basis
PeriodoMedia : Average period for calculation basis
Returns: Float with the value of the slow stochastic of the period
ifrInvenenado(PeriodoIFR, OrigemIFR)
Returns the value of the RSI/IFR Poisoned of Guima
Parameters:
PeriodoIFR : RSI/IFR period for calculation basis
OrigemIFR : Source of RSI/IFR for calculation basis
Returns: Float with the RSI/IFR value for the period
calculoAlavancagemFuturos(margem, alavancagemMaxima)
Returns the number of contracts to work based on margin
Parameters:
margem : Margin for contract unit
alavancagemMaxima : Maximum number of contracts to work
Returns: Integer with the number of contracts suggested for trading
calculoAlavancagemAcoes(alavancagemMaxima)
Returns the number of batches to work based on the margin
Parameters:
alavancagemMaxima : Maximum number of batches to work
Returns: Integer with the amount of lots suggested for trading
bandasBollinger(periodoBB, origemBB, desvioPadrao)
Returns the value of bollinger bands
Parameters:
periodoBB : Period of bollinger bands for calculation basis
origemBB : Origin of bollinger bands for calculation basis
desvioPadrao : Standard Deviation of bollinger bands for calculation basis
Returns: Two-position array with upper and lower band values respectively
theRoc(periodoROC, origemROC)
Returns the value of Rate Of Change
Parameters:
periodoROC : Period for calculation basis
origemROC : Source of calculation basis
Returns: Float with the value of Rate Of Change
MTF MA Ribbon and Bands + BB, Gaussian F. and R. VWAP with StDev█ Multi Timeframe Moving Average Ribbon and Bands + Bollinger Bands, Gaussian Filter and Rolling Volume Weighted Average Price with Standard Deviation Bands
Up to 9 moving averages can be independently applied.
The length , type and timeframe of each moving average are configurable .
The lines, colors and background fill are customizable too.
This script can also display:
Moving Average Bands
Bollinger Bands
Gaussian Filter
Rolling VWAP and Standard Deviation Bands
Types of Moving Averages:
Simple Moving Average (SMA)
Exponential Moving Average (EMA)
Smoothed Moving Average (SMMA)
Weighted Moving Average (WMA)
Volume Weighted Moving Average (VWMA)
Least Squares Moving Average (LSMA)
Hull Moving Average (HMA)
Arnaud Legoux Moving Average (ALMA)
█ Moving Average
Moving Averages are price based, lagging (or reactive) indicators that display the average price of a security over a set period of time.
A Moving Average is a good way to gauge momentum as well as to confirm trends, and define areas of support and resistance.
█ Bollinger Bands
Bollinger Bands consist of a band of three lines which are plotted in relation to security prices.
The line in the middle is usually a Simple Moving Average (SMA) set to a period of 20 days (the type of trend line and period can be changed by the trader, a 20 day moving average is by far the most popular).
The SMA then serves as a base for the Upper and Lower Bands which are used as a way to measure volatility by observing the relationship between the Bands and price.
█ Gaussian Filter
Gaussian filter can be used for smoothing.
It rejects high frequencies (fast movements) better than an EMA and has lower lag.
A Gaussian filter is one whose transfer response is described by the familiar Gaussian bell-shaped curve.
In the case of low-pass filters, only the upper half of the curve describes the filter.
The use of gaussian filters is a move toward achieving the dual goal of reducing lag and reducing the lag of high-frequency components relative to the lag of lower-frequency components.
█ Rolling VWAP
The typical VWAP is designed to be used on intraday charts, as it resets at the beginning of the day.
Such VWAPs cannot be used on daily, weekly or monthly charts. Instead, this rolling VWAP uses a time period that automatically adjusts to the chart's timeframe.
You can thus use the rolling VWAP on any chart that includes volume information in its data feed.
Because the rolling VWAP uses a moving window, it does not exhibit the jumpiness of VWAP plots that reset.
Made with the help from scripts of: adam24x, VishvaP, loxx and pmk07.

Ultimate IndicatorThis is a combination of all the price chart indicators I frequently switch between. It contains my day time highlighter (for day trading), multi-timeframe long-term trend indicator for current commodity in the bottom right, customizable trend EMA which also has multi-timeframe drawing capabilities, VWAP, customizable indicators with separate settings from the trend indicator including: EMA, HL2 over time, Donchian Channels, Keltner Channels, Bollinger Bands, and Super Trend. The settings for these are right below the trend settings and can have their length and multiplier adjusted. All of those also have multi-timeframe capabilities separate from the trend multi-time settings.
The Day Trade Highlight option will draw faint yellow between 9:15-9:25, red between 9:25-9:45, yellow between 9:45-10:05. There will be one white background at 9:30am to show the opening of the market. while the market is open there will be a very faint blue background. For the end of the day there will be yellow between 15:45-15:50, red between 15:50-16:00, and yellow between 16:00-16:05. During the night hours, there is no coloring. The purpose of this highlight is to show the opening / closing times of the market and the hot times for large moves.
The indicators can also be colored in the following ways:
1. Simple = Makes all colors for the indicator Gray
2. Trend = Will use the Donchian Channels to get the short-trend direction and by default will color the short-term direction as Blue or Red. Unless using Super Trend, the Donchian Channel is used to find short-term trend direction.
3. Trend Adv = Will use the Donchian Channels to get the short-trend direction and by default will color the short-term direction as Blue or Red. Unless using Super Trend, the Donchian Channel is used to find short-term trend direction. If there is a short-term up-trend during a long-term down-trend, the Blue will become Navy. If short-term down-trend during long-term up-trend, the Red will be Brown.
4. Squeeze = Compares the Bollinger Bands width to the Keltner Channels width and will color based on relative squeeze of the market: Teal = no squeeze. Yellow = little squeeze. Red = decent squeeze. White = huge squeeze. if you do not understand this one, try drawing the Bollinger Bands while using the Squeeze color option and it should become more apparent how this works. I also recommend leaving the length and multiplier to the default 20 and 2 if using this setting and only changing the timeframe to get longer/shorter lengths as I've seen that changing the length or multiplier can more or less make it not work at all.
Along with the indicator settings are options to draw lines/labels/fills for the indicator. I enjoy having only fills for a cleaner look.
The Labels option will show Buy/Sell signals when the short-term trend flips to agree with the long-term trend.
The Trend Bars option will do the same as the Labels option but instead will color the bars white when a Buy/Sell option is given.
The Range Bars option shows will color a bar white when the Close of a candle is outside of a respective ranging indicator option (Bollinger or Keltner).
The Trend Bars will draw white candles no matter which indicator selection you make (even "Off"). However, Range Bars will only draw white when either Bollinger or Keltner are selected.
The Donchian Channels and Super Trend are trending indicators and should be used during trending markets. I like to use the MACD in conjunction with these indicators for possibly earlier entries.
The Bollinger Bands and Keltner Channel are ranging indicators and should be used during ranging markets. I like to use the RSI in conjunction with these indicators and will use 60/40 for overbought and oversold areas rather than 70/30. During a range, I wait for an overbought or oversold indication and will buy/sell when it crosses back into the middle area and close my position when it touches the opposite band.
I have a MACD/RSI combination indicator if you'd like that as well :D
As always, trade at your own risk. This is not some secret indicator that will 100% win. As always, the trades you see in the picture use a 1:1.5 or 1:2 risk to reward ratio, for today (August 8, 2022) it won 5/6 times with one trade still open at the end of the day. Manage your account correctly and you'll win in the long term. Hit me up with any questions or suggestions. Happy Trading!

L1 Color Bollinger BandLevel: 1
Background
Bollinger bands are a type of price envelope developed by John Bollinger, where price envelopes define upper and lower price ranges. Bollinger Bands are envelopes that are represented with a standard deviation above and below a simple moving average of price. Because the spacing of the bands is based on the standard deviation, they adjust for fluctuations in the volatility of the underlying price.
Function
L1 Color Bollinger Band is a common Bollinger Band indicator in algorithm but use different color to differensiate up trend(lime), down trend(red) and sideways (yellow)
Key Signal
boll --> bollinger middle line
upper --> upper envelope
lower --> lower envelope
Pros and Cons
Pros:
1. it can easy see the sections of trends or sideways
2. it can use color change to detect a breakout or trend reversals.
Cons:
1. Some noise is still incorporated in trends
2. different trading pair may require different n1 and s1 settings
Remarks
Simple but intuitive
Readme
In real life, I am a prolific inventor. I have successfully applied for more than 60 international and regional patents in the past 12 years. But in the past two years or so, I have tried to transfer my creativity to the development of trading strategies. Tradingview is the ideal platform for me. I am selecting and contributing some of the hundreds of scripts to publish in Tradingview community. Welcome everyone to interact with me to discuss these interesting pine scripts.
The scripts posted are categorized into 5 levels according to my efforts or manhours put into these works.
Level 1 : interesting script snippets or distinctive improvement from classic indicators or strategy. Level 1 scripts can usually appear in more complex indicators as a function module or element.
Level 2 : composite indicator/strategy. By selecting or combining several independent or dependent functions or sub indicators in proper way, the composite script exhibits a resonance phenomenon which can filter out noise or fake trading signal to enhance trading confidence level.
Level 3 : comprehensive indicator/strategy. They are simple trading systems based on my strategies. They are commonly containing several or all of entry signal, close signal, stop loss, take profit, re-entry, risk management, and position sizing techniques. Even some interesting fundamental and mass psychological aspects are incorporated.
Level 4 : script snippets or functions that do not disclose source code. Interesting element that can reveal market laws and work as raw material for indicators and strategies. If you find Level 1~2 scripts are helpful, Level 4 is a private version that took me far more efforts to develop.
Level 5 : indicator/strategy that do not disclose source code. private version of Level 3 script with my accumulated script processing skills or a large number of custom functions. I had a private function library built in past two years. Level 5 scripts use many of them to achieve private trading strategy.

Nirvana True Duel전략 이름
열반의 진검승부 (영문: Nirvana True Duel)
컨셉과 철학
“열반의 진검승부”는 시장 소음은 무시하고, 확실할 때만 진입하는 전략입니다.
EMA 리본으로 추세 방향을 확인하고, 볼린저 밴드 수축/확장으로 변동성 돌파를 포착하며, OBV로 거래량 확인을 통해 가짜 돌파를 필터링합니다.
전략 로직
매수 조건 (롱)
20EMA > 50EMA (상승 추세)
밴드폭 수축 후 확장 시작
종가가 상단 밴드 돌파
OBV 상승 흐름 유지
매도 조건 (숏)
20EMA < 50EMA (하락 추세)
밴드폭 수축 후 확장 시작
종가가 하단 밴드 이탈
OBV 하락 흐름 유지
진입·청산
손절: ATR × 1.5 배수
익절: 손절폭의 1.5~2배에서 부분 청산
시간 청산: 설정한 최대 보유 봉수 초과 시 강제 청산
장점
✅ 추세·변동성·거래량 3중 필터 → 노이즈 최소화
✅ 백테스트·알람 지원 → 기계적 매매 가능
✅ 5분/15분 차트에 적합 → 단타/스윙 트레이딩 활용 가능
주의점
⚠ 횡보장에서는 신호가 적거나 실패 가능
⚠ 수수료·슬리피지 고려 필요
📜 Nirvana True Duel — Strategy Description (English)
Name:
Nirvana True Duel (a.k.a. Nirvana Cross)
Concept & Philosophy
The “Nirvana True Duel” strategy focuses on trading only meaningful breakouts and avoiding unnecessary noise.
Nirvana: A calm, patient state — waiting for the right opportunity without emotional trading.
True Duel: When the signal appears, enter decisively and let the market reveal the outcome.
In short: “Ignore market noise, trade only high-probability breakouts.”
🧩 Strategy Components
Trend Filter (EMA Ribbon): Stay aligned with the main market trend.
Volatility Squeeze (Bollinger Band): Detect volatility contraction & expansion to catch explosive moves early.
Volume Confirmation (OBV): Filter out false breakouts by confirming with volume flow.
⚔️ Entry & Exit Conditions
Long Setup:
20 EMA > 50 EMA (uptrend)
BB width breaks out from recent squeeze
Close > Upper Bollinger Band
OBV shows positive flow
Short Setup:
20 EMA < 50 EMA (downtrend)
BB width breaks out from recent squeeze
Close < Lower Bollinger Band
OBV shows negative flow
Risk Management:
Stop Loss: ATR × 1.5 below/above entry
Take Profit: 1.5–2× stop distance, partial take-profit allowed
Time Stop: Automatically closes after max bars held (e.g. 8h on 5m chart)
✅ Strengths
Triple Filtering: Trend + Volatility + Volume → fewer false signals
Mechanical & Backtestable: Ideal for objective trading & performance validation
Adaptable: Works well on Bitcoin, Nasdaq futures, and other high-volatility markets (5m/15m)
⚠️ Things to Note
Low signal frequency or higher failure rate in sideways/range markets
Commission & slippage should be factored in, especially on lower timeframes
ATR multiplier and R:R ratio should be optimized per asset

Dual Stochastic Enhanced (with Presets giua64)Script Title: Dual Stochastic Enhanced (with Presets giua64)
Overview:
This indicator enhances the traditional Dual Stochastic strategy, aiming to provide more filtered and potentially reliable trading signals. By integrating dynamic overbought/oversold levels via Bollinger Bands on the slow stochastic, a trend filter based on a moving average, momentum confirmation via RSI, and user-friendly selectable presets, "Dual Stochastic Enhanced" seeks to offer a more robust approach to identifying potential entry points.
Key Features:
Dual Stochastics: Utilizes a slow stochastic (configurable, e.g., 14 periods) as a context filter and a fast stochastic (configurable, e.g., 5 periods) as a signal trigger.
Bollinger Bands on Slow Stochastic: Instead of fixed overbought/oversold levels (80/20), Bollinger Bands are applied to the %K line of the slow stochastic. This creates dynamic zones that adapt to the stochastic's own volatility.
Trend Filter: A moving average (configurable type and length, e.g., EMA 100 as seen in the example chart for general context) on the price helps filter signals, allowing only trades aligned with the prevailing trend.
RSI Confirmation: An RSI oscillator (configurable length, e.g., 14 periods) is used to confirm momentum. Signals require the RSI to cross certain thresholds to validate the strength of the move.
User Presets: Includes presets for "Scalping," "Intraday," and "Swing trading," which quickly set all key parameters to suit different styles and timeframes. A "Custom" option is also available for full manual configuration.
Clear Visual Signals: Long (green) and Short (red) arrows appear on the chart when all entry conditions are met.
Active Zone Highlighting: The background of the indicator panel changes color (green or red) when "active zone" conditions (a combination of stochastics, trend, and RSI) are favorable.
Information Panel: A table in the top-right corner of the indicator panel displays the current status of the selected preset, trend filter, RSI value, and stochastic levels.
Signal Logic:
A LONG signal is generated when:
The fast stochastic %K crosses above its %D line.
The slow stochastic %K line is below its lower Bollinger Band (dynamic oversold condition).
The fast stochastic %K line is also in a low area (e.g., <25) to confirm the trigger is not premature.
The closing price is above the trend moving average (uptrend).
The RSI is above its long confirmation level (e.g., >40), indicating sufficient bullish momentum.
A SHORT signal is generated when:
The fast stochastic %K crosses below its %D line.
The slow stochastic %K line is above its upper Bollinger Band (dynamic overbought condition).
The fast stochastic %K line is also in a high area (e.g., >75).
The closing price is below the trend moving average (downtrend).
The RSI is below its short confirmation level (e.g., <60), indicating sufficient bearish momentum.
How to Use:
Select a Preset suitable for your trading style and the timeframe you are analyzing (e.g., Scalping for M1-M15, Intraday for M5-H1, Swing for H4-D1).
Alternatively, choose "Custom" and manually adjust all parameters (stochastic lengths, smoothing, Bollinger Bands, Moving Average, RSI, confirmation thresholds).
Observe the Information Panel for a quick understanding of the current conditions.
Evaluate the arrow signals, always considering the broader market context, price action, and any other confluences (supports/resistances, chart patterns).
The background highlighting can help quickly identify periods where conditions are aligned for potential trades.
Disclaimer:
This script is provided for educational and informational purposes only. Trading involves significant risk, and past performance is not indicative of future results. Always thoroughly test any strategy or indicator on historical data and on a demo account before risking real capital. The author assumes no responsibility for any losses incurred from the use of this script.
Author: giua64

Reversal Trading Bot Strategy[BullByte]Overview :
The indicator Reversal Trading Bot Strategy is crafted to capture potential market reversal points by combining momentum, volatility, and trend alignment filters. It uses a blend of technical indicators to identify both bullish and bearish reversal setups, ensuring that multiple market conditions are met before entering a trade.
Core Components :
Technical Indicators Used :
RSI (Relative Strength Index) :
Purpose : Detects divergence conditions by comparing recent lows/highs in price with the RSI.
Parameter : Length of 8.
Bollinger Bands (BB) :
Purpose : Measures volatility and identifies price levels that are statistically extreme.
Parameter : Length of 20 and a 2-standard deviation multiplier.
ADX (Average Directional Index) & DMI (Directional Movement Index) :
Purpose : Quantifies the strength of the trend. The ADX threshold is set at 20, and additional filters check for the alignment of the directional indicators (DI+ and DI–).
ATR (Average True Range) :
Purpose : Provides a volatility measure used to set stop levels and determine risk through trailing stops.
Volume SMA (Simple Moving Average of Volume ):
Purpose : Helps confirm strength by comparing the current volume against a 20-period average, with an optional filter to ensure volume is at least twice the SMA.
User-Defined Toggle Filters :
Volume Filter : Confirms that the volume is above average (or twice the SMA) before taking trades.
ADX Trend Alignment Filter : Checks that the ADX’s directional indicators support the trade direction.
BB Close Confirmation : Optionally refines the entry by requiring price to be beyond the upper or lower Bollinger Band rather than just above or below.
RSI Divergence Exit : Allows the script to close positions if RSI divergence is detected.
BB Mean Reversion Exit : Closes positions if the price reverts to the Bollinger Bands’ middle line.
Risk/Reward Filter : Ensures that the potential reward is at least twice the risk by comparing the distance to the Bollinger Band with the ATR.
Candle Movement Filter : Optional filter to require a minimum percentage move in the candle to confirm momentum.
ADX Trend Exit : Closes positions if the ADX falls below the threshold and the directional indicators reverse.
Entry Conditions :
Bullish Entry :
RSI Divergence : Checks if the current close is lower than a previous low while the RSI is above the previous low, suggesting bullish divergence.
Bollinger Confirmation : Requires that the price is above the lower (or upper if confirmation is toggled) Bollinger Band.
Volume & Trend Filters : Combines volume condition, ADX strength, and an optional candle momentum condition.
Risk/Reward Check : Validates that the trade meets a favorable risk-to-reward ratio.
Bearish Entry :
Uses a mirror logic of the bullish entry by checking for bearish divergence, ensuring the price is below the appropriate Bollinger level, and confirming volume, trend strength, candle pattern, and risk/reward criteria.
Trade Execution and Exit Strateg y:
Trade Execution :
Upon meeting the entry conditions, the strategy initiates a long or short position.
Stop Loss & Trailing Stops :
A stop-loss is dynamically set using the ATR value, and trailing stops are implemented as a percentage of the close price.
Exit Conditions :
Additional exit filters can trigger early closures based on RSI divergence, mean reversion (via the middle Bollinger Band), or a weakening trend as signaled by ADX falling below its threshold.
This multi-layered exit strategy is designed to lock in gains or minimize losses if the market begins to reverse unexpectedly.
How the Strategy Works in Different Market Conditions :
Trending Markets :
The ADX filter ensures that trades are only taken when the trend is strong. When the market is trending, the directional movement indicators help confirm the momentum, making the reversal signal more reliable.
Ranging Markets :
In choppy markets, the Bollinger Bands expand and contract, while the RSI divergence can highlight potential turning points. The optional filters can be adjusted to avoid false signals in low-volume or low-volatility conditions.
Volatility Management :
With ATR-based stop-losses and a risk/reward filter, the strategy adapts to current market volatility, ensuring that risk is managed consistently.
Recommendation on using this Strategy with a Trading Bot :
This strategy is well-suited for high-frequency trading (HFT) due to its ability to quickly identify reversal setups and execute trades dynamically with automated stop-loss and trailing exits. By integrating this script with a TradingView webhook-based bot or an API-driven execution system, traders can automate trade entries and exits in real-time, reducing manual execution delays and capitalizing on fast market movements.
Disclaimer :
This script is provided for educational and informational purposes only. It is not intended as investment advice. Trading involves significant risk, and you should always conduct your own research and analysis before making any trading decisions. The author is not responsible for any losses incurred while using this script.

Multi-indicator Signal Builder [Skyrexio]Overview
Multi-Indicator Signal Builder is a versatile, all-in-one script designed to streamline your trading workflow by combining multiple popular technical indicators under a single roof. It features a single-entry, single-exit logic, intrabar stop-loss/take-profit handling, an optional time filter, a visually accessible condition table, and a built-in statistics label. Traders can choose any combination of 12+ indicators (RSI, Ultimate Oscillator, Bollinger %B, Moving Averages, ADX, Stochastic, MACD, PSAR, MFI, CCI, Heikin Ashi, and a “TV Screener” placeholder) to form entry or exit conditions. This script aims to simplify strategy creation and analysis, making it a powerful toolkit for technical traders.
Indicators Overview
1. RSI (Relative Strength Index)
Measures recent price changes to evaluate overbought or oversold conditions on a 0–100 scale.
2. Ultimate Oscillator (UO)
Uses weighted averages of three different timeframes, aiming to confirm price momentum while avoiding false divergences.
3. Bollinger %B
Expresses price relative to Bollinger Bands, indicating whether price is near the upper band (overbought) or lower band (oversold).
4. Moving Average (MA)
Smooths price data over a specified period. The script supports both SMA and EMA to help identify trend direction and potential crossovers.
5. ADX (Average Directional Index)
Gauges the strength of a trend (0–100). Higher ADX signals stronger momentum, while lower ADX indicates a weaker trend.
6. Stochastic
Compares a closing price to a price range over a given period to identify momentum shifts and potential reversals.
7. MACD (Moving Average Convergence/Divergence)
Tracks the difference between two EMAs plus a signal line, commonly used to spot momentum flips through crossovers.
8. PSAR (Parabolic SAR)
Plots a trailing stop-and-reverse dot that moves with the trend. Often used to signal potential reversals when price crosses PSAR.
9. MFI (Money Flow Index)
Similar to RSI but incorporates volume data. A reading above 80 can suggest overbought conditions, while below 20 may indicate oversold.
10. CCI (Commodity Channel Index)
Identifies cyclical trends or overbought/oversold levels by comparing current price to an average price over a set timeframe.
11. Heikin Ashi
A type of candlestick charting that filters out market noise. The script uses a streak-based approach (multiple consecutive bullish or bearish bars) to gauge mini-trends.
12. TV Screener
A placeholder condition designed to integrate external buy/sell logic (like a TradingView “Buy” or “Sell” rating). Users can override or reference external signals if desired.
Unique Features
1. Multi-Indicator Entry and Exit
You can selectively enable any subset of 12+ classic indicators, each with customizable parameters and conditions. A position opens only if all enabled entry conditions are met, and it closes only when all enabled exit conditions are satisfied, helping reduce false triggers.
2. Single-Entry / Single-Exit with Intrabar SL/TP
The script supports a single position at a time. Once a position is open, it monitors intrabar to see if the price hits your stop-loss or take-profit levels before the bar closes, making results more realistic for fast-moving markets.
3. Time Window Filter
Users may specify a start/end date range during which trades are allowed, making it convenient to focus on specific market cycles for backtesting or live trading.
4. Condition Table and Statistics
A table at the bottom of the chart lists all active entry/exit indicators. Upon each closed trade, an integrated statistics label displays net profit, total trades, win/loss count, average and median PnL, etc.
5. Seamless Alerts and Automation
Configure alerts in TradingView using “Any alert() function call.”
The script sends JSON alert messages you can route to your own webhook.
The indicator can be integrated with Skyrexio alert bots to automate execution on major cryptocurrency exchanges
6. Optional MA/PSAR Plots
For added visual clarity, optionally plot the chosen moving averages or PSAR on the chart to confirm signals without stacking multiple indicators.
Methodology
1. Multi-Indicator Entry Logic
When multiple entry indicators are enabled (e.g., RSI + Stochastic + MACD), the script requires all signals to align before generating an entry. Each indicator can be set for crossovers, crossunders, thresholds (above/below), etc. This “AND” logic aims to filter out low-confidence triggers.
2. Single-Entry Intrabar SL/TP
One Position At a Time: Once an entry signal triggers, a trade opens at the bar’s close.
Intrabar Checks: Stop-loss and take-profit levels (if enabled) are monitored on every tick. If either is reached, the position closes immediately, without waiting for the bar to end.
3. Exit Logic
All Conditions Must Agree: If the trade is still open (SL/TP not triggered), then all enabled exit indicators must confirm a closure before the script exits on the bar’s close.
4. Time Filter
Optional Trading Window: You can activate a date/time range to constrain entries and exits strictly to that interval.
Justification of Methodology
Indicator Confluence: Combining multiple tools (RSI, MACD, etc.) can reduce noise and false signals.
Intrabar SL/TP: Capturing real-time spikes or dips provides a more precise reflection of typical live trading scenarios.
Single-Entry Model: Straightforward for both manual and automated tracking (especially important in bridging to bots).
Custom Date Range: Helps refine backtesting for specific market conditions or to avoid known irregular data periods.
How to Use
1. Add the Script to Your Chart
In TradingView, open Indicators , search for “Multi-indicator Signal Builder”.
Click to add it to your chart.
2. Configure Inputs
Time Filter: Set a start and end date for trades.
Alerts Messages: Input any JSON or text payload needed by your external service or bot.
Entry Conditions: Enable and configure any indicators (e.g., RSI, MACD) for a confluence-based entry.
Close Conditions: Enable exit indicators, along with optional SL (negative %) and TP (positive %) levels.
3. Set Up Alerts
In TradingView, select “Create Alert” → Condition = “Any alert() function call” → choose this script.
Entry Alert: Triggers on the script’s entry signal.
Close Alert: Triggers on the script’s close signal (or if SL/TP is hit).
Skyrexio Alert Bots: You can route these alerts via webhook to Skyrexio alert bots to automate order execution on major crypto exchanges (or any other supported broker).
4. Visual Reference
A condition table at the bottom summarizes active signals.
Statistics Label updates automatically as trades are closed, showing PnL stats and distribution metrics.
Backtesting Guidelines
Symbol/Timeframe: Works on multiple assets and timeframes; always do thorough testing.
Realistic Costs: Adjust commissions and potential slippage to match typical exchange conditions.
Risk Management: If using the built-in stop-loss/take-profit, set percentages that reflect your personal risk tolerance.
Longer Test Horizons: Verify performance across diverse market cycles to gauge reliability.
Example of statistic calculation
Test Period: 2023-01-01 to 2025-12-31
Initial Capital: $1,000
Commission: 0.1%, Slippage ~5 ticks
Trade Count: 468 (varies by strategy conditions)
Win rate: 76% (varies by strategy conditions)
Net Profit: +96.17% (varies by strategy conditions)
Disclaimer
This indicator is provided strictly for informational and educational purposes .
It does not constitute financial or trading advice.
Past performance never guarantees future results.
Always test thoroughly in demo environments before using real capital.
Enjoy exploring the Multi-Indicator Signal Builder! Experiment with different indicator combinations and adjust parameters to align with your trading preferences, whether you trade manually or link your alerts to external automation services. Happy trading and stay safe!

Forex Pair Yield Momentum This Pine Script strategy leverages yield differentials between the 2-year government bond yields of two countries to trade Forex pairs. Yield spreads are widely regarded as a fundamental driver of currency movements, as highlighted by international finance theories like the Interest Rate Parity (IRP), which suggests that currencies with higher yields tend to appreciate due to increased capital flows:
1. Dynamic Yield Spread Calculation:
• The strategy dynamically calculates the yield spread (yield_a - yield_b) for the chosen Forex pair.
• Example: For GBP/USD, the spread equals US 2Y Yield - UK 2Y Yield.
2. Momentum Analysis via Bollinger Bands:
• Yield momentum is computed as the difference between the current spread and its moving
Bollinger Bands are applied to identify extreme deviations:
• Long Entry: When momentum crosses below the lower band.
• Short Entry: When momentum crosses above the upper band.
3. Reversal Logic:
• An optional checkbox reverses the trading logic, allowing long trades at the upper band and short trades at the lower band, accommodating different market conditions.
4. Trade Management:
• Positions are held for a predefined number of bars (hold_periods), and each trade uses a fixed contract size of 100 with a starting capital of $20,000.
Theoretical Basis:
1. Yield Differentials and Currency Movements:
• Empirical studies, such as Clarida et al. (2009), confirm that interest rate differentials significantly impact exchange rate dynamics, especially in carry trade strategies .
• Higher-yields tend to appreciate against lower-yielding currencies due to speculative flows and demand for higher returns.
2. Bollinger Bands for Momentum:
• Bollinger Bands effectively capture deviations in yield momentum, identifying opportunities where price returns to equilibrium (mean reversion) or extends in trend-following scenarios (momentum breakout).
• As Bollinger (2001) emphasized, this tool adapts to market volatility by dynamically adjusting thresholds .
References:
1. Dornbusch, R. (1976). Expectations and Exchange Rate Dynamics. Journal of Political Economy.
2. Obstfeld, M., & Rogoff, K. (1996). Foundations of International Macroeconomics.
3. Clarida, R., Davis, J., & Pedersen, N. (2009). Currency Carry Trade Regimes. NBER.
4. Bollinger, J. (2001). Bollinger on Bollinger Bands.
5. Mendelsohn, L. B. (2006). Forex Trading Using Intermarket Analysis.

Williams BBDiv Signal [trade_lexx]📈 Williams BBDiv Signal — Improve your trading strategy with accurate signals!
Introducing Williams BBDiv Signal , an advanced trading indicator designed for a comprehensive analysis of market conditions. This indicator combines Williams%R with Bollinger Bands, providing traders with a powerful tool for generating buy and sell signals, as well as detecting divergences. It is ideal for traders who need an advantage in detecting changing trends and market conditions.
🔍 How signals work
— A buy signal is generated when the Williams %R line crosses the lower Bollinger Bands band from bottom to top. This indicates that the market may be oversold and ready for a rebound. They are displayed as green triangles located under the Williams %R graph. On the main chart, buy signals are displayed as green triangles labeled "Buy" under candlesticks.
— A sell signal is generated when the Williams %R line crosses the upper Bollinger Bands band from top to bottom. This indicates that the market may be overbought and ready for a correction. They are displayed as red triangles located above the Williams %R chart. On the main chart, the sell signals are displayed as red triangles with the word "Sell" above the candlesticks.
— Minimum Bars Between Signals
The user can adjust the minimum number of bars between the signals to avoid false signals. This helps to filter out noise and improve signal quality.
— Mode "Wait for Opposite Signal"
In this mode, buy and sell signals are generated only after receiving the opposite signal. This adds an additional level of filtering and helps to avoid false alarms.
— Mode "Overbought and Oversold Zones"
A buy signal is generated only when Williams %R is below the -80 level (Lower Band). A sell signal is generated only when Williams %R is above -20 (Upper Band).
📊 Divergences
— Bullish divergence occurs when Williams%R shows a higher low while price shows a lower low. This indicates a possible upward reversal. They are displayed as green lines and labels labeled "Bull" on the Williams %R chart. On the main chart, bullish divergences are displayed as green triangles labeled "Bull" under candlesticks.
— A bearish divergence occurs when Williams %R shows a lower high, while the price shows a higher high. This indicates a possible downward reversal. They are displayed as red lines and labels labeled "Bear" on the Williams %R chart. On the main chart, bearish divergences are displayed as red triangles with the word "Bear" above the candlesticks.
— 🔌Connector Signal🔌 and 🔌Connector Divergence🔌
It allows you to connect the indicator to trading strategies and test signals throughout the trading history. This makes the indicator an even more powerful tool for traders who want to test the effectiveness of their strategies on historical data.
🔔 Alerts
The indicator provides the ability to set up alerts for buy and sell signals, as well as for divergences. This allows traders to keep abreast of important market developments without having to constantly monitor the chart.
🎨 Customizable Appearance
Customize the appearance of Williams BBDiv Signal according to your preferences to make the analysis more convenient and visually pleasing. In the indicator settings section, you can change the colors of the buy and sell signals, as well as divergences, so that they stand out on the chart and are easily visible.
🔧 How it works
— The indicator starts by calculating the Williams %R and Bollinger Bands values for a certain period to assess market conditions. Initial assumptions are introduced for overbought and oversold levels, as well as for the standard deviation of the Bollinger Bands. The indicator then analyzes these values to generate buy and sell signals. This classification helps to determine the appropriate level of volatility for signal calculation. As the market evolves, the indicator dynamically adjusts, providing information about the trend and volatility in real time.
Quick Guide to Using Williams BBDiv Signal
— Add the indicator to your favorites by clicking on the star icon. Adjust the parameters, such as the period length for Williams %R, the type of moving average and the standard deviation for Bollinger Bands, according to your trading style. Or leave all the default settings.
— Adjust the signal filters to improve the quality of the signals and avoid false alarms, adjust the filters in the "Signal Settings" section.
— Turn on alerts so that you don't miss important trading opportunities and don't constantly sit at the chart, set up alerts for buy and sell signals, as well as for divergences. This will allow you to keep abreast of all key market developments and respond to them in a timely manner, without being distracted from other business.
— Use signals. They will help you determine the optimal entry and exit points for your positions. Also, pay attention to bullish and bearish divergences, which may indicate possible market reversals and provide additional trading opportunities.
— Use the 🔌Connector🔌 for deeper analysis and verification of the effectiveness of signals, connect it to your trading strategies. This will allow you to test signals throughout the trading history and evaluate their accuracy based on historical data. Include the indicator in your trading strategy and run testing to see how buy and sell signals have worked in the past. Analyze the test results to determine how reliable the signals are and how they can improve your trading strategy. This will help you make better informed decisions and increase your trading efficiency.

VIDYA ProTrend Multi-Tier ProfitHello! This time is about a trend-following system.
VIDYA is quite an interesting indicator that adjusts dynamically to market volatility, making it more responsive to price changes compared to traditional moving averages. Balancing adaptability and precision, especially with the more aggressive short trade settings, challenged me to fine-tune the strategy for a variety of market conditions.
█ Introduction and How it is Different
The "VIDYA ProTrend Multi-Tier Profit" strategy is a trend-following system that combines the VIDYA (Variable Index Dynamic Average) indicator with Bollinger Bands and a multi-step take-profit mechanism.
Unlike traditional trend strategies, this system allows for more adaptive profit-taking, adjusting for long and short positions through distinct ATR-based and percentage-based targets. The innovation lies in its dynamic multi-tier approach to profit-taking, especially for short trades, where more aggressive percentages are applied using a multiplier. This flexibility helps adapt to various market conditions by optimizing trade management and profit allocation based on market volatility and trend strength.
BTCUSD 6hr performance
█ Strategy, How it Works: Detailed Explanation
The core of the "VIDYA ProTrend Multi-Tier Profit" strategy lies in the dual VIDYA indicators (fast and slow) that analyze price trends while accounting for market volatility. These indicators work alongside Bollinger Bands to filter trade entries and exits.
🔶 VIDYA Calculation
The VIDYA indicator is calculated using the following formula:
Smoothing factor (𝛼):
alpha = 2 / (Length + 1)
VIDYA formula:
VIDYA(t) = alpha * k * Price(t) + (1 - alpha * k) * VIDYA(t-1)
Where:
k = |Chande Momentum Oscillator (MO)| / 100
🔶 Bollinger Bands as a Volatility Filter
Bollinger Bands are calculated using a rolling mean and standard deviation of price over a specified period:
Upper Band:
BB_upper = MA + (K * stddev)
Lower Band:
BB_lower = MA - (K * stddev)
Where:
MA is the moving average,
K is the multiplier (typically 2), and
stddev is the standard deviation of price over the Bollinger Bands length.
These bands serve as volatility filters to identify potential overbought or oversold conditions, aiding in the entry and exit logic.
🔶 Slope Calculation for VIDYA
The slopes of both fast and slow VIDYAs are computed to assess the momentum and direction of the trend. The slope for a given VIDYA over its length is:
Slope = (VIDYA(t) - VIDYA(t-n)) / n
Where:
n is the length of the lookback period. Positive slope indicates bullish momentum, while negative slope signals bearish momentum.
LOCAL picture
🔶 Entry and Exit Conditions
- Long Entry: Occurs when the price moves above the slow VIDYA and the fast VIDYA is trending upward. Bollinger Bands confirm the signal when the price crosses the upper band, indicating bullish strength.
- Short Entry: Happens when the price drops below the slow VIDYA and the fast VIDYA trends downward. The signal is confirmed when the price crosses the lower Bollinger Band, showing bearish momentum.
- Exit: Based on VIDYA slopes flattening or reversing, or when the price hits specific ATR or percentage-based profit targets.
🔶 Multi-Step Take Profit Mechanism
The strategy incorporates three levels of take profit for both long and short trades:
- ATR-based Take Profit: Each step applies a multiple of the ATR (Average True Range) to the entry price to define the exit point.
The first level of take profit (long):
TP_ATR1_long = Entry Price + (2.618 * ATR)
etc.
█ Trade Direction
The strategy offers flexibility in defining the trading direction:
- Long: Only long trades are considered based on the criteria for upward trends.
- Short: Only short trades are initiated in bearish trends.
- Both: The strategy can take both long and short trades depending on the market conditions.
█ Usage
To use the strategy effectively:
- Adjust the VIDYA lengths (fast and slow) based on your preference for trend sensitivity.
- Use Bollinger Bands as a filter for identifying potential breakout or reversal scenarios.
- Enable the multi-step take profit feature to manage positions dynamically, allowing for partial exits as the price reaches specified ATR or percentage levels.
- Leverage the short trade multiplier for more aggressive take profit levels in bearish markets.
This strategy can be applied to different asset classes, including equities, forex, and cryptocurrencies. Adjust the input parameters to suit the volatility and characteristics of the asset being traded.
█ Default Settings
The default settings for this strategy have been designed for moderate to trending markets:
- Fast VIDYA Length (10): A shorter length for quick responsiveness to price changes. Increasing this length will reduce noise but may delay signals.
- Slow VIDYA Length (30): The slow VIDYA is set longer to capture broader market trends. Shortening this value will make the system more reactive to smaller price swings.
- Minimum Slope Threshold (0.05): This threshold helps filter out weak trends. Lowering the threshold will result in more trades, while raising it will restrict trades to stronger trends.
Multi-Step Take Profit Settings
- ATR Multipliers (2.618, 5.0, 10.0): These values define how far the price should move before taking profit. Larger multipliers widen the profit-taking levels, aiming for larger trend moves. In higher volatility markets, these values might be adjusted downwards.
- Percentage Levels (3%, 8%, 17%): These percentage levels define how much the price must move before taking profit. Increasing the percentages will capture larger moves, while smaller percentages offer quicker exits.
- Short TP Multiplier (1.5): This multiplier applies more aggressive take profit levels for short trades. Adjust this value based on the aggressiveness of your short trade management.
Each of these settings directly impacts the performance and risk profile of the strategy. Shorter VIDYA lengths and lower slope thresholds will generate more trades but may result in more whipsaws. Higher ATR multipliers or percentage levels can delay profit-taking, aiming for larger trends but risking partial gains if the trend reverses too early.

Multi-timeframe 24 moving averages + BB+SAR+Supertrend+VWAP █ OVERVIEW
The script allows to display up to 24 moving averages ("MA"'s) across 5 timeframes plus two bands (Bollinger Bands or Supertrend or Parabolic SAR or VWAP bands) each from its own timeframe.
The main difference of this script from many similar ones is the flexibility of its settings:
- Bulk enable/disable and/or change properties of several MAs at once.
- Save 3 of your frequently used templates as presets using CSV text configurations.
█ HOW TO USE
Some use examples:
In order to "show 31, 50, 200 EMAs and 20, 100, 200 SMAs for each of 1H, 4H, D, W, M timeframes using blue for short MA, yellow for mid MA and red for long MA" use the settings as shown on a screenshot below.
In order to "Show a band of chart timeframe MA's of lengths 5, 8, 13, 21, 34, 55, 100 and 200 plus some 1H, 4H, D and W MAs. Be able to quickly switch off the band of chart tf's MAs. For chart timeframe MA's only show labels for 21, 100 and 200 EMAs". You can set TF1 and TF2 to chart's TF and set you fib MAs there and configure fixed higher timeframe MAs using TF3, TF4 and TF5 (e.g. using 1H, D and W timeframes and using 1H 800 in place of 4H 200 MA). However, quicker way may be using CSV - the syntax is very simple and intuitive, see Preset 2 as it comes in the script. You can easily switch chart tf's band of MAs by toggling on/off your chart timeframe TF's (in our example, TF1 and TF2).
The settings are either obvious or explained in tooltips.
Note 1: When using group settings and CSV presets do not forget that individual setting affected will no have any effect. So, if some setting does not work, check whether it is overridden with some group setting or a CSV preset.
Note 2: Sometimes you can notice parts of MA's hanging in the air, not lasting up to the last bar. This is not a bug as explained on this screenshot:
█ FOR DEVELOPERS
The script is a use case of my CSVParser library, which in turn uses Autotable library, both of which I hope will be quite helpful. Autotable is so powerful and comprehensive that you will hardly ever wish to use normal table functions again for complex tables.
The indicator was inspired by Pablo Limonetti's url=https://www.tradingview.com/script/nFs56VUZ/]Multi Timeframe Moving Averages and Raging @RagingRocketBull's # Multi SMA EMA WMA HMA BB (5x8 MAs Bollinger Bands) MAX MTF - RRB

Uptrick: Market MoodsThe "Uptrick: Market Moods" indicator is an advanced technical analysis tool designed for the TradingView platform. It combines three powerful indicators—Relative Strength Index (RSI), Average True Range (ATR), and Bollinger Bands—into one cohesive framework, aimed at helping traders better understand and interpret market sentiment. By capturing shifts in the emotional climate of the market, it provides a holistic view of market conditions, which can range from calm to stressed or even highly excited. This multi-dimensional analysis tool stands apart from traditional single-indicator approaches by offering a more complete picture of market dynamics, making it a valuable resource for traders looking to anticipate and react to changes in market behavior.
The RSI in the "Uptrick: Market Moods" indicator is used to measure momentum. RSI is an essential component of many technical analysis strategies, and in this tool, it is used to identify potential market extremes. When RSI values are high, they indicate an overbought condition, meaning the market may be approaching a peak. Conversely, low RSI values suggest an oversold condition, signaling that the market could be nearing a bottom. These extremes provide crucial clues about shifts in market sentiment, helping traders gauge whether the current emotional state of the market is likely to result in a reversal. This understanding is pivotal in predicting whether the market is transitioning from calm to stressed or from excited to overbought.
The Average True Range adds another layer to this analysis by offering insights into market volatility. Volatility is a key factor in understanding the mood of the market, as periods of high volatility often reflect high levels of excitement or stress, while low volatility typically indicates a calm, steady market. ATR is calculated based on the range of price movements over a given period, and the higher the value, the more volatile the market is. The "Uptrick: Market Moods" indicator uses ATR to dynamically gauge volatility levels, helping traders understand whether the market is currently moving in a way that aligns with its emotional mood. For example, an increase in ATR accompanied by an RSI value that indicates overbought conditions could suggest that the market is in a highly excited state, with the potential for either strong momentum continuation or a sharp reversal.
Bollinger Bands complement these tools by providing visual cues about price volatility and the range within which the market is likely to move. Bollinger Bands plot two standard deviations away from a simple moving average of the price. This banding technique helps traders visualize how far the price is likely to deviate from its average over a certain period. The "Uptrick: Market Moods" indicator uses Bollinger Bands to establish price boundaries and identify breakout conditions. When prices break above the upper band or below the lower band, it often signals that the market is either highly stressed or excited. This breakout condition serves as a visual representation of the market mood, alerting traders to moments when prices are moving beyond typical ranges and when significant emotional shifts are occurring in the market.
Technically, the "Uptrick: Market Moods" indicator has been developed using TradingView’s Pine Script language, a highly efficient language for building custom indicators. It employs functions like ta.rsi, ta.atr, and ta.sma to perform the necessary calculations. The use of these built-in functions ensures that the calculations are both accurate and efficient, allowing the indicator to operate in real-time without lagging, even in volatile market conditions. The ta.rsi function is used to compute the Relative Strength Index, while ta.atr calculates the Average True Range, and ta.sma is used to smooth out price data for the Bollinger Bands. These functions are applied dynamically within the script, allowing the "Uptrick: Market Moods" indicator to respond to changes in market conditions in real time.
The user interface of the "Uptrick: Market Moods" indicator is designed to provide a visually intuitive experience. The market mood is color-coded on the chart, making it easy for traders to identify whether the market is calm, stressed, or excited at a glance. This feature is especially useful for traders who need to make quick decisions in fast-moving markets. Additionally, the indicator includes an interactive table that updates in real-time, showing the most recent mood state and its frequency. This provides valuable statistical insights into market behavior over specific time frames, helping traders track the dominant emotional state of the market. Whether the market is in a prolonged calm state or rapidly transitioning through moods, this real-time feedback offers actionable data that can help traders adjust their strategies accordingly.
The RSI component of the "Uptrick: Market Moods" indicator helps detect the speed and direction of price movements, offering insight into whether the market is approaching extreme conditions. By providing signals based on overbought and oversold levels, the RSI helps traders decide whether to enter or exit positions. The ATR element acts as a volatility gauge, dynamically adjusting traders’ expectations in response to changes in market volatility. Meanwhile, the Bollinger Bands help identify trends and potential breakout conditions, serving as an additional confirmation tool that highlights when the price has moved beyond normal boundaries, indicating heightened market excitement or stress.
Despite the robust capabilities of the "Uptrick: Market Moods" indicator, it does have limitations. In markets affected by sudden shifts, such as those driven by major news events or external economic factors, the indicator’s performance may not always be reliable. These external factors can cause rapid mood swings that are difficult for any technical analysis tool to fully anticipate. Additionally, the indicator’s complexity may pose a learning curve for novice traders, particularly those who are unfamiliar with the concepts of RSI, ATR, and Bollinger Bands. However, with practice, traders can become proficient in using the tool to its full potential, leveraging the insights it provides to better navigate market shifts.
For traders seeking a deeper understanding of market sentiment, the "Uptrick: Market Moods" indicator is an invaluable resource. It is recommended for those dealing with medium to high volatility instruments, where understanding emotional shifts can offer a strategic advantage. While it can be used on its own, integrating it with other forms of analysis, such as fundamental analysis and additional technical indicators, can enhance its effectiveness. By confirming signals with other tools, traders can reduce the likelihood of false signals and improve their overall trading strategy.
To further enhance the accuracy of the "Uptrick: Market Moods" indicator, it can be integrated with volume-based tools like Volume Profile or On-Balance Volume (OBV). This combination allows traders to confirm the moods identified by the indicator with volume data, providing additional confirmation of market sentiment. For example, when the market is in an excited mood, an increase in trading volume could reinforce the reliability of that signal. Conversely, if the market is stressed but volume remains low, traders may want to proceed with caution. Using multiple indicators together creates a more comprehensive trading approach, helping traders better manage risk and make informed decisions based on multiple data points.
In conclusion, the "Uptrick: Market Moods" indicator is a powerful and unique addition to the suite of technical analysis tools available on TradingView. It provides traders with a multi-dimensional view of market sentiment by combining the analytical strengths of RSI, ATR, and Bollinger Bands into a single tool. Its ability to capture and interpret the emotional mood of the market makes it an essential tool for traders seeking to gain an edge in understanding market behavior. While the indicator has certain limitations, particularly in rapidly shifting markets, its ability to provide real-time insights into market sentiment is a valuable asset for traders of all experience levels. Used in conjunction with other tools and sound trading practices, the "Uptrick: Market Moods" indicator offers a comprehensive solution for navigating the complexities of financial markets.

Supertrend + BB + Consecutive Candles + QQE + EMA [Pineify]Overview
This indicator, developed by Pineify, is a comprehensive tool designed to assist traders in making informed decisions by combining multiple technical analysis methods. It integrates Supertrend, Bollinger Bands (BB), Consecutive Candles, Quantitative Qualitative Estimation (QQE), and Exponential Moving Averages (EMA) into a single, cohesive script. This multi-faceted approach allows traders to analyze market trends, volatility, and potential buy/sell signals with greater accuracy.
Key Features
1. Supertrend: Utilizes the Supertrend indicator to identify the prevailing market trend. It provides clear buy and sell signals based on the direction of the trend.
2. Bollinger Bands (BB): Measures market volatility and identifies overbought or oversold conditions. The script calculates the middle, upper, and lower bands, along with the Bollinger Band Width (BBW) and Bollinger Band %B (BBR).
3. Consecutive Candles: Detects sequences of consecutive bullish or bearish candles, providing signals when a specified number of consecutive candles are detected.
4. Quantitative Qualitative Estimation (QQE): Combines the Relative Strength Index (RSI) with a smoothing factor to generate buy and sell signals based on the QQE methodology.
5. Exponential Moving Averages (EMA): Includes both fast and slow EMAs to identify potential crossovers, which are used as buy and sell signals.
How It Works
- Supertrend: The Supertrend indicator is calculated using a factor and ATR length. It plots the trend direction and generates buy/sell signals when the trend changes.
- Bollinger Bands: The BB indicator calculates the middle band as a Simple Moving Average (SMA) of the closing prices. The upper and lower bands are derived by adding and subtracting a multiple of the standard deviation from the middle band.
- Consecutive Candles: This feature counts the number of consecutive candles that close higher or lower than the previous candle. When the count reaches a specified threshold, it generates a buy or sell signal.
- QQE: The QQE indicator smooths the RSI values and calculates the QQE Fast and QQE Slow lines. Buy and sell signals are generated based on the crossover of these lines.
- EMA: The script calculates fast and slow EMAs and generates buy/sell signals based on their crossovers.
How to Use
1. Inputs: Customize the indicator settings through the input parameters:
- Supertrend Factor and ATR Length
- BB Length
- Consecutive Candles Counting
- QQE RSI Length
- Fast and Slow EMA Lengths
- Enable/Disable Alerts for various signals
2. Alerts: Set up alerts for Supertrend, Consecutive Candles, and EMA crossovers. Alerts can be enabled or disabled based on user preference.
3. Visualization: The indicator plots the Supertrend, Bollinger Bands, and EMA lines on the chart. It also marks buy and sell signals with arrows and labels for easy identification.
Concepts Underlying Calculations
- Supertrend: Based on the Average True Range (ATR) to determine the trend direction and potential reversal points.
- Bollinger Bands: Utilizes standard deviation to measure market volatility and identify overbought/oversold conditions.
- Consecutive Candles: A method to detect momentum by counting consecutive bullish or bearish candles.
- QQE: Enhances the traditional RSI by smoothing it and using a dynamic threshold to generate signals.
- EMA: A widely used moving average that gives more weight to recent prices, making it responsive to market changes.
This indicator is a powerful tool for traders looking to combine multiple technical analysis methods into a single, easy-to-use script. By integrating these diverse techniques, it provides a comprehensive view of market conditions and potential trading opportunities.
