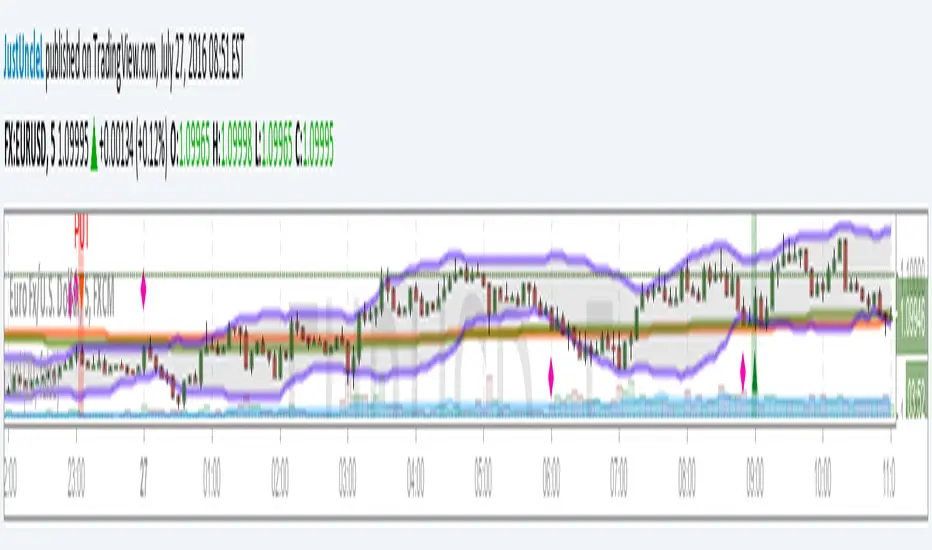
Bollinger Band and Moving Average v0.1 by JustUncleLThis is another Bollinger Band strategy+indicator in my series of Bollinger based setups. This one is seems to work best with 5min charts and 20 to 30min expiry. The strategy follows variation of a Bollinger band + Moving Averages
reversal strategy, it uses the 2 moving averages mainly to determine market direction.
在脚本中搜索"布林线boll指标使用详细讲解"
Bollinger Bands Scalper + VWAPGet more consistent scalps by trading in-between Bollinger Band Deviations.
FEATURES:
1) 3 Bollinger Bands with default settings to 1, 2, and 3 deviations for more consistent scalps
2) Trendicator: a dynamic color changing moving average that helps you see trend quickly
3) Robust VWAP tool with up to 3 different deviations as well as different anchor points to help you see strong support and resistances
4) Calming "purple cloud" color palette helps you focus on price action
5) Discover new trading strategies with a wide range of customizability

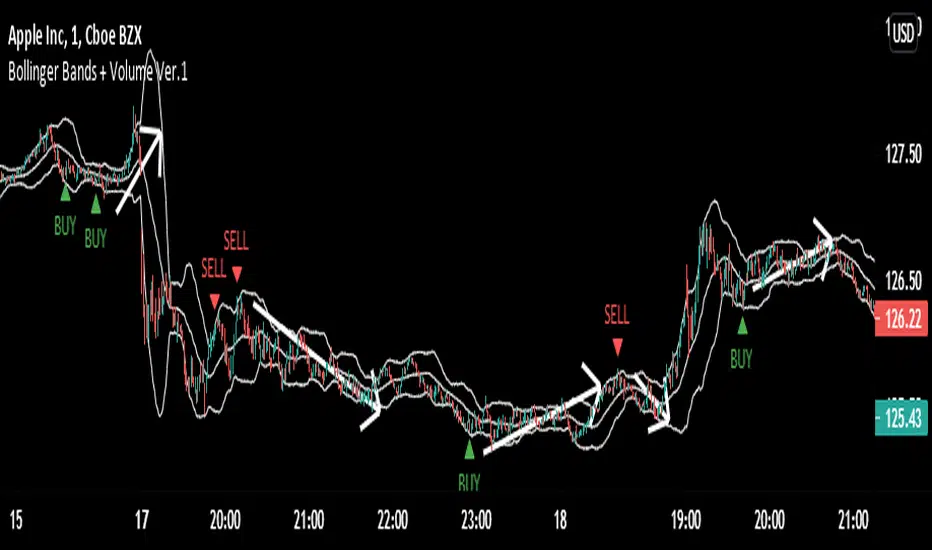
Bollinger Bands + Volume (Version.1)Bollinger Bands + Volume (Version.1)
This is just version 1, "version 2 ,version 3,version 4" are coming, which are better than this version.
- This indicator used the volume with Bollinger Bands.
- This indicator generates BUY and SELL signals.
- Whenever price will touch the upper band and if the buying volume is low and the selling volume is high Then it will give SELL signal.
AND
- Whenever price will touch the lower band and if the selling volume is low and the buying volume is high Then it will give BUY signal.
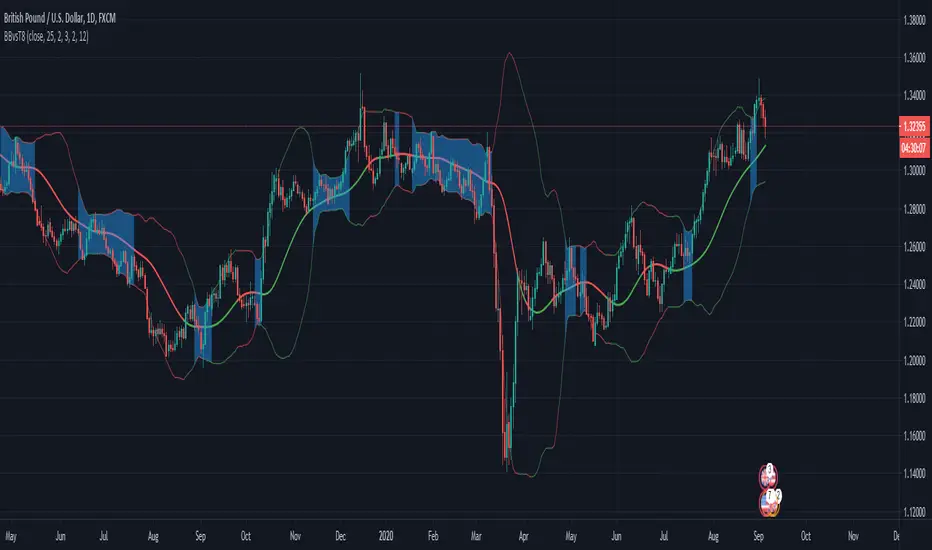
Bollinger Bands combined with Telson T8Indicator idea based on classic Bollinger bands and Telson T8 moving average.
The indicator detects Bollinger bands narrowing which should predict a move to a direction.
NOTE: You need to define in the indicator settings (Narrow percentage) the percentage between the upper and lower bands that would be highlighted.
For example: if you set 5%, the indicator will highlight the parts that the upper and lower bands are less than 5% compare the current price (usually close price, but you can define otherwise)
Use the Telson T8 to determinate the trend/direction of the move.
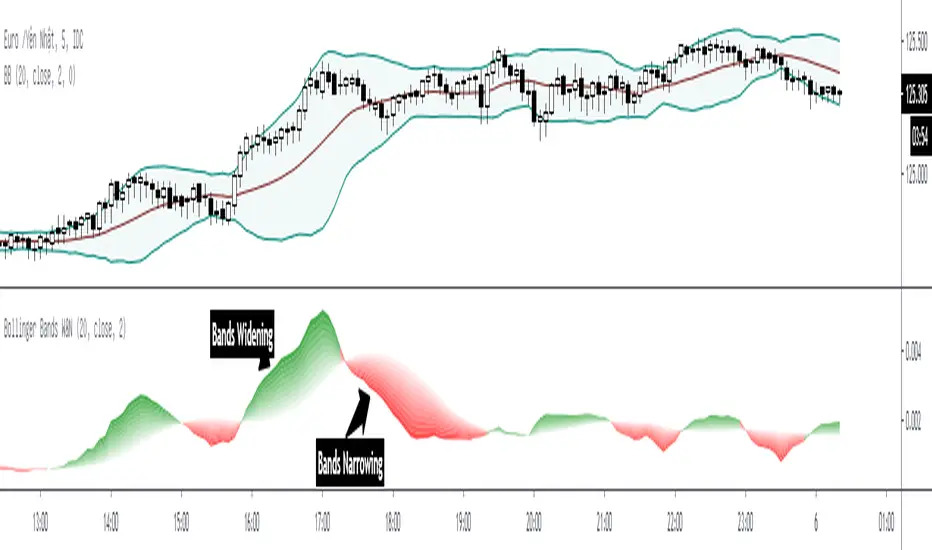
Bollinger Bands Wide & Narrow* Bollinger Bands Wide & Narrow apply a Simple Moving Average (SMA) on Bollinger Bands Width with same period of middle bands to regconize the bands are widening or narrowing.
* "Bands Widening" is marked by green shade.
* "Bands Narrowing" is marked by red shade.
Bollinger Bands Trend Model-BuschiEnglish
In general, Bollinger Bands are used as an indicator to visualize the "reversion to the mean". However, in this model, by using smaller variable values (default: 10 time intervals instead of 20, 1 standard deviation instead of 2), they are used as an trend following indicator. Two consecutive closes above the upper band form a buy signal (symbol 'B' above bar) which is reversed by two consecutive closes below the lower band (symbol 'S' under bar) and vice versa. The corresponding buying (green) and selling (red) zones are coloured between the bands.
Deutsch
Im Allgemeinen werden Bollinger-Bänder als ein Indikator verwendet, um die "Rückkehr zum Mittelwert" zu visualisieren. In diesem Modell werden sie durch kleine Variablen-Werte (Standardwert: 10 Zeitintervalle anstatt 20, 1 Standardabweichung anstatt 2) jedoch als Trendfolge-Indikator verwendet. Zwei aufeinanderfolgende Schlusskurse über dem oberen Band (Symbol 'B' über dem Balken) bilden ein Kaufsignal, das durch zwei aufeinanderfolgende Schlusskurse unter dem unteren Band (Symbol 'S' unter Balken) umgekehrt wird. Gleiches gilt umgekehrt. Die entsprechenden Kauf-Zonen (grün) und Verkauf-Zonen (rot) werden zwischen den Bändern eingefärbt.

Bollinger Bands + Moving AveragesCombination of Bollinger Bands and 4 Moving Averages in one indicator.
The smoothing algorithm for the Bollinger Bands basis line and each of the Moving Averages can be chosen from either SMA , EMA , WMA , RMA, or HMA .

Bollinger Band Strategy (Basic) Version 1 This strategy is for learning purposes only. Pay special attention to these strategies on longer aggregation periods (like 1 hr chart or more). Don't expect accurate results when you set a limit to 10 cents above your entry to be accurate. For example if you set the chart to 1 day, the price may move down and hit a stop 10 times then tag your limit. If this doesn't make sense, just don't use strategies here. Learn more first. That being said, I don't have specific recommendations for each aggregation period, backtesting isn't always perfect.
Now then, this strategy can be used as the traditional BB method by setting the "Stop" and "Limit Out" to like 10000, check "Reversal Entry" and uncheck "Limit Time of Day" This will keep the strategy running just reverse your position when price crosses outside each band.
INPUTS:
Length - length of WMA that I used for mean of Bollinger Band (this may suppose to be SMA, too bad)
Source - O-H-L-C basis for WMA
Deviation - normal Standard deviation that would be set when using Bollinger Band
Trailing stop check box - your stop value will be either a hard stop or trailing stop for an exit
Stop - the stop value - remember you can set this really high and it won't stop out
Limit Out - the limit value for exit
Reversal Entry check box - This changes each entry from a reversal (traditional idea of BB) to enter a trend trade - hopefully version 2 will have choice to trend one direction and reversal in the other.
Limit Time of Day - Especially when trading futures, you may want to only trade a specific time of day, when this box is checked, you can set the entry times below, exit will still only occur based on limit/stop or a flip entry order (the opposite entry condition is met)
Tips:
when I don't know a thing about a price range, like gold. I can set the limit out to 10000 and play with a trailing stop to get a better idea of what is even possible before tuning further.

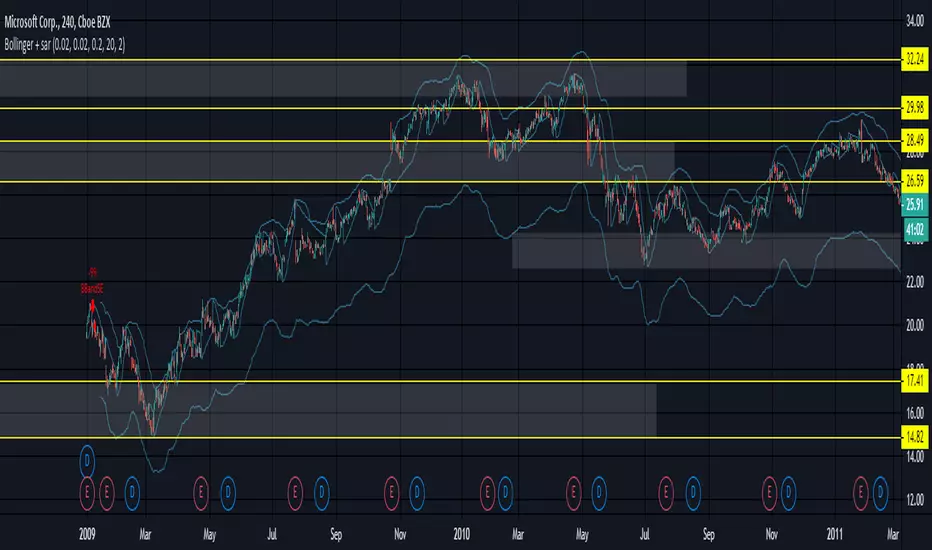
Bollinger + sarProblem with change in bollingerbands when adding psar short condition - and i dont know why.
Anyone - any ideas?
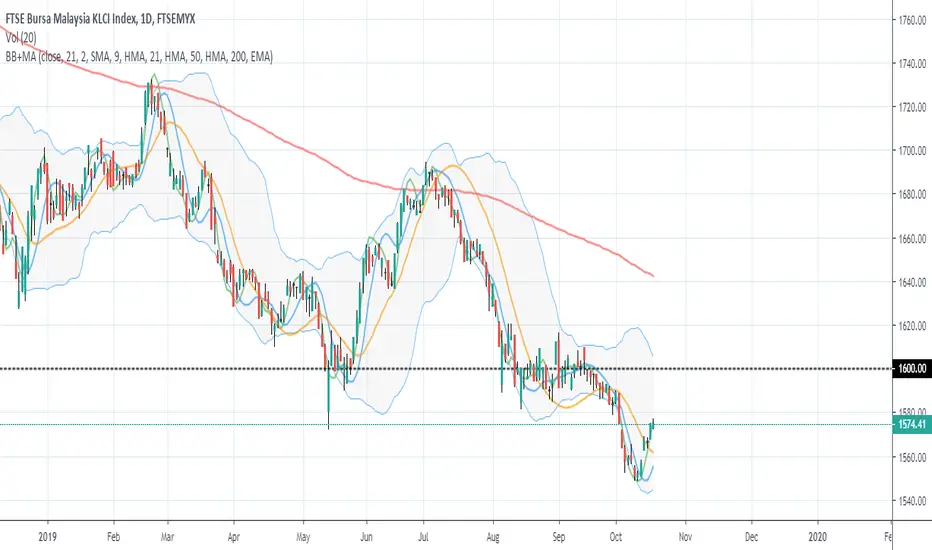
Bollinger Bands with 4 Moving AveragesCombines Bollinger Bands (BB) with up to four optional Moving Averages (MA) to read volatility, trend direction, and dynamic support–resistance in one overlay.
How It Works
BB: basis = MA(length, type) with standard deviation mult. upper = basis + dev, lower = basis − dev.
MA1–MA4: additional averages you can toggle (default only MA4/200 enabled).
Key Features
Flexible basis MA type for BB: SMA / EMA / RMA (Wilder) / WMA / VWMA.
Four optional MAs with independent length, color, and width (defaults: 7, 25, 99, 200; only 200 on by default).
Offset to shift BB for visual testing.
Overlay on price with shaded band between Upper–Lower.
Inputs & Defaults
BB Length = 20, StdDev = 2.0, Source = close.
Basis MA Type = SMA.
MA4 active (200), MA1–MA3 off (7/25/99 ready).
Offset = 0.
Practical Use
Use BB for volatility context: squeeze → potential breakout; expansion → strong trend.
Treat Basis / Upper / Lower as dynamic levels:
Pullbacks to Basis often become decision zones in trends.
Upper/Lower touches = relative extremes.
Add MA4(200) for primary bias; enable MA1–MA3 for finer timing.
Typical behavior:
Price > MA200 and rising basis → bullish bias; watch pullbacks to basis/MA25-like zones.
Price < MA200 and falling basis → bearish bias; watch rejections at basis/MAs.
Common Signals (not financial advice)
Breakout + BB expansion confirms momentum.
Squeeze + basis break can preface volatility expansion.
Confluence: Lower touch + fast MA in uptrends → mean-reversion setups; inverse for downtrends.
Notes
MA1–MA4 are SMA in the code; BB basis follows the selected MA type.
Test across timeframes; tune length and mult to the asset.
Disclaimer
Visual tool only. Combine with risk management, multi-timeframe confirmation, and a tested plan.

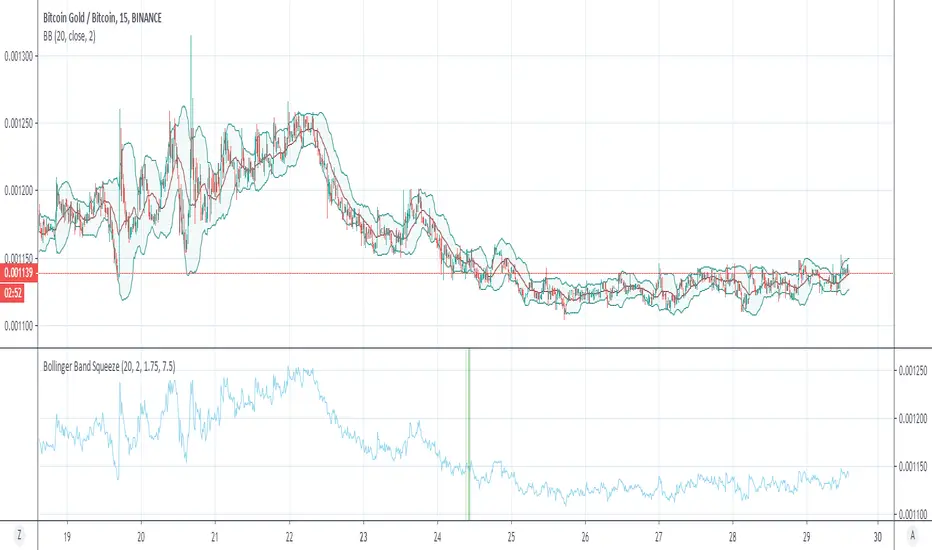
Bollinger Bands SqueezeBollinger Bands set to only display when a squeeze is taking place. Squeeze will be highlighted.

Bollinger bands + EMAI discovered a video on YouTube which was published on Jan 22, 2021. I just coded on TradingView. It's performing better in smaller TimeFrames (1m, 5m, ...).
How does it work? How to use?
This is based on Bollinger Bands and Exponential Moving Average. The logic is so simple: It will wait until the a candle starts to poke out of the BB. When it figures out a price outside the band, it will be altered for next candle. If the next candle close back inside the band, it will be marked with a up triangle (for long positions) or down triangle (for short positions). The take profit level would be the Exponential Moving Average.
It can be used as a confirmation alongside other techno fundamental tools and analysis.
P.S. As it's prohibited by community rules to link to outside, while it seems to be a kind of advertisement, I cannot share the link to the video. Cheers to those creative and kind YouTubers!

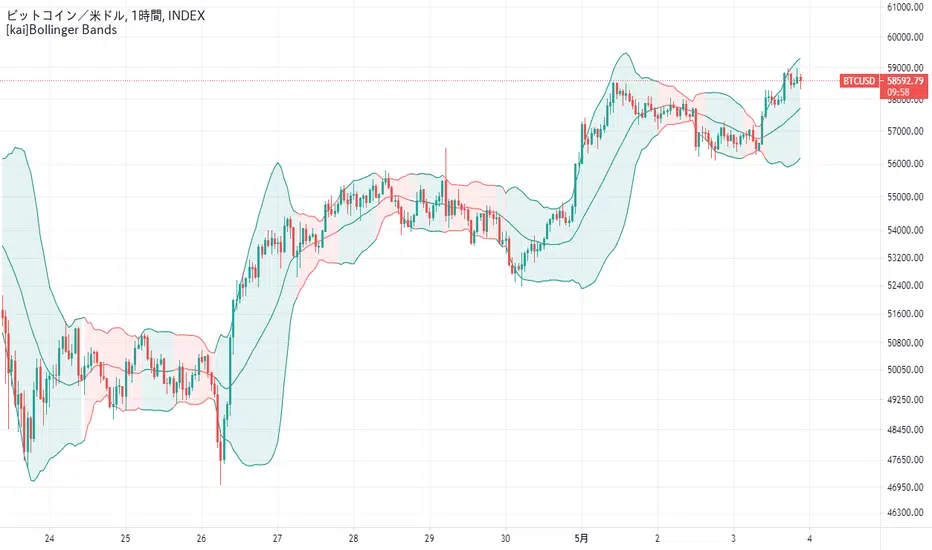
[kai]Bollinger BandsBollinger band compatible with log scale
You can display the squeezed part in red
ログスケールに対応したボリンジャーバンドです
スクイーズしたところを赤く表示することができます
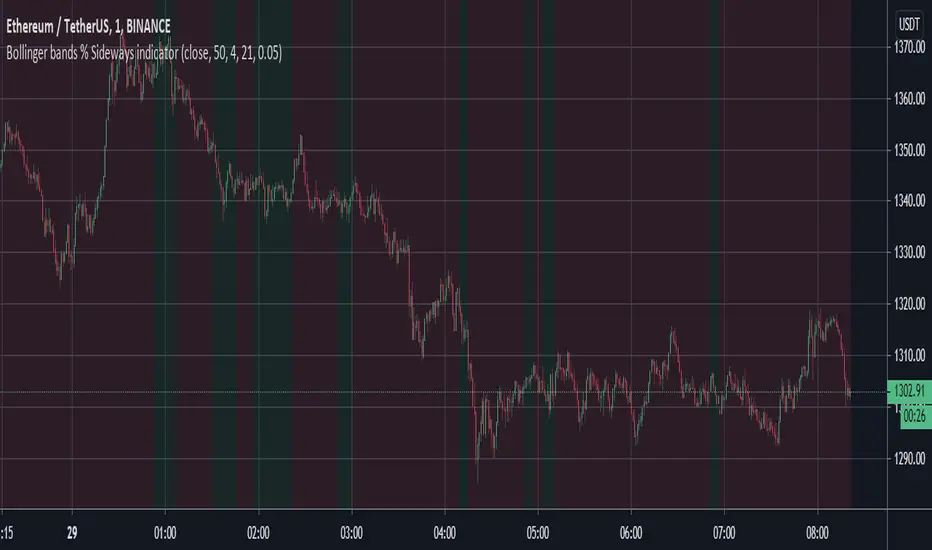
Bollinger bands % Sideways indicatorDetect sideways markets (green background) vs. trending markets (red background) with this indicator. It makes use of the Bollinger bands % as its base.
Bollinger %B Candles StrategyStrategy built based on earlier published indicator:
Looks to be doing good for short term swing trades. But, I am not sure if there is repainting. I tried to avoid buy/sell trades on same day - but wasn't successful.
So far back-tested on following:
COINBASE:BTCUSD - works on both long and short
CURRENCYCOM:GOLD and equities - long only.
Some of the failures: ASX:WPL , ASX:WHC , ASX:NHC
As usual for back-testing - using 1000 as initial capital with 100% invested on each trade and no compounding so that it will be easy to compare with buy and hold. Trade with caution :)

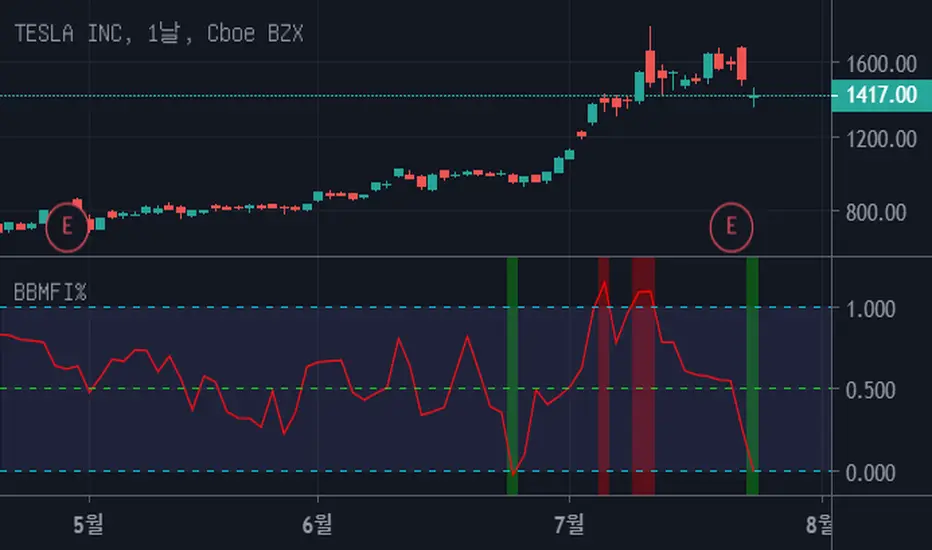
Bollinger Bands Money Flow Index %This script is similar to the previous one "Bollinger Bands Money Flow Index" but it's a little easier to interpret.
Fix the top line of the "BBMFI" to 1, and the bottom line to 0.
Indicates where "Money Flow Index" is located between the top and bottom lines.
If it's bigger than 1, it's overbuying. If it's less than 0, it's overselling.
Consider a trade if you are out of range from 0 to 1.
It's also a good trade timing to out of range and come back in.
Bollinger Bands + Pivots - V2It drawes a higest or lowest pivot when price intersects with bollinger bands.
Bollinger Band SqueezeThe Bollinger Band Squeeze is calculated according to the ATR. With the default settings. If the BB width is smaller than the ATR * 2 the background is painted green. If the BB width is larger than the ATR * 5 the background is painted red
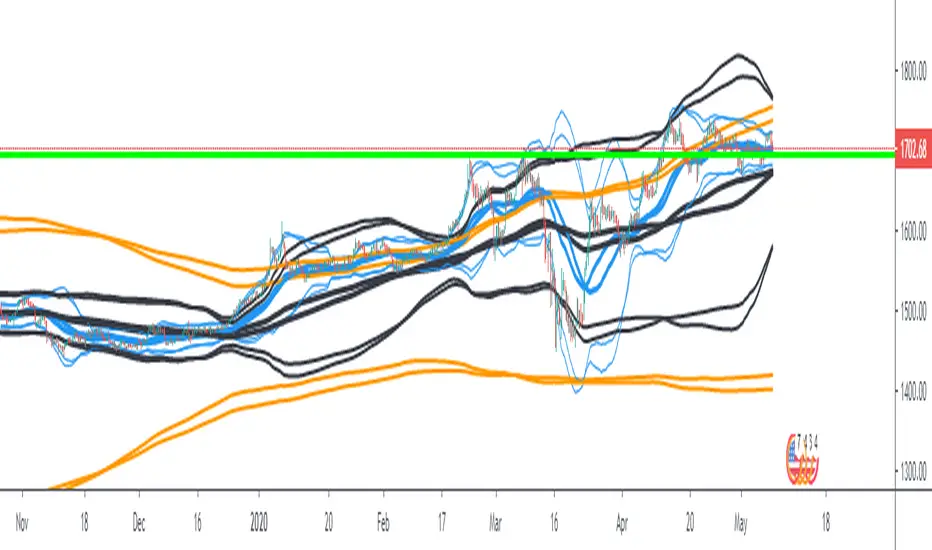
Bollinger Bands Ema 50,200,800EMAs converted to Bollinger Bands The bands are 50, 200 and 800 period, forming a strategy and having clear trends and stronger supports and resistances (when the lines converge the area is stronger).
NoScoobies Bollinger BandsBollinger Bands strategy that I am trying out, however I can't get my strategy.close to work. Looking for help.
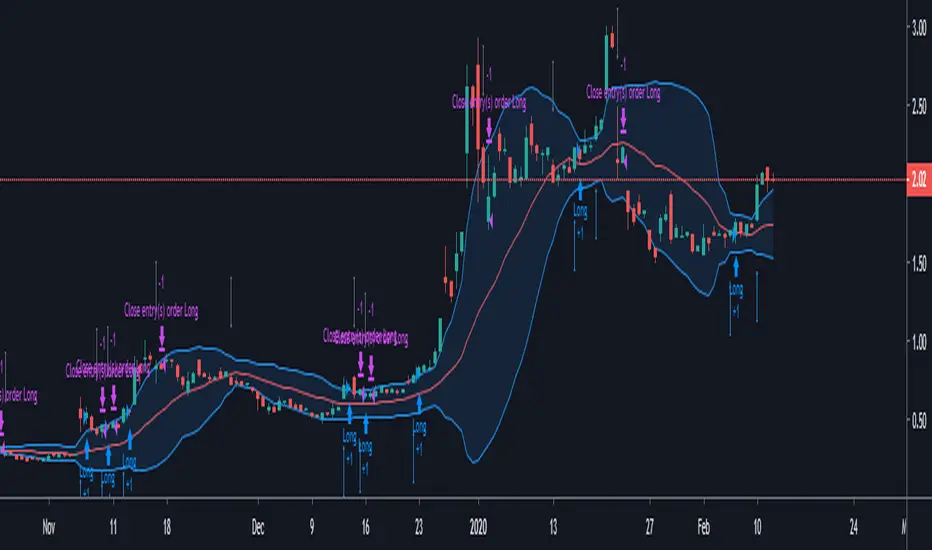
Bollinger Bands BAT/USDT 30minThis is ready to use Bollinger Band strategy that was backtested on the data from the previous year 2019.
The main purpose of this strategy is to determine trades with the highest probability of success, to keep a consistent portfolio growth throughout the year. This strategy cherry-picks the most reliable points of entry on a particular timeframe (30m) for the particular asset (BAT/USDT). The backtest shows a great result of 78.95% profitability with the maximum drawdown of -4.02%. This is one of my strategies out of the group of automated strategies that helps to grow my portfolio steadily.
You are welcome to change inputs and backtest the following strategy. Any comments or ideas would be appreciated.
If you are happy with existing results and would like to automate the strategy, which can be done through alerts, then you need to convert it to study and add alerts in the code.
Let me know if you are interested in that and I will create a study based on this strategy.

Bollinger Bands MTF [LonesomeTheBlue]With this script you can follow Bollinger Bands for current and higher time frame together. Higher time frame is calculated by script.
if current period
1m => higher period=5m
3m => higher period=5m
5m => higher period=15m
15m => higher period=1h
30m => higher period=1h
45m => higher period=1h
1h => higher period=4h
2h => higher period=4h
3h => higher period=4h
4h => higher period=1day
1day => higher period=1week
