$TICK & TICKQ Sentiment IndicatorThe USI:TICK & USI:TICKQ Sentiment Indicator is a versatile tool for traders analyzing the NYSE Tick Index ( USI:TICK ) or Nasdaq Tick Index ( USI:TICKQ ) to gauge market sentiment. It provides clear visual signals, a customizable moving average, and statistical insights to identify bullish and bearish conditions in real-time.
Key Features:
Sentiment Signals: Green triangle (▲) labels at a user-defined level (default: +1200) when the Tick closes above zero, and red triangle (▼) labels (default: -1200) when below zero, indicating bullish or bearish sentiment.
Adjustable Moving Average: Plots a customizable moving average (SMA, EMA, WMA, VWMA, SMMA, HullMA) with user-defined length (default: 14) to smooth Tick data and highlight trends.
Close Statistics: Displays the percentage of positive and negative Tick closes over a user-specified lookback period (default: 100) in a customizable table (position and font size adjustable).
Threshold Lines: Includes reference lines at +800/-800 (gold) and +1000/-1000 (red) to mark key Tick levels, plus a zero line (gray, dashed) for context.
Customizable Display: Adjust symbol sizes (tiny, small, normal, large, huge), table position (top-right, top-left, etc.), and table font size for a tailored chart experience.
How to Use:
Apply the indicator to a USI:TICK or USI:TICKQ chart (e.g., TVC:TICK, TVC:TICKQ) on an intraday timeframe (e.g., 1-minute, 5-minute).
In the settings:
Set the TICK Symbol to your broker’s NYSE Tick ( USI:TICK ) or Nasdaq Tick ( USI:TICKQ ) symbol.
Adjust Top Level and Bottom Level (default: +1200/-1200) to position sentiment signals at chart edges.
Set Moving Average Length and Type to suit your analysis.
Configure Lookback Period for close percentage calculations.
Customize Dot Size , Table Position , and Table Font Size for optimal visibility.
Monitor green/red triangles for sentiment, the moving average for trends, and the table for statistical insights.
Notes:
This indicator is designed for both USI:TICK (NYSE Tick) and USI:TICKQ (Nasdaq Tick, NQ Tick), allowing analysis of either market’s breadth.
Ensure your chart’s timeframe supports USI:TICK or USI:TICKQ data.
Adjust Top Level / Bottom Level if symbols don’t appear at chart edges due to scaling.
Labels may stack with frequent signals; contact the developer for customization to limit frequency.
No symbol appears if the Tick closes at 0; a neutral marker can be added upon request.
Ideal For:
Day traders and scalpers using USI:TICK or USI:TICKQ to gauge market breadth.
Analysts seeking customizable visualizations and statistical insights for Tick data.
Created by northfieldwhale.
在脚本中搜索"文华财经tick价格"

RSI over screener (any tickers)█ OVERVIEW
This screener allow you to watch up to 240 any tickers you need to check RSI overbought and oversold using multiple periods, including the percentage of RSIs of different periods being overbought/oversold, as well as the average between these multiple RSIs.
█ THANKS
LuxAlgo for his RSI over multi length
I made function for this RSI and screener based on it.
allanster for his amazing idea how to split multiple symbols at once using a CSV list of ticker IDs
█ HOW TO USE
- hide chart:
- add 6 copies of screener
- change list number at settings from 1 to 6
- add you tickers
Screener shows signals when RSI was overbought or oversold and become to 0, this signal you may use to enter position(check other market condition before enter).
At settings you cam change Prefics, Appendix and put you tickers.
limitations are:
- max 40 tickers for one list
- max 4096 characters for one list
- tickers list should be separated by comma and may contains one space after the comma
By default it shows almost all BINANCE USD-M USDT tickers
Also you can adjust table for your screen by changing width of columns at settings.
If you have any questions or suggestions write comment or message.

Futures Engulfing Candle Size Strategy (Ticks, TP/SL)The Futures Candle Size Strategy is designed to identify and trade significant price movements in the futures market based on candle size. It is optimized for futures instruments like ES, NQ, or CL, where precise tick-level calculations are essential. The strategy includes a customizable take profit and stop loss in ticks and operates only within a specified time window (e.g., 7:00 AM to 9:15 AM CST).
Key Features:
Candle Size Threshold: Trades are triggered when the candle's high-to-low range exceeds the defined threshold in ticks.
Time Filter: Limits trades to the most active market hours, specifically between 7:00 AM and 9:15 AM CST.
Take Profit and Stop Loss: Customizable exit levels in ticks to manage risk and lock in profits.
Long and Short Trades: Automatically places buy or sell orders based on the candle's direction (bullish or bearish).
Alerts: Sends alerts whenever a trade is triggered, helping you stay informed in real-time.
How It Works:
The strategy calculates the size of each candle in ticks and compares it to the user-defined threshold.
If the candle size meets or exceeds the threshold within the specified time range, it triggers a long or short trade.
The trade automatically exits when the price hits the take profit or stop loss levels.

120x ticker screener (composite tickers)In specific circumstances, it is possible to extract data, far above the 40 `request.*()` call limit for 1 single script .
The following technique uses composite tickers . Changing tickers needs to be done in the code itself as will be explained further.
⎯⎯⎯⎯⎯⎯⎯⎯⎯⎯⎯⎯⎯⎯⎯⎯⎯⎯⎯⎯⎯⎯⎯⎯⎯⎯⎯⎯⎯⎯⎯⎯⎯⎯⎯⎯⎯⎯⎯⎯⎯⎯⎯⎯⎯⎯⎯⎯⎯⎯⎯⎯⎯⎯⎯
🔶 PRINCIPLE
Standard example:
c1 = request.security('MTLUSDT' , 'D', close)
This will give the close value from 1 ticker (MTLUSDT); c1 for example is 1.153
Now let's add 2 tickers to MTLUSDT; XMRUSDT and ORNUSDT with, for example, values of 1.153 (I), 143.4 (II) and 0.8242 (III) respectively.
Just adding them up 'MTLUSDT+XMRUSDT+ORNUSDT' would give 145.3772 as a result, which is not something we can use...
Let's multiply ORNUSDT by 100 -> 14340
and multiply MTLUSDT by 1000000000 -> 1153000000 (from now, 10e8 will be used instead of 1000000000)
Then we make the sum.
When we put this in a security call (just the close value) we get:
c1 = request.security('MTLUSDT*10e8+XMRUSDT*100+ORNUSDT', 'D', close)
'MTLUSDT*10e8+XMRUSDT*100+ORNUSDT' -> 1153000000 + 14340 + 0.8242 = 1153014340.8242 (a)
This (a) will be split later on, for example:
1153014330.8242 / 10e8 = 1.1530143408242 -> round -> in this case to 1.153 (I), multiply again by 10e8 -> 1153000000.00 (b)
We subtract this from the initial number:
1153014340.8242 (a)
- 1153000000.0000 (b)
–––––––––––––––––
14340.8242 (c)
Then -> 14340.8242 / 100 = 143.408242 -> round -> 143.4 (II) -> multiply -> 14340.0000 (d)
-> subtract
14340.8242 (c)
- 14340.0000 (d)
––––––––––––
0.8242 (III)
Now we have split the number again into 3 tickers: 1.153 (I), 143.4 (II) and 0.8242 (III)
⎯⎯⎯⎯⎯⎯⎯⎯⎯⎯⎯⎯⎯⎯⎯⎯⎯⎯⎯⎯⎯⎯⎯⎯⎯⎯⎯⎯⎯⎯⎯⎯⎯⎯⎯⎯⎯⎯⎯⎯⎯⎯⎯⎯⎯⎯⎯⎯⎯⎯⎯⎯⎯⎯⎯
In this publication the function compose_3_() will make a composite ticker of 3 tickers, and the split_3_() function will split these 3 tickers again after passing 1 request.security() call.
In this example:
t46 = 'BINANCE:MTLUSDT', n46 = 10e8 , r46 = 3, t47 = 'BINANCE:XMRUSDT', n47 = 10e1, r47 = 1, t48 = 'BINANCE:ORNUSDT', r48 = 4 // T16
•••
T16= compose_3_(t48, t47, n47, t46, n46)
•••
= request.security(T16, res, )
•••
= split_3_(c16, n46, r46, n47, r47, r48)
🔶 CHANGING TICKERS
If you need to change tickers, you only have to change the first part of the script, USER DEFINED TICKERS
Back to our example, at line 26 in the code, you'll find:
t46 = 'BINANCE:MTLUSDT', n46 = 10e8 , r46 = 3, t47 = 'BINANCE:XMRUSDT', n47 = 10e1, r47 = 1, t48 = 'BINANCE:ORNUSDT', r48 = 4 // T16
( t46 , T16 ,... will be explained later)
You need to figure out how much you need to multiply each ticker, and the number for rounding, to get a good result.
In this case:
'BINANCE:MTLUSDT', multiply number = 10e8, round number is 3 (example value 1.153)
'BINANCE:XMRUSDT', multiply number = 10e1, round number is 1 (example value 143.4)
'BINANCE:ORNUSDT', NO multiply number, round number is 4 (example value 0.8242)
The value with most digits after the decimal point by preference is placed to the right side (ORNUSDT)
If you want to change these 3, how would you do so?
First pick your tickers and look for the round values, for example:
'MATICUSDT', example value = 0.5876 -> round -> 4
'LTCUSDT' , example value = 77.47 -> round -> 2
'ARBUSDT' , example value = 1.0231 -> round -> 4
Value with most digits after the decimal point -> MATIC or ARB, let's pick ARB to go on the right side, LTC at the left of ARB, and MATIC at the most left side.
-> 'MATICUSDT', LTCUSDT', ARBUSDT'
Then check with how much 'LTCUSDT' and 'MATICUSDT' needs to be multiplied to get this: 5876 0 7747 0 1.0231
'MATICUSDT' -> 10e10
'LTCUSDT' -> 10e3
Replace:
t46 = 'BINANCE:MTLUSDT', n46 = 10e8 , r46 = 3, t47 = 'BINANCE:XMRUSDT', n47 = 10e1, r47 = 1, t48 = 'BINANCE:ORNUSDT', r48 = 4 // T16
->
t46 = 'BINANCE:MATICUSDT', n46 = 10e10 , r46 = 4, t47 = 'BINANCE:LTCUSDT', n47 = 10e3, r47 = 2, t48 = 'BINANCE:ARBUSDT', r48 = 4 // T16
DO NOT change anything at t46, n46,... if you don't know what you're doing!
Only
• tickers ('BINANCE:MTLUSDT', 'BINANCE:XMRUSDT', 'BINANCE:ORNUSDT', ...),
• multiply numbers (10e8, 10e1, ...) and
• round numbers (3, 1, 4, ...)
should be changed.
There you go!
🔶 LIMITATIONS
🔹 The composite ticker fails when 1 of the 3 isn't in market in the weekend, while the other 2 are.
That is the reason all tickers are crypto. I think it is possible to combine stock,... tickers, but they have to share the same market hours.
🔹 The number cannot be as large as you want, the limit lays around 15-16 digits.
This means when you have for example 123, 45.67 and 0.000000000089, you'll get issues when composing to this:
-> 123045670.000000000089 (21 digits)
Make sure the numbers are close to each other as possible, with 1 zero (or 2) in between:
-> 1.230045670089 (13 digits by doing -> (123 * 10e-3) + (45.67 * 10e-7) + 0.000000000089)
🔹 This script contains examples of calculated values, % change, SMA, RMA and RSI.
These values need to be calculated from HTF close data at current TF (timeframe).
This gives challenges. For example the SMA / %change is not a problem (same values at 1h TF from Daily data).
RMA , RSI is not so easy though...
Daily values are rather similar on a 2-3h TF, but 1h TF and lower is quite different.
At the moment I haven't figured out why, if someone has an idea, don't hesitate to share.
The main goal of this publication is 'composite tickers ~ request.security()' though.
🔹 When a ticker value changes substantially (x10, x100), the multiply number needs to be adjusted accordingly.
🔶 SETTINGS
SHOW SETS
SET
• Length : length of SMA, RMA and RSI
• HTF : Higher TimeFrame (default Daily)
TABLE
• Size table : \ _ Self-explanatory
• Include exchange name : /
• Sort : If exchange names are shown, the exchanges will be sorted first
COLOURS
• CH%
• RSI
• SMA (RMA)
DEBUG
Remember t46 , T16 ,... ?
This can be used for debugging/checking
ALWAYS DISABLE " sort " when doing so.
Example:
Set string -> T1 (tickers FIL, CAKE, SOL)
(Numbers are slightly different due to time passing by between screen captures)
Placing your tickers at the side panel makes it easy to compare with the printed label below the table (right side, 332201415014.45 ),
together with the line T1 in the script:
t1 = 'BINANCE:FILUSDT' , n1 = 10e10, r1 = 4, t2 = 'BINANCE:CAKEUSDT' , n2 = 10e5 , r2 = 3, t3 = 'BINANCE:SOLUSDT' , r3 = 2 // T1
FIL : 3.322
CAKE: 1.415
SOL : 14.56
Now it is easy to check whether the tickers are placed close enough to each other, with 1-2 zero's in between.
If you want to check a specific ticker, use " Show Ticker" , see out initial example:
Set string -> T16
Show ticker -> 46 (in the code -> t46 = 'BINANCE:MTLUSDT')
(Set at 0 to disable " check string " and NONE to disable " Set string ")
-> Debug/check/set away! 😀
🔶 OTHER TECHNIQUES
• REGEX ( Regular expression ) and str.match() is used to delete the exchange name from the ticker, in other words, everything before ":" is deleted by following regex:
exch(t) => incl_exch ? t : str.match(t, "(?<=:) +")
• To sort, array.sort_indices() is used (line 675 in the code), just as in my first "sort" publication Sort array alphabetically - educational
aSort = arrT.copy()
sort_Indices = array.sort_indices(id= aSort, order= order.ascending)
• Numbers and text colour will adjust automatically when switching between light/dark mode by using chart.fg_color / chart.bg_color
🔹 DISCLAIMER
Please don't ask me for custom screeners, thank you.

CDC ActionZone Multi-TF,Mult-Ticker with alert() [P-O-Concept]This is proof-of-concept for using single screen displaying triggering signal of multiple stock/crypto
This source code is subject to the terms of the Mozilla Public License 2.0 at mozilla.org
1. Original CDC Action Zone v3 2020 by © piriya33
Source of original indicator :
2. Table concept/part of code is pulled from Portfolio Tracker
***************************************************************************
CDC Action Zone is based on a simple EMA crossover between EMA12 and EMA26
The zones are defined by the relative position of price in relation to the two EMA lines
Different zones can be use to activate / deactivate other trading strategies
The strategy can also be used on its own with acceptable result, buy on the first green candle
and sell on the first red candle
***************************************************************************
Hint Color Meaning :
Green = FastMA > SlowMA and Price is above FastMA
Blue = FastMA < SlowMA and Price is above both MA
LightBlue = FastMA < SlowMA and Price is between both MA
Red = FastMA < SlowMA and Price is below FastMA
Orange = FastMA > SlowMA and Price is below both MA
Yellow = FastMA > SlowMA and Price is between both MA
Blue/LightBlue/Orange/Yellow should be used with another indicator (such as divergent or so)
Cautions:
- This indicator is not meant to be used as "Signal" or "Trading System"
- This indicator provide a quick-glimpse to multiple ticker in same screen. You'll still have to see indications using original CDC Action Zone (If you're using with CDC System), or combining with another indicator (For shorter tf or scalping, or short/long cover)
- Up to 10 Tickers / Timeframe + Current ticker
Alert Creation Guideline
If this indicator will be used as alert. The timeframe for ticker should be set to "same as" the chart you're using, ie, to set alert on 4h, it should be created in 4h-timeframe (Alert is fired on bar close, using 1D-TABLE in 4H-CHART may trigger alert up to 6 times. else if using in 4H-TABLE in 1D-CHART the alert may not trigger at all)
Considering using ohlc4, hlc3, hl2 for market with no session
PS. Send me a message if you see any bug. (especially if using JSON, I have no chance to test with multiple alert at same tick.)

Multi-Exchange Volume (30 Tickers) by kurtsmock + BV + rVolauthor: kurtsmock
Fully Customizable ticker set. Up to 30 Tickers. Bitcoin set as default.
-- IMPORTANT NOTE: --
30 Exchanges are a lot. It can take a while to load. You can fully customize this indicator to your liking. Here's how:
1. Load indicator
2. Open Settings
3. Uncheck the switch box for exchanges you want unincluded
4. At the bottom of the settings menu click "Defaults" and hit "Save as Default"
5. To turn them all back on, hit "Reset Settings" in that same "Defaults" menu and click "Save as Default" again.
Also, you don't have to use this with Bitcoin. This works with any asset, just change the ticker in the settings.
There's a lot going on with this indicator so the following is descriptions and instructions to help you better understand what's going on here. Thanks!
Goal:
- To provide a mechanism for assets on multiple exchanges to have their volume evaluated together
Edge:
- Having better and more complete volume information
Notes:
- The Default Exchanges for this indicator are highest volume bitcoin exchanges, but may contain "fake volume"
- Indicator is set for Bitcoin by default. However, you can change the tickers to reflect any asset you want
////// rVol //////
Goal:
- To understand how much volume is being executed relative to the same candle on previous days/periods
Edge:
- Higher rVol implies higher volatility and market interest.
- High rVol = higher than average volume . Markets move on volume so higher than average volume indicates increased market activity/volatility
- rVol is an indirect measure of active or anticipated volatility
Definitions:
- rVol: The volume of a period compared to the Average Volume of that same period in past sessions
- Important to note it does NOT add up the last 10 (default) candles, but rather the last 10 candles at session intervals.
- Example:
-- On a Tuesday, 1h chart it will add up the last ten Tuesday, 9:00 am candles, not including the current, active candle.
-- It then averages those lookback candles.
-- It then plots the percentage relationship between the most recent candle and the average of the lookback candles
-- Avg Vol of Lookback candles = 5000,
-- Volume of most recent candle = 4000: Output = rVol = 80:
-- Volume of most recent candle was 80% of the average volume in the 9 am time period of the last ten Tuesdays in the 9 am, 1h period
Notes:
- rVol does not add current candle volume into lookback sum. So, you set lookback to be: (not including the current day)
- rVol is on a switch. So, if you want to see rVol instead of volume, hit the switch in the settings
- If you want to see both, load 2 instances of the indicator.
////// Better-er Volume //////
Goal:
To Identify:
- When a candle closes at the highest volume * range relative to the lookback period and close > open
- When a candle closes at the highest volume * range relative to the lookback period and close < open
- When a candle closes at the highest volume / price relative to the lookback period
Edge:
- Identifies beginnings of price expansion, climax of price expansion, breakouts, pivots, and take profit points on the volume chart
Notes:
- Based generally on Barry Taylor's "Better Volume" indicator and ideas from Pascal Willain's book "Value in Time."
- Better-er Volume rules are applied to both Total Volume or rVol.
-- When rVol is displayed Better-er Volume is applied to rVol
-- When Total Volume is displayed Better-er Volume is applied to Total Volume
// Plot Key: //
Green Triangle Up = Often marks the beginning and/or end of price expansion to the upside
Red Triangle Up = Often marks the beginning and/or end of price expansion to the downside
Yellow Square = High Volume but Tight Range. Implies a Battle of Bulls and Bears. High Liquidity area. Provided Liquidity is not enough to move price. Thick Limit Order Book.
Purple Triangle Up or Down = Implies high market participation. Typically at the end of expansion when very significant s/r is hit
category: volume Volatility
tags: Volume rVol relativevolume Bitcoin cryptocurrency bettervolume
Many More Volume Indicators Coming Out Soon!

Gold Futures 2M 5M Tick Move Indicator📢 Gold Futures Tick Move Indicator 🚀
Customizable Tick-Based Trading Alerts & Visualization
🔹 Overview:
The Gold Futures Tick Move Indicator is designed for traders who rely on tick-based price movements to detect significant market activity. This indicator identifies strong momentum moves, triggers customizable buy and sell signals, and provides clear trade range visualizations with take profit and stop loss levels.
🔹 Key Features:
✅ Customizable Tick Threshold – Adjust the number of ticks needed to trigger a buy/sell signal (default: 65 ticks).
✅ Take Profit & Stop Loss Levels – Automatically calculates and plots exit levels (default: 75 TP, 40 SL).
✅ Buy/Sell Alerts – Get real-time alerts when a candle moves beyond the defined tick threshold.
✅ Custom Colors for Trade Signals – Buy (teal #008080), Sell (hot pink #FF69B4).
✅ Trade Range Visualization – Background colors highlight long & short positions for better clarity.
✅ Candle Highlighting – Turns white when a tick-based signal is detected.
🔹 How It Works:
1️⃣ Set your tick movement threshold – Define how many ticks the price must move to trigger a trade signal.
2️⃣ Customize Take Profit & Stop Loss – Modify exit levels to match your strategy.
3️⃣ Wait for a Signal – If the price moves beyond the defined tick range, the indicator plots a Buy (teal) or Sell (hot pink) signal.
4️⃣ Monitor Trade Zones – Trade ranges are highlighted in teal or pink for quick visualization.
5️⃣ Receive Alerts – Set up TradingView alerts to be notified of trade opportunities.
🔹 Who is This For?
💰 Gold Futures Traders looking to capitalize on price momentum
📈 Scalpers & Day Traders seeking precise tick-based entries
🎯 Algo Traders who want automated alerts & visual cues

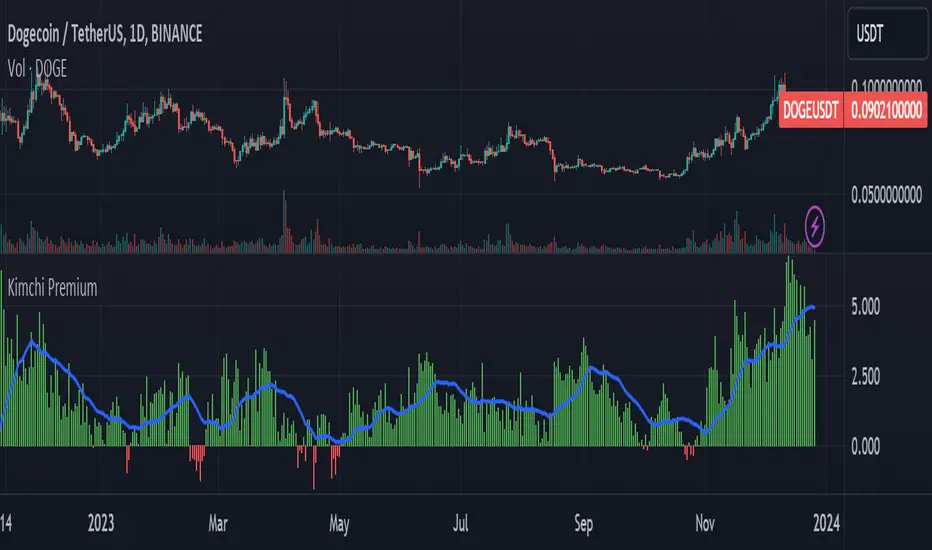
Kimchi Premium / Korean Premium ALL TICKERSKimchi Premium
Due to the isolated nature of Korean crypto markets, Koreans pay a hefty premium on most cryptos. (Usually ranging from 3% to 5%). This is colloquially known as the " Kimchi Premium ".
Uses
The extend of this premium can be used to gauge Korean sentiment towards certain tickers. Most of the insane alt coin rallies that are started by Korean degens are missed by foreign traders entirely. This script seeks to fix that.
Notes
This script automatically detects your current ticker and compares the USDT pair to the KRW pair after adjusting for exchange rate.
Works on all USDT, USDC, BUSD, FDUSD, USD, USDT.P, USDC.P or KRW pairs. Will obviously throw an error if your ticker has no KRW pairing.
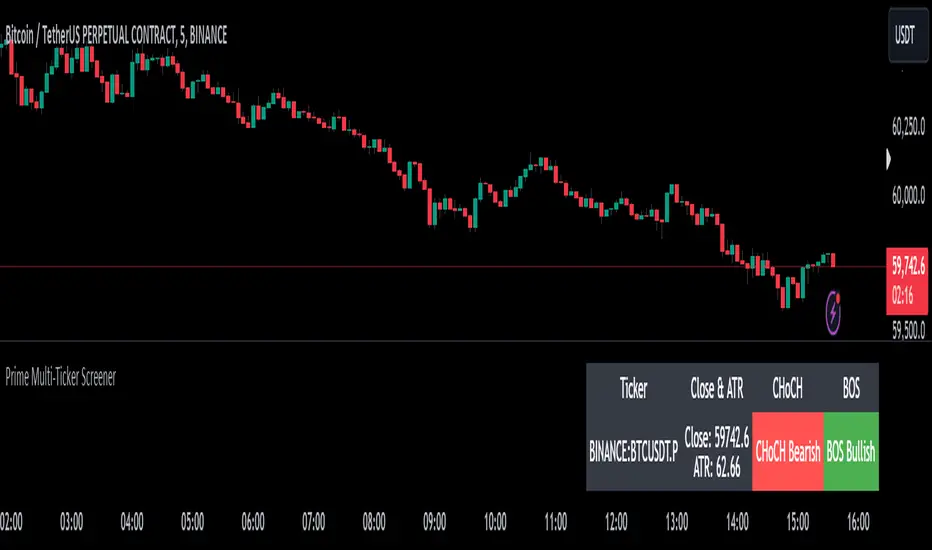
Prime Multi-Ticker Screener: Real-Time Market StructurePrime Multi-Ticker Screener: Real-Time Market Structure and Trend Detection Tool
Prime Multi-Ticker Screener is designed to track multiple tickers simultaneously, providing real-time insights into market trends and structure changes such as CHoCH (Change of Character) and BOS (Break of Structure). This tool is perfect for traders looking to monitor multiple assets across different timeframes while receiving clear signals that highlight critical market shifts. The indicator delivers instant visual feedback with color-coded backgrounds to make interpreting signals easy and efficient.
Core Features of Prime Multi-Ticker Screener
Multi-Ticker Monitoring: Track up to 5 tickers across multiple timeframes in a single dashboard. This makes it easy to watch several assets at once without cluttering your chart.
CHoCH and BOS Detection: The screener automatically detects and highlights significant market structure shifts. CHoCH signals are shown when a trend reverses or consolidates, while BOS signals indicate a break in previous highs or lows, helping traders catch potential trend reversals early.
Color-Coded Visuals: The background of each signal cell dynamically changes color to represent bullish or bearish signals. Green indicates bullish activity, while red highlights bearish market shifts, making it easy for traders to identify key movements at a glance.
Close Price and ATR Data: For each ticker, the screener displays both the current close price and the 14-period Average True Range (ATR), providing important volatility information to support decision-making.
Detailed Explanation of How Prime Multi-Ticker Screener Works
Prime Multi-Ticker Screener combines trend detection with real-time market structure analysis to deliver comprehensive market insights. It analyzes the following components:
CHoCH Detection: Change of Character occurs when the market switches from trending to ranging or vice versa. This indicator catches these moments by identifying when prices cross pivot levels, providing traders with a valuable signal of potential market phase changes.
BOS Detection: The Break of Structure function highlights moments when the price breaks a significant high or low, often indicating the start of a new trend or the continuation of an existing one.
Close Price & ATR Monitoring: Alongside market structure signals, the screener provides real-time data on the close price and the Average True Range (ATR), ensuring traders have a complete picture of the price and volatility landscape for each asset they are tracking.
Why It's Useful for Traders
Prime Multi-Ticker Screener is a versatile tool that offers substantial benefits to traders who want to stay informed about multiple assets and trends simultaneously:
Comprehensive Monitoring: Track multiple assets in real time, all from a single indicator. Whether you trade crypto, forex, or stocks, this tool helps you stay on top of market movements across different assets and timeframes.
Market Structure Analysis: The automatic detection of CHoCH and BOS signals gives traders an edge by identifying potential reversals and trend continuations as they happen, allowing for more timely and informed trading decisions.
Efficient and Intuitive Design: The screener is designed with simplicity in mind. The color-coded backgrounds quickly alert traders to market structure shifts without overwhelming them with data, making it ideal for those who need to act fast.
How It Works: Practical Usage
Prime Multi-Ticker Screener is ideal for:
Day traders: The real-time tracking of multiple assets allows day traders to quickly spot trading opportunities across different markets.
Swing traders: CHoCH and BOS detection help swing traders catch key market structure shifts, helping them align trades with emerging trends.
Trend followers: The screener provides instant feedback on when a trend is continuing or breaking, helping trend-following traders maintain their positions or exit early when needed.
By combining multiple key metrics—price, volatility, and market structure—Prime Multi-Ticker Screener ensures traders are well-equipped to manage their positions across a variety of assets.
Risk Disclaimer
While Prime Multi-Ticker Screener provides valuable market insights, it's important to remember:
Past performance is not indicative of future results: This screener provides analysis based on historical data, and no indicator can predict future market movements with certainty.
Market Conditions: The effectiveness of Prime Multi-Ticker Screener may vary in different market conditions, so traders should always use proper risk management when trading.
Trading Risks: Like any trading tool, Prime Multi-Ticker Screener should be used as part of a comprehensive trading strategy, including risk management techniques such as stop-loss orders and position sizing.
RSI Overlay Table - 30 Tickers Sorted with ColorOverview
The RSI Overlay Table script provides traders with a powerful tool to monitor the Relative Strength Index (RSI) across multiple tickers in real-time. This script enables users to keep track of up to 30 different assets simultaneously, displaying their RSI values in an easy-to-read table format directly on the chart. It helps traders identify overbought and oversold conditions quickly, enhancing their ability to make informed trading decisions.
Key Features
Monitor Multiple Tickers: Track the RSI values of up to 30 different tickers at once. This allows users to have a broad view of market conditions across various assets without the need to switch between charts.
Dynamic RSI Calculations: The script calculates the RSI using the user-defined length, providing flexibility to adjust sensitivity based on the trading strategy. The default RSI length is set to 14, a commonly used period in technical analysis.
Customizable Overbought and Oversold Levels: Users can define their own overbought and oversold RSI levels, allowing them to tailor the script to their trading style. By default, the overbought level is set at 70, and the oversold level is set at 30.
Hide Neutral Rows Option: To help traders focus on the most critical signals, the script includes an option to hide rows where the RSI values are neither overbought nor oversold. This feature helps traders concentrate on assets that are more likely to experience a price reversal.
Color-Coded Alerts: The script highlights overbought and oversold conditions with distinct colors:
Red: Indicates that the asset is overbought (RSI above the user-defined overbought level).
Green: Indicates that the asset is oversold (RSI below the user-defined oversold level).
How to Use the RSI Overlay Table Script
Input Tickers: Enter up to 30 ticker symbols in the script settings. The script will automatically fetch the RSI values for each ticker and display them in the overlay table on the chart.
Adjust RSI Settings: Modify the RSI length and the overbought/oversold levels according to your trading strategy. These settings can be adjusted in the script input panel.
Use the Hide Neutral Rows Option: Toggle the “Hide Neutral Rows” option to focus only on tickers that are in overbought or oversold conditions. This feature is useful for traders who wish to filter out less significant signals and only act on strong RSI indicators.
Interpret the Table: The table will display each ticker symbol alongside its current RSI value. Tickers with RSI values above the overbought level will be highlighted in red, suggesting a potential sell signal. Tickers with RSI values below the oversold level will be highlighted in green, indicating a potential buy signal.
Application and Strategy
The RSI Overlay Table script is designed for traders who manage multiple assets and need to monitor their technical indicators efficiently. It is particularly useful for:
Swing Traders: Identifying overbought and oversold conditions to time entries and exits.
Portfolio Managers: Monitoring the relative strength of various assets in a portfolio.
Scalpers: Quickly spotting extreme price movements across multiple assets.
Notes
This script is intended to be used as a supplementary tool for technical analysis. Always use it in conjunction with other indicators and market analysis techniques.
The RSI values and signals provided by this script should not be taken as financial advice.
The RSI Overlay Table script provides a clear and efficient way to track RSI values across multiple assets, helping traders make more informed decisions. By offering customizable settings and a clean, color-coded interface, this tool aims to enhance the user's trading experience and streamline their analysis process.

CMYK CLEANSIGNAL XRPUSD ◊ Introduction
This is CLEANSIGNAL
A script that combines Ticker data from multiple exchanges to create a more reliable source.
◊ Origin
This is a part of Project XIAM.
◊ Theoretical Approach
Philosophy a :: Cleansignal
◊ Usage
This is a source script intended to replace your current ticker.
You can apply Indicators on this script , just select the source in their settings.
My own indicators will be updated soon, to include source selection in their settings.
◊ Features
Close / High / Low / Volume data from 6 exchanges !
BITFINEX ◊ BITSTAMP ◊ BITTREX ◊ BINANCE ◊ POLONIEX ◊ KRAKEN
◊ Community
Wanna share your findings ? or need help resolving a problem ?
CMYK :: discord.gg
AUTOVIEW :: discordapp.com
TRADINGVIEW UNOFFICIAL :: discord.gg

CMYK CLEANSIGNAL BTCUSD◊ Introduction
This is CLEANSIGNAL
A script that combines Ticker data from multiple exchanges to create a more reliable source.
◊ Origin
This is a part of Project XIAM.
◊ Theoretical Approach
Philosophy a :: Cleansignal
◊ Usage
This is a source script intended to replace your current ticker.
You can apply Indicators on this script , just select the source in their settings.
My own indicators will be updated soon, to include source selection in their settings.
◊ Features
Close / High / Low / Volume data from 10 exchanges !
BITFINEX ◊ BITSTAMP ◊ COINBASE ◊ CEXIO ◊ WEX -0.71% ◊ HITBTC ◊ GEMINI ◊ ITBIT ◊ BITMeX ◊ KRAKEN
◊ Community
Wanna share your findings ? or need help resolving a problem ?
CMYK :: discord.gg
AUTOVIEW :: discordapp.com
TRADINGVIEW UNOFFICIAL :: discord.gg

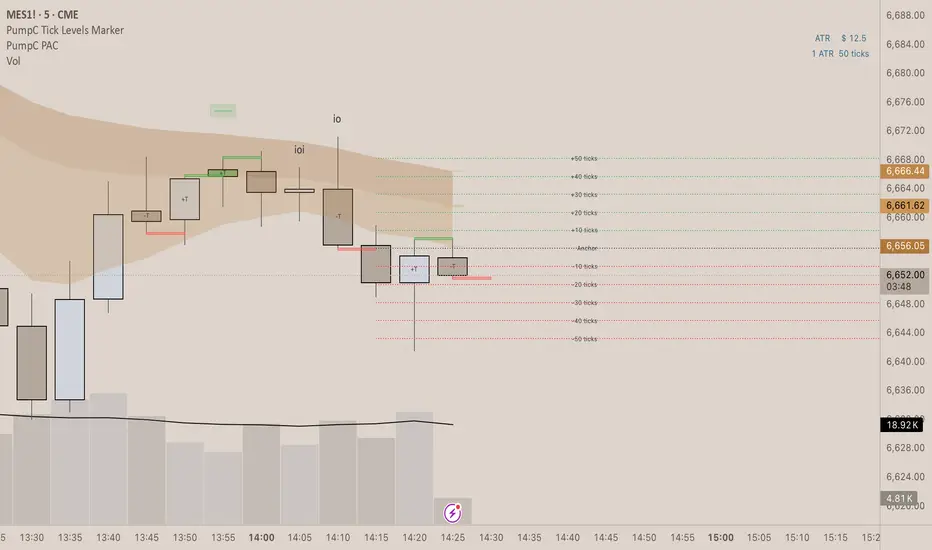
PumpC Tick Levels Marker🧾 Description
PumpC Tick Levels Marker
A precision price-level visualization tool designed for futures and tick-based traders.
Easily mark a single reference price and automatically plot symmetrical tick levels above and below it.
🔍 How It Works
Select your Anchor Price — this acts as the central reference point.
The script automatically plots upward and downward tick levels spaced by your chosen tick multiple.
Labels display tick distance (+/- ticks) and can be offset to the right by a set number of bars for clean alignment near the price scale.
⚙️ Key Features
One-click anchor control — define a single reference price.
Custom tick spacing — choose your tick multiple and number of levels to show (up to 10 in each direction).
Independent Up/Down toggles — display only the levels you need.
Label offset control — move labels closer or farther from the price scale.
Fully customizable styling — line color, width, and style (solid, dashed, dotted).
Efficient cleanup logic — lines and labels refresh dynamically on update.
🧩 Perfect For
Futures and index traders tracking tick increments (e.g., ES, NQ, CL).
Measuring quick scalp targets or ATR-based micro-ranges.
Visualizing equidistant price steps from a key breakout or reversal point.
Created by: PumpC Trading Tools
Version: 1.0 (Pine Script v6)
License: Open for personal use — please credit “PumpC Tick Levels Marker” if reused or modified.
MultiAlert, MultiTargets + TickersThis is my first script, completely made from scratch. Bear with me.
Script that allows one to set an alert for Multiple Price Levels, on Multiple Tickers, complete with Dynamic Messages showing you which ticker, at which price, at which alert (Stop loss, Target 1 etc.), set to Once Per Bar.
Select Ticker, type in price levels that you have for targets & stop loss, move on to the next, or don't and leave 0 and blank.
Disable the targets you do not need in STYLE tab to disable plotting & scaling, leave unused tickers & targets blank & 0.
Create Alert, select this indicator, anyfunction() alert.
MAKE SURE to remake the alert every time you change something, they are not smart enough to change as you change things. Can Confirm by using the numbers in the alert name. You will also have to set the profit level or stop loss to zero every time it triggers to avoid triggered again.
In fact, you do not need the indicator active at all. Add it to a chart and hide it by clicking on the little eyeball icon, to make an alert open the settings for the indicator and type in your targets like normal. Indicator will remain invisable.
I have not found a way to dynamic message the alert name, or else I would.
DISCLAIMER: NONE OF THIS IS FINANCIAL ADVICE. You are completely responsible for whatever happens to you. Do not use the targets in this chart. Do your own research before trading.
Coinbase Premium Index (Custom Tickers)📊 Coinbase Premium Index (Auto Symbol Support)
1. Overview
The Coinbase Premium Index is a widely used indicator to gauge the sentiment difference between US institutional investors (Coinbase Pro) and global retail/futures traders (Binance).
This script calculates the percentage difference between the Coinbase (USD pair) price and the Binance (USDT pair) price.
2. Key Features
🔄 Auto Symbol Matching (New): You no longer need to manually change tickers when switching charts.
If you are looking at a SOL/USDT chart, the indicator automatically detects "SOL" and compares COINBASE:SOLUSD vs BINANCE:SOLUSDT.
🛠 Manual Mode: Includes a manual override option if you wish to compare specific fixed tickers (e.g., strictly BTC).
🎨 Dynamic Visuals:
Histogram: Color-coded bars (Green/Red) indicate positive or negative premiums.
Smart Label: Displays the real-time premium value on the chart. The label color adapts to the trend, and hovering over it shows a Tooltip confirming exactly which tickers are being compared.
3. How to Interpret
The premium indicates the flow of funds and buying pressure:
🟢 Positive Premium (Green Bar):
Coinbase Price > Binance Price
Interpretation: Strong buying pressure from US institutions or spot whales. Often considered a Bullish signal.
🔴 Negative Premium (Red Bar):
Coinbase Price < Binance Price
Interpretation: Strong selling from US investors, or overheated buying in the offshore futures market (Binance). Often considered a Bearish or mean-reversion signal.
4. Settings Guide
Ticker Mode:
Auto (Current Chart): Automatically sets the comparison based on your current chart's base currency (Recommended).
Manual (Custom): Uses the specific tickers defined in the manual input fields below.
Manual Inputs: Enter tickers here if using Manual Mode (Default: COINBASE:BTCUSD vs BINANCE:BTCUSDT).
Bar & Label Settings: Customize colors, transparency, and the vertical position (Y-Offset) of the data label to fit your chart layout.

Bitcoin vs M2 Global Liquidity (Lead 3M) - Table Ticker═══════════════════════════════════════════════════════════════
Bitcoin vs M2 Global Liquidity - Regression Indicator
═══════════════════════════════════════════════════════════════
TECHNICAL SPECS
• Pine Script v6
• Overlay: false (separate pane)
• Data sources: 5 M2 series + 4 FX pairs (request.security)
• Calculation: Rolling OLS linear regression with configurable lead
• Output: Regression line + ±1σ/±2σ confidence bands + R² ticker
CORE FUNCTIONALITY
Aggregates M2 money supply from 5 central banks (CN, US, EU, JP, GB),
converts to USD, applies time-lead, runs rolling linear regression
vs Bitcoin price, plots predicted value with confidence intervals.
CONFIGURABLE PARAMETERS
Input Controls:
• Lead Period: 0-365 days (default: 90)
• Lookback Window: 50-2000 bars (default: 750)
• Bands: Toggle ±1σ and ±2σ visibility
• Colors: BTC, M2, regression line, confidence zones
• Ticker: Position, size, colors, transparency
Advanced Settings:
• Table display: R², lead, M2 total, country breakdown (%)
• Ticker customization: 9 position options, 6 text sizes
• Border: Width 0-10px, color, outline-only mode
DATA AGGREGATION
Sources (via request.security):
• ECONOMICS:CNM2, USM2, EUM2, JPM2, GBM2
• FX_IDC:CNYUSD, JPYUSD (others: FX:EURUSD, GBPUSD)
• Conversion: All M2 → USD → Sum / 1e12 (trillions)
REGRESSION ENGINE
• Arrays: m2Array, btcArray (dynamic sizing, auto-trim)
• Window: Rolling (lookbackPeriod bars)
• Lead: Time-shift via array indexing (i + leadPeriodDays)
• Calc: Manual OLS (covariance/variance), no built-in ta functions
• Outputs: slope, intercept, r2, stdResiduals
CONFIDENCE BANDS
±1σ and ±2σ calculated from standard deviation of residuals.
Fill zones between upper/lower bounds with configurable transparency.
ALERTS
5 pre-configured alertcondition():
• Divergence > 15%
• Price crosses ±1σ bands (up/down)
• Price crosses ±2σ bands (up/down)
TICKER TABLE
Dynamic table.new() with 9 rows:
• R² value (4 decimals)
• Lead period (days + months)
• M2 Global total (trillions USD)
• Country breakdown: CN, US, EU, JP, GB (absolute + %)
• Optional: Hide/show M2 details
VISUAL CUSTOMIZATION
All plot() elements support:
• Color picker inputs (group="Couleurs")
• Line width: 1-3px
• Transparency: 0-100% for zones
• Offset: M2 plot has +leadPeriodDays offset option
PERFORMANCE
• Max arrays size: lookbackPeriod + leadPeriodDays + 200
• Calculations: Only when array.size >= lookbackPeriod + leadPeriodDays
• Table update: barstate.islast (once per bar)
• Request.security: gaps_off mode
CODE STRUCTURE
1. Inputs (lines 7-54)
2. Data fetch (lines 56-76)
3. M2 aggregation (line 78)
4. Array management (lines 84-95)
5. Regression calc (lines 97-172)
6. Prediction + bands (lines 174-183)
7. Plots (lines 185-199)
8. Ticker table (lines 201-236)
9. Alerts (lines 238-246)
DEPENDENCIES
None. Pure Pine Script v6. No external libraries.
LIMITATIONS
• Daily timeframe recommended (1D)
• Requires 750+ bars history for optimal calculation
• M2 data availability: TradingView ECONOMICS feed
• Max lines: 500 (declared in indicator())
CUSTOMIZATION EXAMPLES
• Shorter lookback (200d): More reactive, lower R²
• Longer lookback (1500d): More stable, regime mixing
• No bands: Set showBands=false for clean view
• Different lead: Test 60d, 120d for sensitivity analysis
TECHNICAL NOTES
• Manual OLS implementation (no ta.linreg)
• Array-based lead application (not plot offset)
• M2 values stored in trillions (/ 1e12) for readability
• Residuals array cleared/rebuilt each calculation
OPEN SOURCE
Code fully visible. Modify, fork, analyze freely.
No hidden calculations. No proprietary data.
VERSION
1.0 | November 2025 | Pine Script v6
═══════════════════════════════════════════════════════════════

IDX Utility Set [zidaniee]Purpose
This indicator is not a technical analysis tool. It’s a companion overlay designed to guide your analysis of the uniquely structured Indonesia Stock Exchange (IDX).
Core Features
Centered Ticker Display – Clean, readable ticker shown at the center of the chart.
Company Name – Displays the listed company’s full name.
Active Timeframe – Shows the currently selected timeframe.
Additional Features
ATH & ATL Markers – Labels the All-Time High (ATH) and All-Time Low (ATL) and shows the percentage distance from the latest price to each level, so you can quickly gauge upside/downside room.
IDX Fraction (Tick) Levels – Visualizes Indonesia’s price-fraction (tick) brackets. This matters because tick size changes by price range—very useful for scalpers and fast traders.
ARA/ARB Levels (Realtime) – Plots Auto-Reject Upper (ARA) and Auto-Reject Lower (ARB) levels in real time. Levels refresh in line with IDX trading hours 09:00–16:00 WIB (UTC+7), so your view stays consistent both during and outside market hours. This feature already complies with the latest rules and adjustments set by the Indonesia Stock Exchange (IDX).
Suspension Status – Shows SUSPENDED if the stock is halted/suspended, helping you avoid unnecessary analysis. The suspension check compares today’s date with the last available candle date and accounts for weekends.
Note: WIB = Western Indonesia Time (UTC+7).

Avg Candle Size (Ticks) – Last 9 Closed BarsWhat it does:
Shows the average candle size in ticks for the last N closed bars (defaults to 9). I built this so I can glance at a 5-min chart and instantly know the typical bar size in ticks, updating only after each bar closes (no intrabar wiggle).
How it works:
Measures each bar’s full range (High–Low), not ATR and not candle body.
Averages the last N closed bars, converts to ticks using syminfo.mintick.
Displays a simple line plus a small readout (e.g., “32 ticks”).
Why I built it:
Gives me a realistic sense of current volatility in ticks so I can size stops/targets quickly without doing mental math.
Extras:
Lookback is configurable (default 9).
Optional rounding (floor/nearest/ceil).
Works on any timeframe/instrument that has a defined tick size.
If you want it to match ATR exactly (in ticks), swap the range calc for ta.atr(len) / syminfo.mintick
Average Daily Range in TicksPurpose: The ADR Ticks Indicator calculates and displays the average daily price range of a financial instrument, expressed in ticks, over a user-specified number of days. It provides traders with a measure of average daily volatility, which can be used for position sizing, setting stop-loss/take-profit levels, or assessing market activity.
Calculation: Computes the average daily range by taking the difference between the daily high and low prices, averaging this range over a customizable number of days, and converting the result into ticks (using the instrument's minimum tick size).
Customization: Includes a user input to adjust the number of days for the average calculation and a toggle to show/hide the ADR Ticks value in the table.
Risk Management: Helps traders estimate typical daily price movement to set appropriate stop-loss or take-profit levels.
Market Analysis: Offers insight into average daily volatility, useful for day traders or swing traders assessing whether a market is trending or ranging.
Technical Notes:
The indicator uses barstate.islast to update the table only on the last bar, reducing computational load and preventing overlap.
The script handles different chart timeframes by pulling daily data via request.security, making it robust across various instruments and timeframes.

Normalised Price Crossover - MACD but TickersEver noticed two different tickers are correlated yet have different lags? Ever find one ticker moves first and when the other finally goes to catch up, the first one has already reversed?
So I thought to myself, would be wicked if I took the faster one and made it into a 'Signal Line' and the slow one and made it into a 'Slow Line' almost like a MACD if you will.
So that's what I did, I took the price charts of the tickers and I normalised the price data so they could actually cross, plotted it and sat back to see it generate signals, lo and behold!
Pretty neat, though I'd advise to use spreads and such for the different tickers to really feel the power of the indicator, works well when you use formulas that model actual mechanisms instead of arbitrary price data of different assets as correlation =/= causation.
Enjoy.

COT + ema + aux tickerPurpose: Create a script for backtesting the idea that COT can steer weekly Bias on Forex Market.
How does it works: the script use Commercials Delta Conctract, EMA of the selected ticker, EMA of 2 auxiliary tickers (e.g. correlated ticker) to generates buy and sell signals, it allows to include or not each of these.
If you use all the indicator, The buy or sell signals are generated following that rules:
(Example for buy signals on GBPCAD)
1) Commercials add net contract to GBP futures + remove net contract to CAD
2) EMA of GBPCAD is rising
3) EMA of 1st aux ticker is rising (or decline if select inv option)
4) EMA of 2nd aux ticker is rising (or decline if select inv option)
The scripts set the stop at low of the week for long orders and high of the week for shorts.
The exit strategy is to exit at first week of profit
How could you use it:
1) Choose your FX Ticker e.g. GBPCAD and set 1W TimeFrame
2) Select ticker in the strategy setting, remember to select the currency in right order, if you want to study GBP CAD 1st currency is GBP and 2nd CAD
3) Choose if you want to use EMA (and its period of calculation)
4) Choose if you want to use a aux ticker, the direction, and the relative ema period
What could be better;
1) you can just buy on begin of the week.
2) the exit strategy isn't best you can do
3) No level of delta contract is consider, its generate a buy signial also for 1 contract in the right direction
For any question, suggestion of improvemet, ideas, insult:) write to me
It all started from a script i find here on tradingview that extract COT data. Don't remember the name of that guy but Thanks a lot.
My English isn't perfect but i hope you can understand as well.

Ranked TickThe NYSE TICK is, very simply, the number of stocks ticking down or up at any given time. It is, therefore, an internal indication of buying and selling pressure. By itself, it can be difficult to interpret. This “Ranked Tick” makes the TICK an oscillator that varies from 0 to 100. This indicator can be of great help in determining when the market is overbought or oversold.
This oscillator is a percentile ranking of the high + low of the current bar of the TICK compared to the recent values of the same sum over a certain number of bars, which the user can set as an input, the “Rank Length”. This indicator can be of great help in determining when the market is overbought or oversold.
It was conceived by SergioT for TradeStation, and he was gracious enough to share his TradeStation script with all the traders at elliottwavetrader.net. I transcribed it into Pine Script so that everyone at TradingView could also have it.
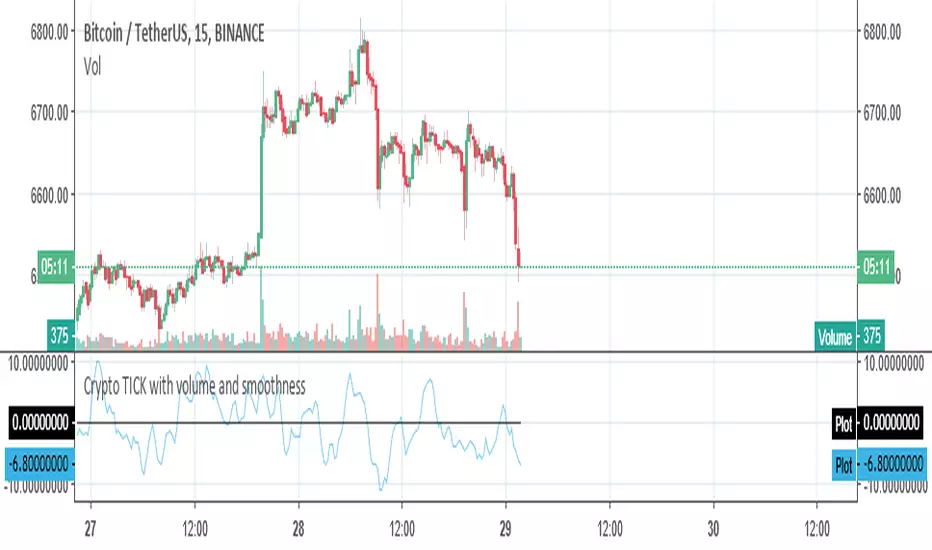
Crypto TICK with volume and smoothnessThis is more or less the TICK index calculated for the cryptos related to USDT pairs in binance. You can change the coins listed in the coins for the ones you want to use. I STRONGLY recommend you leave the default ones or use pairs against USD instead of BTC.
You can see volume ticks and price ticks together or separately and you can smooth both the base data and the indicator.