COT-App//the COT-App generates potential trading signals for commodities and currencies futures based on the weekly COT data of the CFTC
//the COT data commercial netto, commercial short, non commercial short, non commercial long, a commercial netto oscillator, the ratio of commercial short tot he open interest and the open interest (types of COT data) can be shown as chart
//for each type of COT data you can define and set an extreme long and short level
//the COT types commercial netto, commercial short and commercial netto generate potential trading signals if the curve of type of COT data runs into the defined long or short extreme area
//a potential trading signal will be stronger if in additon further types of COT data runs in the same extreme area long or short
//
在脚本中搜索"时创能源app"

VG 1.0This script is an enhanced version of SMC Structures and FVG with an advanced JSON-based alert system designed for seamless integration with webhooks and external applications (such as a Swift iOS app).
What it does
It detects and plots on the chart:
Fair Value Gaps (FVG) — bullish and bearish.
Break of Structure (BOS) and Change of Character (CHOCH).
Key Fibonacci levels (0.786, 0.705, 0.618, 0.5, 0.382) based on the current structure.
Additionally, it generates custom alerts:
FVG Alerts:
When a new FVG is created (bullish or bearish).
When an existing FVG gets mitigated.
BOS & CHOCH Alerts:
Includes breakout direction (bullish or bearish).
Fibonacci Alerts:
When price touches a configured level, with adjustable tick tolerance.
Alerts can be:
Declarative (alertcondition) for manual setup inside TradingView.
Programmatic (alert() JSON) for automated webhook delivery to your system or mobile app.
Key Features
Optional close confirmation to filter out false signals.
Standardized JSON format for direct API or mobile app integration.
Webhook-ready for automated push notifications.
Full visual control with lines, boxes, and labels.
Configurable tick tolerance for Fibonacci “touch” detection.

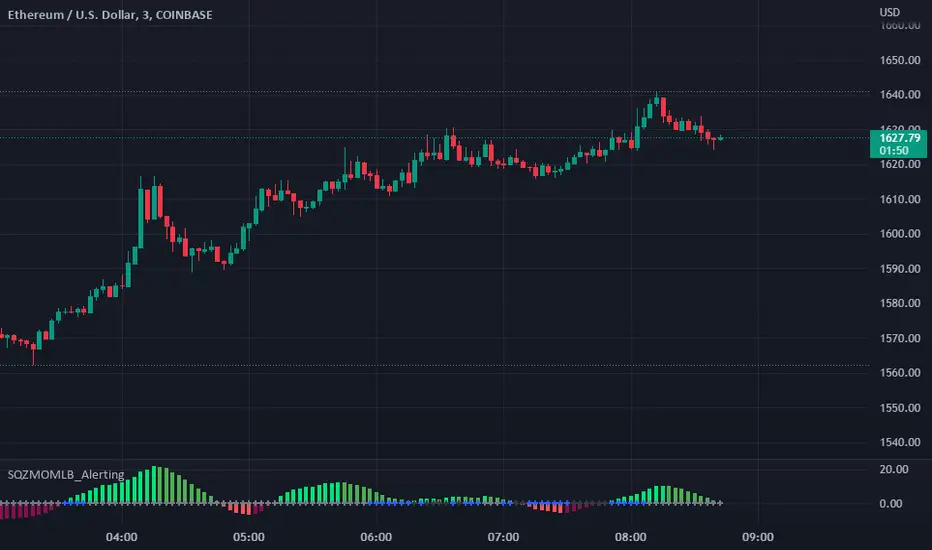
Squeeze Momentum Indicator [LazyBear] added Alerting + webhookA modified version of Squeeze Momentum Indicator visualizing on Price Chart.
author: @LazyBear, modified by @KivancOzbilgic, and by @dgtrd
I took in all of the information as the script below is based on the V2 Script that @LazyBear posted and then added Alerting based on the math and the conditions that @dgtrd added.
Per the description here:
The Squeeze Indicator measures the relationship between Bollinger Bands and Keltner's Channels to help identify consolidations and signal when prices are likely to break out (whether up or down).
The Squeeze Indicator finds sections of the Bollinger Bands which fall inside the Keltner's Channels, and in this case, the market is said to be in a squeeze (indicator turns off, displayed with grey diamond shapes in this study).
When the volatility increases, so does the distance between the bands. Conversely, when the volatility declines, the distance also decreases, and in such cases, the squeeze is said to be released (indicator turns on, displayed with triangle up or triangle down shapes)
Taking the above information and what was in the script was able to base the alert conditions:
So when the condition:
Squeeze On or No Squeeze = In Squeeze
Squeeze Off = Squeeze Release Long or Squeeze Release Long based off conditions.
There are 2 separate alert Types.
1. App, Pop-up, eMail, play sound and Send email to SMS
2. It Is dedicated to Webhook for your various applications.
Alerting Options
i.imgur.com
App Notification
i.imgur.com
i.imgur.com
Webhook test into Discord
i.imgur.com
BitMEX BTC Volatility IndexThis indicator displays the BitMEX BTC Volatility Index ( BVOL24H ) as an indicator and it can be compared to the VIX of the cryptocurrencies.
more information about how BVOL24H is calculated can be found here: www.bitmex.com
Symbol can be changed in the parameters

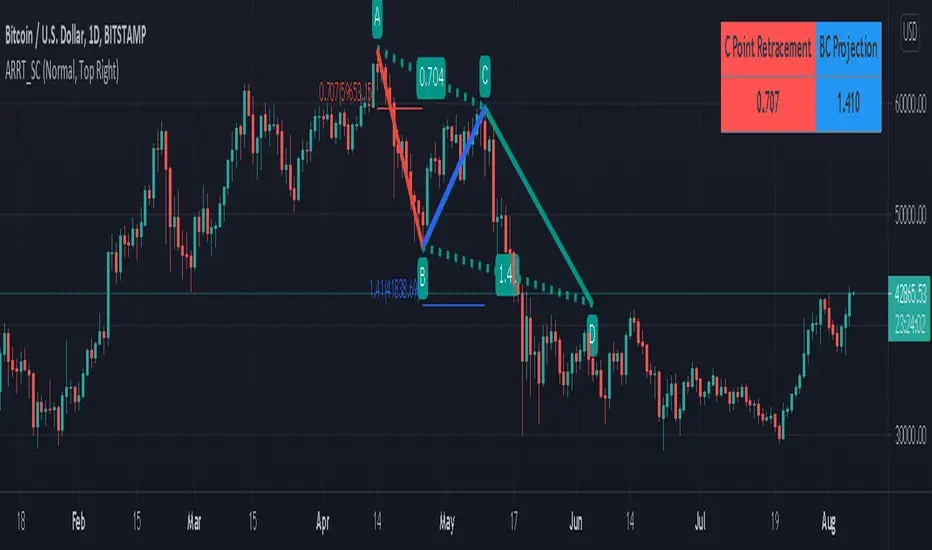
Harmonic Pattern Table (Source Code)This table indicator was intended as helper / reference for using XABCD Pattern.
Indikator berjadual bertujuan sebagai bantuan / rujukan untuk kegunaan XABCD Pattern.
The values shown in table was based on Harmonic Trading Volume 3: Reaction vs. Reversal written by Scott M Carney.
Nilai yang ditunjukkan dalam jadual adalah berdasarkan buku Harmonic Trading Volume 3: Reaction vs. Reversal ditulis oleh Scott M Carney.
Indicator features :
1. List Harmonic Patterns.
2. Font size small for mobile app and font size normal for desktop.
Kemampuan indikator :
1. Senarai Harmonic Pattern.
2. Saiz font kecil untuk mobile app dan saiz size normal untuk desktop.
FAQ
1. Credits / Kredit
Scott M Carney,
Scott M Carney, Trading Volume 3: Reaction vs. Reversal
2. Code Usage / Penggunaan Kod
Free to use for personal usage but credits are most welcomed especially for credits to Scott M Carney.
Bebas untuk kegunaan peribadi tetapi kredit adalah amat dialu-alukan terutamanya kredit kepada Scott M Carney.
Default Settings.
Setting asal.
Setting for selected Harmonic Pattern (Example : Bat)
Setting untuk pilihan Harmonic Pattern (Contoh : Bat)
Setting for show Harmonic Pattern only (Example : Bat)
Setting untuk nama Harmonic Pattern sahaja(Contoh : Bat)

AB=CD Reciprocal Ratios Table (Source Code)This table indicator was intended as helper / reference for using ABCD Pattern.
Indikator berjadual bertujuan sebagai bantuan / rujukan untuk kegunaan ABCD Pattern.
The values shown in table was based on Harmonic Trading : Volume One book written by Scott M Carney.
Details of value, refer Chapter 4 : The AB=CD Pattern (Page 41).
These values are known as AB=CD Reciprocal Ratios.
Nilai yang ditunjukkan dalam jadual adalah berdasarkan buku Harmonic Trading : Volume One ditulis oleh Scott M Carney.
Nilai secara menyeluruh, rujuk Chapter 4 : The AB=CD Pattern (Muka surat 41).
Nilai berikut dipanggil sebagai AB=CD Reciprocal Ratios
Indicator features :
1. List AB=CD Reciprocal Ratios.
2. Font size small for mobile app and font size normal for desktop.
Kemampuan indikator :
1. Senarai AB=CD Reciprocal Ratio.
2. Saiz font kecil untuk mobile app dan saiz size normal untuk desktop.
FAQ
1. Credits / Kredit
Scott M Carney,
2. Code Usage / Penggunaan Kod
Free to use for personal usage but credits are most welcomed especially for credits to Scott M Carney/
Bebas untuk kegunaan peribadi tetapi kredit adalah amat dialu-alukan terutamanya kredit kepada Scott M Carney.
Settings with appropriate value.
Setting dengan nilai yang sesuai.
Default Settings.
Setting asal.
Settings with different table position.
Setting dengan posisi jadual yang berbeza.
MYX Bursa IPO Listing Table (Source Code)This indicator intended for Malaysia Market only for Initial Public Offering (IPO) refer to Bursa Malaysia
Indikator ini adalah untuk pasaran Malaysia sahaja untuk Tawaran Awam Permulaan (IPO) rujuk kepada Bursa Malaysia
Indicator features :
1. List similar symbol or counter based on year including total.
2. Font size small for mobile app and font size normal for desktop.
Kemampuan indikator :
1. Senarai simbol atau kaunter yang terlibat mengiku tahun termasuk jumlah.
2. Saiz font kecil untuk mobile app dan saiz size normal untuk desktop.
FAQ
1. Code Usage / Penggunaan Kod
Free to use for personal usage but credits are most welcomed.
Not for business / commercial usage, any damage or lialibity are not my resposibility.
Bebas untuk kegunaan peribadi tetapi kredit adalah amat dialu-alukan.
Bukan untuk kegunaan perniagaan / komersil, sebarang kerosakan atau liability adalah di luar tanggungjawab saya.
2. Update Frequency / Frekuensi
Anytime after official update by Bursa Malaysia.
Bila-bila masa selepas kemaskini rasmi oleh Bursa Malaysia
3. Symbol/Counter not showing / Simbol/kaunter tiada
Symbol/counter not longer exist or not yet updated.
Simbol/kaunter telah tersenarai keluar atau belum dikemaskini.
4. Why table overlap with chart ? To avoid this, click indicator > Visual Order > Send to Front.
Kenapa table bertindih dengan carta ? Untuk mengatasi ini, klik indikator > Visual Order > Send to Front.
All Setting enabled.
Semua seting diaktifkan.
Small Font setting enabled, suitable for mobile app.
Setting font kecil diaktifkan., sesuai untuk mobile app.
Setting by year.
Setting mengikut tahun.

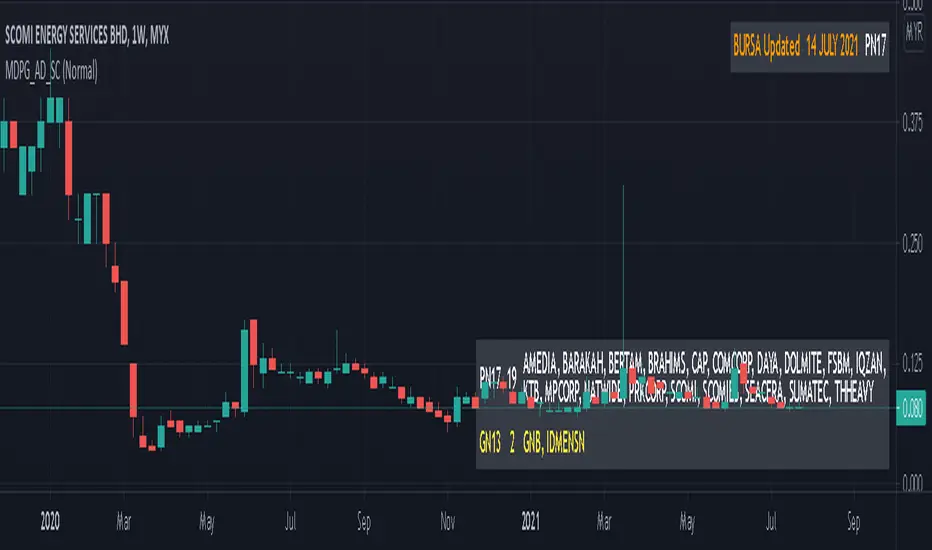
MYX Delisted PN17 GN13 Auto Detect (Source Code)This indicator intended for Malaysia Market only for auto detect delisted companies (PN17, GN13) refer to Bursa Malaysia
Indikator ini adalah untuk pasaran Malaysia sahaja untuk automatik mengenalpasti senarai syarikat terkeluar rujuk kepada Bursa Malaysia
Indicator features :
1. Able to detect stock and warrant.
2. List similar symbol or counter including total.
3. Font size small for mobile app and font size normal for desktop.
4. Show date updated by Bursa Malaysia.
Kemampuan indikator :
1. Boleh mengenal pasti saham dan waran.
2. Senarai simbol atau kaunter yang terlibat termasuk jumlah.
3. Saiz font kecil untuk mobile app dan saiz size normal untuk desktop.
4. Memaparkan tarikh kemaskini oleh Bursa Malaysia.
Date Updated / Tarikh Kemaskini : 14/7/2021
FAQ
1. Credits / Kredit
LucF & PineCoders
2. Code Usage / Penggunaan Kod
Free to use for personal usage but credits are most welcomed.
Not for business / comercial usage, any damage or lialibity are not my resposibility.
Bebas untuk kegunaan peribadi tetapi kredit adalah amat dialu-alukan.
Bukan untuk kegunaan perniagaan / komersil, sebarang kerosakan atau liability adalah di luar tanggungjawab saya.
3. Update Frequency / Frekuensi
Anytime after official update by Bursa Malaysia.
Bila-bila masa selepas kemaskini rasmi oleh Bursa Malaysia
4. Symbol/Counter not showing / Simbol/kaunter tiada
Symbol/counter not longer exist or not yet updated.
Simbol/kaunter telah tersenarai keluar atau belum dikemaskini.
Single layout with font size normal
Satu layout dengan saiz font normal
Double layout with small font size (Left : Stock, Right : Warrant)
Dua layout dengan font saiz normal (Kiri : Saham, Kanan : Waran)
Double EMA CROSS
Double EMA CROSS (DEC)
Useful for identifying and receiving alerts about uptrends and downtrends.
This script uses two Exponential Moving Averages (EMAs) to find price uptrends and downtrends.
An Exponential Moving Average ( EMA ) is a type of moving average that places a greater weight and significance on the most recent data points.
The script produces uptrend and downtrend signals based on crossovers and divergences between the two EMAs,
the user will be able to spot a trend change (when the EMAs crossover) and to determine the strength of the current trend (when the EMAs diverge).
It is also posible to get alerts for uptrends and downtrends on the web and mobile app with sound and pop-ups as well as via email.
The optimal time to enter and exit the market can be concluded from this trend changes.
The user can set their own EMAs, by default they are set to 25 and 75 periods for medium and long term respectively.
When the medium term EMA crosses below the long term EMA the asset is in a downtrend and the price will decline, and when the
medium term EMA crosses above the long term EMA the asset is in an uptrend and price will increase.
This scripts plots the following indicators and signals on the chart to help the user to identify trends:
1.- Medium and long term EMAs as lines overlaid on the price chart.
2.- Up green triangles above bars when the price is on an uptrend and down red triangles below bars when the price is on a downtrend.
3.- Arrows with text to indicate the start of an uptrend or downtrend.
The user can enable and disable the indicators and signals as well as set colors and shapes to their liking.
This script also lets the user create alerts for uptrends and downtrends. To create a new alert using this script follow this instructions:
1.- Once you added this script to your chart, go to the alerts panel (right on web or bottom tool bar on the mobile app) and add a new alert (alarm clock icon with a plus sign).
2.- A modal window will open. On the “Condition” dropdown menu select “DEC”.
3.- On the next dropdown menu (right below the “Condition” one) you can select.
4.- Lastly you can set all the normal alert options and create the alert.

EMA CrossoversUseful for identifying and receiving alerts about uptrends and downtrends.
This script uses two Exponential Moving Averages (EMAs) to find price uptrends and downtrends. An Exponential Moving Average (EMA) is a type of moving average that places a greater weight and significance on the most recent data points. The script produces uptrend and downtrend signals based on crossovers and divergences between the two EMAs, the user will be able to spot a trend change (when the EMAs crossover) and to determine the strength of the current trend (when the EMAs diverge). It is also posible to get alerts for uptrends and downtrends on the web and mobile app with sound and pop-ups as well as via email. The optimal time to enter and exit the market can be concluded from this trend changes.
The user can set their own EMAs, by default they are set to 21 and 55 periods for medium and long term respectively. When the medium term EMA crosses below the long term EMA the asset is in a downtrend and the price will decline, and when the medium term EMA crosses above the long term EMA the asset is in an uptrend and price will increase.
This scripts plots the following indicators and signals on the chart to help the user to identify trends:
1.- Medium and long term EMAs as lines overlaid on the price chart.
2.- Up green triangles above bars when the price is on an uptrend and down red triangles below bars when the price is on a downtrend.
3.- Arrows with text to indicate the start of an uptrend or downtrend.
The user can enable and disable the indicators and signals as well as set colors and shapes to their liking.
This script also lets the user create alerts for uptrends and downtrends. To create a new alert using this script follow this instructions:
1.- Once you added this script to your chart, go to the alerts panel (right on web or bottom tool bar on the mobile app) and add a new alert (alarm clock icon with a plus sign).
2.- A modal window will open. On the “Condition” dropdown menu select “EMA Crossovers”.
3.- On the next dropdown menu (right below the “Condition” one) you can select from two types of alerts “Uptrend started” and “Downtrend started”.
4.- Lastly you can set all the normal alert options and create the alert.

Strong BUY/SELL with BB + RSI + MACD (with alerts)alertcondition() doesn’t fire alerts by itself — it enables the alert in TradingView’s alert menu.
Once you add this script to a chart, you can go to Alerts → Create Alert → Condition → (your script name).
You’ll see BUY Signal and SELL Signal in the dropdown.
You can then choose notification type: popup, email, SMS, app push, or webhook (for bots)

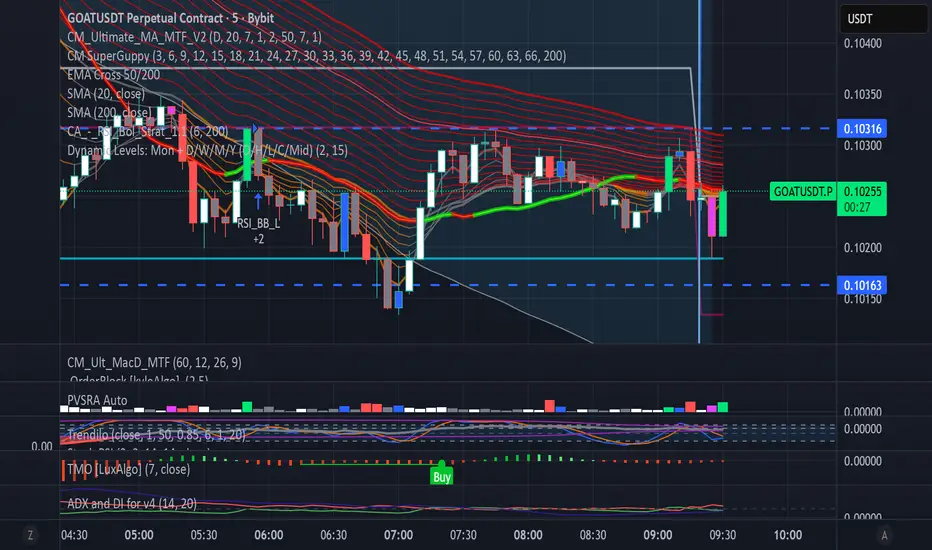
Dynamic Levels: Mon + D/W/M/Y (O/H/L/C/Mid)Purpose!
This Pine Script plots key reference levels (Open,High,Low,Close,Mid) for Monday,Daily,Weekly, Monthly, and Yearly timeframes.
All levels update live while the bar is forming. ( intrabar updates).
USAGE
Add the script to Pine Editor on TradingView (desktop Web)
Save - Add to chart
On mobile app: Find it under indicators - My scripts.
Great for identifying key reaction zones (opens,mids,previous closes).
Simple Technicals Table📊 Simple Technicals Table
🎯 A comprehensive technical analysis dashboard displaying key pivot points and moving averages across multiple timeframes
📋 OVERVIEW
The Simple Technicals Table is a powerful indicator that organizes essential trading data into a clean, customizable table format. It combines Fibonacci-based pivot points with critical moving averages for both daily and weekly timeframes, giving traders instant access to key support/resistance levels and trend information.
Perfect for:
Technical analysts studying multi-timeframe data
Chart readers needing quick reference levels
Market researchers analyzing price patterns
Educational purposes and data visualization
🚀 KEY FEATURES
📊 Dual Timeframe Analysis
Daily (D1) and Weekly (W1) data side-by-side
Real-time updates as market conditions change
Seamless comparison between timeframes
🎯 Fibonacci Pivot Points
R3, R2, R1 : Resistance levels using Fibonacci ratios (38.2%, 61.8%, 100%)
PP : Central pivot point from previous period's data
S1, S2, S3 : Support levels with same methodology
📈 Complete EMA Suite
EMA 10 : Short-term trend identification
EMA 20 : Popular swing trading reference
EMA 50 : Medium-term trend confirmation
EMA 100 : Institutional support/resistance
EMA 200 : Long-term trend determination
📊 Essential Indicators
RSI 14 : Momentum for overbought/oversold conditions
ATR 14 : Volatility measurement for risk management
🎨 Full Customization
9 table positions : Place anywhere on your chart
5 text sizes : Tiny to huge for optimal visibility
Custom colors : Background, headers, and text
Optional pivot lines : Visual weekly levels on chart
⚙️ HOW IT WORKS
Fibonacci Pivot Calculation:
Pivot Point (PP) = (High + Low + Close) / 3
Range = High - Low
Resistance Levels:
R1 = PP + (Range × 0.382)
R2 = PP + (Range × 0.618)
R3 = PP + (Range × 1.000)
Support Levels:
S1 = PP - (Range × 0.382)
S2 = PP - (Range × 0.618)
S3 = PP - (Range × 1.000)
Smart Price Formatting:
< $1: 5 decimal places (crypto-friendly)
$1-$10: 4 decimal places
$10-$100: 3 decimal places
> $100: 2 decimal places
📊 TECHNICAL ANALYSIS APPLICATIONS
⚠️ EDUCATIONAL PURPOSE ONLY
This indicator is designed solely for technical analysis and educational purposes . It provides data visualization to help understand market structure and price relationships.
📈 Data Analysis Uses
Support & Resistance Identification : Visualize Fibonacci-based pivot levels
Trend Analysis : Study EMA relationships and price positioning
Multi-Timeframe Study : Compare daily and weekly technical data
Market Structure : Understand key technical levels and indicators
📚 Educational Benefits
Learn about Fibonacci pivot point calculations
Understand moving average relationships
Study RSI and ATR indicator values
Practice multi-timeframe technical analysis
🔍 Data Visualization Features
Organized table format for easy data reading
Color-coded levels for quick identification
Real-time technical indicator values
Historical data integrity maintained
🛠️ SETUP GUIDE
1. Installation
Search "Simple Technicals Table" in indicators
Add to chart (appears in middle-left by default)
Table displays automatically on any timeframe
2. Customization
Table Position : Choose from 9 locations
Text Size : Adjust for screen resolution
Colors : Match your chart theme
Pivot Lines : Toggle weekly level visualization
3. Optimization Tips
Use larger text on mobile devices
Dark backgrounds work well with light text
Enable pivot lines for visual reference
✅ BEST PRACTICES
Recommended Usage:
Use for technical analysis and educational study only
Combine with other analytical methods for comprehensive analysis
Study multi-timeframe data relationships
Practice understanding technical indicator values
Important Notes:
Levels based on previous period's data
Most effective in trending markets
No repainting - uses confirmed data only
Works on all instruments and timeframes
🔧 TECHNICAL SPECS
Performance:
Pine Script v5 optimized code
Minimal CPU/memory usage
Real-time data updates
No lookahead bias
Compatibility:
All chart types (Candlestick, Bar, Line)
Any instrument (Stocks, Forex, Crypto, etc.)
All timeframes supported
Mobile and desktop friendly
Data Accuracy:
Precise floating-point calculations
Historical data integrity maintained
No future data leakage
📱 DEVICE SUPPORT
✅ Desktop browsers (Chrome, Firefox, Safari, Edge)
✅ TradingView mobile app (iOS/Android)
✅ TradingView desktop application
✅ Light and dark themes
✅ All screen resolutions
📋 VERSION INFO
Version 1.0 - Initial Release
Fibonacci-based pivot calculations
Dual timeframe support (Daily/Weekly)
Complete EMA suite (10, 20, 50, 100, 200)
RSI and ATR indicators
Fully customizable interface
Optional pivot line visualization
Smart price formatting
Mobile-optimized display
⚠️ DISCLAIMER
This indicator is designed for technical analysis, educational and informational purposes ONLY . It provides data visualization and technical calculations to help users understand market structure and price relationships.
⚠️ NOT FOR TRADING DECISIONS
This tool does NOT provide trading signals or investment advice
All data is for analytical and educational purposes only
Users should not base trading decisions solely on this indicator
Always conduct thorough research and analysis before making any financial decisions
📚 Educational Use Only
Use for learning technical analysis concepts
Study market data and indicator relationships
Practice chart reading and data interpretation
Understand mathematical calculations behind technical indicators
The Simple Technicals Table provides technical data visualization to assist in market analysis education. It does not constitute financial advice, trading recommendations, or investment guidance. Users are solely responsible for their own research and decisions.
Author: ToTrieu
Version: 1.0
Category: Technical Analysis / Support & Resistance
License: Open source for educational use
💬 Questions? Comments? Feel free to reach out!

Strat Failed 2-Up/2-Down Scanner v2**Strat Failed 2-Up/2-Down Scanner**
The Strat Failed 2-Up/2-Down Scanner is designed for traders using The Strat methodology, developed by Rob Smith, to identify key reversal patterns in any market and timeframe. This indicator detects two specific candlestick patterns: Failed 2-Up (bearish) and Failed 2-Down (bullish), which signal potential reversals when a directional move fails to follow through.
**What It Does**
- **Failed 2-Up**: Identifies a bearish candle where the low and high are higher than the previous candle’s low and high, but the close is below the open, indicating a failed attempt to continue an uptrend. These are marked with a red candlestick, a red downward triangle above the bar, and a table entry.
- **Failed 2-Down**: Identifies a bullish candle where the high and low are lower than the previous candle’s high and low, but the close is above the open, signaling a failed downtrend. These are marked with a green candlestick, a green upward triangle below the bar, and a table entry.
- A table in the top-right corner displays the signal type ("Failed 2-Up" or "Failed 2-Down") and the ticker symbol for quick reference.
- Alerts are provided for both patterns, making the indicator compatible with TradingView’s screener for automated scanning.
**How It Works**
The indicator analyzes each candlestick’s high, low, and close relative to the previous candle:
- Failed 2-Up: `low > low `, `high > high `, `close < open`.
- Failed 2-Down: `high < high `, `low < low `, `close > open`.
When these conditions are met, the indicator applies visual markers (colored bars and triangles) and updates the signal table. Alert conditions trigger notifications for integration with TradingView’s alert system.
**How to Use**
1. Apply the indicator to any chart (stocks, forex, crypto, etc.) on any timeframe (e.g., 1-minute, hourly, daily).
2. Monitor the chart for red (Failed 2-Up) or green (Failed 2-Down) candlesticks with corresponding triangles.
3. Check the top-right table for the latest signal and ticker.
4. Set alerts by selecting “Failed 2-Up Detected” or “Failed 2-Down Detected” in TradingView’s alert menu to receive notifications (e.g., via email or app).
5. Use the signals to identify potential reversal setups in conjunction with other Strat-based analysis, such as swing levels or time-based strategies.
**Originality**
Unlike other Strat indicators that may focus on swing levels or complex candlestick combinations, this scanner specifically targets Failed 2-Up and Failed 2-Down patterns with clear, minimalist visualizations (bars, triangles, table) and robust alert functionality. Its simplicity makes it accessible for both novice and experienced traders using The Strat methodology.
**Ideal For**
Day traders, swing traders, and scalpers looking to capitalize on reversal signals in trending or ranging markets. The indicator is versatile for any asset class and timeframe, enhancing trade decision-making with The Strat’s pattern-based approach.

RTH Levels: VWAP + PDH/PDL + ONH/ONL + IBAlgo Index — Levels Pro (ONH/ONL • PDH/PDL • VWAP±Bands • IB • Gaps)
Purpose. A session-aware, non-repainting levels tool for intraday decision-making. Designed for futures and indices, with clean visuals, alerts, and a one-click Minimal Mode for screenshot-ready charts.
What it plots
• PDH/PDL (RTH-only) – Prior Regular Trading Hours high/low, computed intraday and frozen at the RTH close (no 24h mix-ups, no repainting).
• ONH/ONL – Prior Overnight high/low, held throughout RTH.
• RTH VWAP with ±σ bands – Volume-weighted variance, reset each RTH.
• Initial Balance (IB) – First N minutes of RTH, plus 1.5× / 2.0× extensions after IB completes.
• Today’s RTH Open & Prior RTH Close – With gap detection and “gap filled” alert.
• Killzone shading – NY Open (09:30–10:30 ET) and Lunch (11:15–13:30 ET).
• Values panel (top-right) – Each level with live distance in points & ticks.
• Right-edge level tags – With anti-overlap (stagger + vertical jitter).
• Price-scale tags – Native trackprice markers that always “stick” to the axis.
⸻
New in v6.4
• Minimal Mode: one click for a clean look (thinner lines, VWAP bands/IB extensions hidden, on-chart right-edge labels off; price-scale tags remain).
• Theme presets: Dark Hi-Contrast / Light Minimal / Futures Classic / Muted Dark.
• Anti-overlap controls: horizontal staggering, vertical jitter, and baseline offset to keep tags readable even when levels cluster.
⸻
Quick start (2 minutes)
1. Add to chart → keep defaults.
2. Sessions (ET):
• RTH Session default: 09:30–16:00 (US equities cash hours).
• Overnight Session default: 18:00–09:29.
Adjust for your market if you use different “day” hours (e.g., many use 08:20–13:30 ET for COMEX Gold).
3. Theme & Minimal Mode: pick a Theme Preset; enable Minimal Mode for screenshots.
4. Visibility: toggle PD/ON/VWAP/IB/References/Panel to taste.
5. Right-edge labels: turn Show Right-Edge Labels on. If they crowd, tune:
• Anti-overlap: min separation (ticks)
• Horizontal offset per tag (bars)
• Vertical jitter per step (ticks)
• Right-edge baseline offset (bars)
6. Alerts: open Add alert → Condition: and pick the events you want.
⸻
How levels are computed (no repainting)
• PDH/PDL: Intraday H/L are accumulated only while in RTH and saved at RTH close for “yesterday’s” values.
• ONH/ONL: Accumulated across the defined Overnight window and then held during RTH.
• RTH VWAP & ±σ: Volume-weighted mean and standard deviation, reset at the RTH open.
• IB: First N minutes of RTH (default 60). Extensions (1.5×/2.0×) appear after IB completes.
• Gaps: Today’s RTH open vs prior RTH close; “Gap Filled” triggers when price trades back to prior close.
⸻
Practical playbooks (how to trade around the levels)
1) PDH/PDL interactions
• Rejection: Price taps PDH/PDL then closes back inside → mean-reversion toward VWAP/IB.
• Acceptance: Close/hold beyond PDH/PDL with momentum → continuation to next HTF/IB target.
• Alert: PD Touch/Break.
2) ONH/ONL “taken”
• Often one ON extreme is taken during RTH. ONH Taken / ONL Taken → check if it’s a clean break or sweep & reclaim.
• Sweep + reclaim near VWAP can fuel rotations through the ON range.
3) VWAP ±σ framework
• Balanced: First tag of ±1σ often reverts toward VWAP.
• Trend: Persistent trade beyond ±1σ + IB break → target ±2σ/±3σ.
• Alerts: VWAP Cross and VWAP Reject (cross then immediate fail back).
4) IB breaks
• After IB completes, a clean IB break commonly targets 1.5× and sometimes 2.0×.
• Quick return inside IB = possible fade back to the opposite IB edge/VWAP.
• Alerts: IB Break Up / Down.
5) Gaps
• Gap-and-go: Opening drive away from prior close + VWAP support → trend until IB completion.
• Gap-fill: Weak open and VWAP overhead/underfoot → trade toward prior close; manage on Gap Filled alert.
Pro tip: Stack confluences (e.g., ONL sweep + VWAP reclaim + IB hold) and respect your execution rules (e.g., require a 5-minute close in direction, or your order-flow confirmation).
⸻
Inputs you’ll actually touch
• Sessions (ET): Session Timezone, RTH Session, Overnight Session.
• Visibility: toggles for PD/ON/VWAP/IB/Ref/Panel.
• VWAP bands: set σ multipliers (±1/±2/±3).
• IB: duration (minutes) and extension multipliers (1.5× / 2.0×).
• Style & Theme: Theme Preset, Main Line Width, Trackprice, Minimal Mode, and anti-overlap controls.
⸻
Alerts included
• PD Touch/Break — High ≥ PDH or Low ≤ PDL
• ONH Taken / ONL Taken — First in-RTH take of ONH/ONL
• VWAP Cross — Close crosses VWAP
• VWAP Reject — Cross then immediate fail back
• IB Break Up / Down — Break of IB High/Low after IB completes
• Gap Filled — Price trades back to prior RTH close
Setup: Add alert → Condition: Algo Index — Levels Pro → choose event → message → Notify on app/email.
⸻
Panel guide
The top-right panel shows each level plus live distance from last price:
LevelValue (Δpoints | Δticks)
Coloring: green if level is below current price, red if above.
⸻
Styling & screenshot tips
• Use Theme Preset that matches your chart.
• For dark charts, “Dark Hi-Contrast” with Main Line Width = 3 works well.
• Enable Trackprice for crisp axis tags that always stick to the right edge.
• Turn on Minimal Mode for cleaner screenshots (no VWAP bands or IB extensions, on-chart tags off; price-scale tags remain).
• If tags crowd, increase min separation (ticks) to 30–60 and horizontal offset to 3–5; add vertical jitter (4–12 ticks) and/or push tags farther right with baseline offset (bars).
⸻
Behavior & limitations
• Levels are computed incrementally; tables refresh on the last bar for efficiency.
• Right-edge labels are placed at bar_index + offset and do not track extra right-margin scrolling (TradingView limitation). The price-scale tags (from trackprice) do track the axis.
• “RTH” is what you define in inputs. If your market uses different day hours, change the session strings so PDH/PDL reflect your definition of “yesterday’s session.”
⸻
FAQ
Q: My PDH/PDL don’t match the daily chart.
A: By design this uses RTH-only highs/lows, not 24h daily bars. Adjust sessions if you want a different definition.
Q: Right-edge tags overlap or don’t sit at the far right.
A: Increase min separation / horizontal offset / vertical jitter and/or push tags farther with baseline offset. If you want markers that always hug the axis, rely on Trackprice.
Q: Can I change killzones?
A: Yes—edit the session strings in settings or request a version with user inputs for custom windows.
⸻
Disclaimer
Educational use only. This is not financial advice. Always apply your own risk management and confirmation rules.
⸻
Enjoy it? Please ⭐ the script and share screenshots using Minimal Mode + a Theme Preset that fits your style.

Clean Multi-Indicator Alignment System
Overview
A sophisticated multi-indicator alignment system designed for 24/7 trading across all markets, with pure signal-based exits and no time restrictions. Perfect for futures, forex, and crypto markets that operate around the clock.
Key Features
🎯 Multi-Indicator Confluence System
EMA Cross Strategy: Fast EMA (5) and Slow EMA (10) for precise trend direction
VWAP Integration: Institution-level price positioning analysis
RSI Momentum: 7-period RSI for momentum confirmation and reversal detection
MACD Signals: Optimized 8/17/5 configuration for scalping responsiveness
Volume Confirmation: Customizable volume multiplier (default 1.6x) for signal validation
🚀 Advanced Entry Logic
Initial Full Alignment: Requires all 5 indicators + volume confirmation
Smart Continuation Entries: EMA9 pullback entries when trend momentum remains intact
Flexible Time Controls: Optional session filtering or 24/7 operation
🎪 Pure Signal-Based Exits
No Forced Closes: Positions exit only on technical signal reversals
Dual Exit Conditions: EMA9 breakdown + RSI flip OR MACD cross + EMA20 breakdown
Trend Following: Allows profitable trends to run their full course
Perfect for Swing Scalping: Ideal for multi-session position holding
📊 Visual Interface
Real-Time Status Dashboard: Live alignment monitoring for all indicators
Color-Coded Candles: Instant visual confirmation of entry/exit signals
Clean Chart Display: Toggle-able EMAs and VWAP with professional styling
Signal Differentiation: Clear labels for entries, X-crosses for exits
🔔 Alert System
Entry Notifications: Separate alerts for buy/sell signals
Exit Warnings: Technical breakdown alerts for position management
Mobile Ready: Push notifications to TradingView mobile app
Market Applications
Perfect For:
Gold Futures (GC): 24-hour precious metals trading
NASDAQ Futures (NQ): High-volatility index scalping
Forex Markets: Currency pairs with continuous operation
Crypto Trading: 24/7 cryptocurrency momentum plays
Energy Futures: Oil, gas, and commodity swing trades
Optimal Timeframes:
1-5 Minutes: Ultra-fast scalping during high volatility
5-15 Minutes: Balanced approach for most markets
15-30 Minutes: Swing scalping for trend following
🧠 Smart Position Management
Tracks implied position direction
Prevents conflicting signals
Allows trend continuation entries
State-aware exit logic
⚡ Scalping Optimized
Fast-reacting indicators with shorter periods
Volume-based confirmation reduces false signals
Clean entry/exit visualization
Minimal lag for time-sensitive trades
Configuration Options
All parameters fully customizable:
EMA Lengths: Adjustable from 1-30 periods
RSI Period: 1-14 range for different market conditions
MACD Settings: Fast (1-15), Slow (1-30), Signal (1-10)
Volume Confirmation: 0.5-5.0x multiplier range
Visual Preferences: Colors, displays, and table options
Risk Management Features
Clear visual exit signals prevent emotion-based decisions
Volume confirmation reduces false breakouts
Multi-indicator confluence improves signal quality
Optional time filtering for session-specific strategies
Best Use Cases
Futures Scalping: NQ, ES, GC during active sessions
Forex Swing Trading: Major pairs during overlap periods
Crypto Momentum: Bitcoin, Ethereum trend following
24/7 Automated Systems: Algorithmic trading implementation
Multi-Market Scanning: Portfolio-wide signal monitoring

Terminal de Estrategias PRO (MTF + Order Blocks)this is a new test for the implementation of functions on my app web for signals


CandelaCharts - HTF Sweeps📝 Overview
This indicator lets you overlay a higher timeframe (HTF) onto your current chart, giving you a clearer view of broader market movements without switching timeframes.
This indicator also detects liquidity sweeps and plots them on both the higher timeframe (HTF) and the current lower timeframe (LTF), helping traders clearly spot potential reversal points. It adds LTF dividers for better structure clarity, making it easier to align with HTF shifts and refine entry timing with greater precision.
📦 Features
This indicator identifies price sweeps and their invalidations, helping traders spot potential liquidity grabs and failed breakout attempts.
Overlay a configurable higher timeframe (HTF) on the current chart
Detects and plots liquidity sweeps on both HTF and LTF
Adds lower timeframe (LTF) dividers for improved structure clarity
Ideal for ICT-style top-down analysis and precision entries without switching charts
⚙️ Settings
Customize the indicator to suit your strategy. Alert options are also available, so you can stay informed when key market events are triggered.
Timeframes: Select the higher timeframe (HTF) to overlay on your current chart.
HTF Coloring: Customize the color scheme for HTF candles.
HTF Offset: Space of HTF Candles and current chart.
HTF Size: Adjust the size of HTF candles.
HTF Labels: Toggle labels for HTF.
LTF H/L Line: Show or hide high/low lines from the lower timeframe.
LTF O/C Line: Display open/close lines from the lower timeframe.
Sweep: Enable detection and plotting of liquidity sweeps.
I-sweep: Toggle invalidated sweep detection.
Alerts: Enable Sweep Formation or Invalidation alerts
⚡️ Showcase
See the indicator applied in live market scenarios, illustrating how sweep detections and invalidations unfold on various charts.
HTF Candles
HTF Sweeps
LTF Sweeps
Invalidated Sweeps
🚨 Alerts
This indicator includes built-in alert functionality to keep you informed of key market events in real time. It supports the following customizable alerts on TradingView:
Sweep Detection: Notifies you when a price sweep is detected—either a liquidity sweep above recent highs or below recent lows. This can be a strong signal of potential reversals or liquidity grabs by larger market participants.
Sweep Invalidation: Alerts you when a previously detected sweep becomes invalidated due to price action moving beyond a defined threshold. This helps traders stay adaptive and avoid acting on outdated signals.
These alerts are fully integrated with TradingView’s native alert system, so you can receive notifications via app, email, or pop-up—ensuring you're always up to date, even when you're away from the chart.
⚠️ Disclaimer
Trading involves significant risk, and many participants may incur losses. The content on this site is not intended as financial advice and should not be interpreted as such. Decisions to buy, sell, hold, or trade securities, commodities, or other financial instruments carry inherent risks and are best made with guidance from qualified financial professionals. Past performance is not indicative of future results.

Red Report Filter x 'Bull_Trap_9'Hello Traders!
This one is my favorite.
This is indicator / filter: '2 of 2.'
'1 of 2' is the, 'Closed Market Filter,' I posted before this that you may like.
Again, I prefer 'Filter' over 'Indicator' because this Pine Script code does not interact with the actual price data.
It makes handling high impact reports effortless.
As you all know; if you're on a Prop and breach a 'Red,' you lose your account.
This will filter up to 5 reports. More than enough unless you're on EURUSD!
It offers both 'Red' and 'Orange' report control.
The default window times of 15 / 6 are programmed for red events. You can always alter the base code for your desired, 'Before / After.'
Click the tooltip for more info.
How to use:
You do need to update the inputs daily with the current report times before each open.
I trade YM / US markets. Those reports are very repetitive on their delivery times, so I usually leave a 10:00 setting in slot 1. I then toggle it 'On' or 'Off' per demand.
Just open the dialogue box and it is pretty self explanatory.
I used task scheduler for a lot of years, but that wasn't very reliable, modest work to set up daily and a lot of times I may not hear it or it malfunctions because of a Windows update.
TradingView has the little icon that floats from the bottom right, but who really looks for that.
Any audio alert is subject to fail for a number of reasons.
This filter REDS the screen in your face. Leaves no doubt about what's coming.
I know there may be other apps and options out there, but this filter is integral to the TradingView chart itself embedded through Pine Script. It is right there, a click away, easy to input data, and as long as your chart is active and working, the filter will fire.
I did not build an alert condition into this, but I'm sure that could be an option if you want to program in audio as well.
Please Note: Only when the price candles push into the filter zone, will the filter start to display. Run a test a minute from the current price candle and you can see how it functions.
I appreciate your interest.

Adaptive Cycle Oscillator with EMADescription of the Adaptive Cycle Oscillator with EMA Pine Script
This Pine Script, titled "Adaptive Cycle Oscillator with EMA", is a custom technical indicator designed for TradingView to help traders analyze market cycles and identify potential buy or sell opportunities. It combines an Adaptive Cycle Oscillator (ACO) with multiple Exponential Moving Averages (EMAs), displayed as colorful, wavy lines, and includes features like buy/sell signals and divergence detection. Below is a beginner-friendly explanation of how the script works, adhering to TradingView's Script Publishing Rules.
What This Indicator Does
The Adaptive Cycle Oscillator with EMA helps you:
Visualize market cycles using an oscillator that adapts to price movements.
Track trends with seven EMAs of different lengths, plotted as a rainbow of wavy lines.
Identify potential buy or sell signals when the oscillator crosses predefined thresholds.
Spot divergences between the oscillator and price to anticipate reversals.
Use customizable settings to adjust the indicator to your trading style.
Note: This is a technical analysis tool and does not guarantee profits. Always combine it with other analysis methods and practice risk management.
Step-by-Step Explanation for New Users
1. Understanding the Indicator
Adaptive Cycle Oscillator (ACO): The ACO analyzes price data (based on high, low, and close prices, or HLC3) to detect market cycles. It smooths price movements to create an oscillator that swings between overbought and oversold levels.
EMAs: Seven EMAs of different lengths are applied to the ACO and scaled based on the market's dominant cycle. These EMAs are plotted as colorful, wavy lines to show trend direction.
Buy/Sell Signals: The script generates signals when the ACO crosses above or below user-defined thresholds, indicating potential entry or exit points.
Divergence Detection: The script identifies bullish or bearish divergences between the ACO and the fastest EMA, which may signal potential reversals.
Visual Style: The indicator uses a rainbow of seven colors (red, orange, yellow, green, blue, indigo, violet) for the EMAs, with wavy lines for a unique visual effect. Static levels (zero, overbought, oversold) are also wavy for consistency.
2. How to Add the Indicator to Your Chart
Open TradingView and load the chart of any asset (e.g., stock, forex, crypto).
Click on the Indicators button at the top of the chart.
Search for "Adaptive Cycle Oscillator with EMA" (or paste the script into TradingView’s Pine Editor if you have access to it).
Click to add the indicator to your chart. It will appear in a separate panel below the price chart.
3. Customizing the Indicator
The script offers several input options to tailor it to your needs:
Base Cycle Length (Default: 20): Sets the initial period for calculating the dominant cycle. Higher values make the indicator slower; lower values make it more sensitive.
Alpha Smoothing (Default: 0.07): Controls how much the ACO smooths price data. Smaller values produce smoother results.
Show Buy/Sell Signals (Default: True): Toggle to display green triangles (buy) and red triangles (sell) on the chart.
Threshold (Default: 0.0): Defines overbought (above threshold) and oversold (below threshold) levels. Adjust to widen or narrow signal zones.
EMA Base Length (Default: 10): Sets the starting length for the fastest EMA. Other EMAs are incrementally longer (12, 14, 16, etc.).
Divergence Lookback (Default: 14): Determines how far back the script looks to detect divergences.
To adjust these:
Right-click the indicator on your chart and select Settings.
Modify the inputs in the pop-up window.
Click OK to apply changes.
4. Reading the Indicator
Oscillator and EMAs: The ACO and seven EMAs are plotted in a separate panel. The EMAs (colored lines) move in a wavy pattern:
Red (fastest) to Violet (slowest) represent different response speeds.
When the faster EMAs (e.g., red, orange) are above slower ones (e.g., blue, violet), it suggests bullish momentum, and vice versa.
Zero Line: A gray wavy line at zero acts as a neutral level. The ACO above zero indicates bullish conditions; below zero indicates bearish conditions.
Overbought/Oversold Lines: Red (overbought) and green (oversold) wavy lines mark threshold levels. Extreme ACO values near these lines may suggest reversals.
Buy/Sell Signals:
Green Triangle (Bottom): Appears when the ACO crosses above the oversold threshold, suggesting a potential buy.
Red Triangle (Top): Appears when the ACO crosses below the overbought threshold, suggesting a potential sell.
Divergences:
Green Triangle (Bottom): Indicates a bullish divergence (price makes a lower low, but the EMA makes a higher low), hinting at a potential upward reversal.
Red Triangle (Top): Indicates a bearish divergence (price makes a higher high, but the EMA makes a lower high), hinting at a potential downward reversal.
5. Using Alerts
You can set alerts for key events:
Right-click the indicator and select Add Alert.
Choose a condition (e.g., "ACO Buy Signal", "Bullish Divergence").
Configure the alert settings (e.g., notify via email, app, or pop-up).
Click Create to activate the alert.
Available alert conditions:
ACO Buy Signal: When the ACO crosses above the oversold threshold.
ACO Sell Signal: When the ACO crosses below the overbought threshold.
Bullish Divergence: When a potential upward reversal is detected.
Bearish Divergence: When a potential downward reversal is detected.
6. Tips for Using the Indicator
Combine with Other Tools: Use the indicator alongside support/resistance levels, candlestick patterns, or other indicators (e.g., RSI, MACD) for confirmation.
Test on Different Timeframes: The indicator works on any timeframe (e.g., 1-minute, daily). Shorter timeframes may produce more signals but with more noise.
Practice Risk Management: Never rely solely on this indicator. Set stop-losses and position sizes to manage risk.
Backtest First: Use TradingView’s Strategy Tester (if you convert the script to a strategy) to evaluate performance on historical data.
Compliance with TradingView’s Script Publishing Rules
This description adheres to TradingView’s Script Publishing Rules (as outlined in the provided link):
No Performance Claims: The description avoids promising profits or specific results, emphasizing that the indicator is a tool for analysis.
Clear Instructions: It provides step-by-step guidance for adding, customizing, and using the indicator.
Risk Disclaimer: It notes that trading involves risks and the indicator should be used with other analysis methods.
No Misleading Terms: Terms like “buy” and “sell” are used to describe signals, not guaranteed actions.
Transparency: The description explains the indicator’s components (ACO, EMAs, signals, divergences) without exaggerating its capabilities.
No External Links: The description avoids linking to external resources or soliciting users.
Educational Tone: It focuses on educating users about the indicator’s functionality.
Limitations
Not a Standalone System: The indicator is not a complete trading strategy. It provides insights but requires additional analysis.
Lagging Nature: As with most oscillators and EMAs, signals may lag behind price movements, especially in fast markets.
False Signals: Signals and divergences may not always lead to successful trades, particularly in choppy markets.
Market Dependency: Performance varies across assets and market conditions (e.g., trending vs. ranging markets).

Smart Bar Counter with Alerts🚀 Smart Bar Counter with Alerts 🚀
-----------------------------------------------------
Overview
-----------------------------------------------------
Ever wanted to count a specific number of bars from a key point on your chart—such as after a Break of Structure (BOS), the start of a new trading session, or from any point of interest— without having to stare at the screen?
This "Smart Bar Counter" indicator was created to solve this exact problem. It's a simple yet powerful tool that allows you to define a custom "Start Point" and a "Target Bar Count." Once the target count is reached, it can trigger an Alert to notify you immediately.
-----------------------------------------------------
Key Features
-----------------------------------------------------
• Manual Start Point: Precisely select the date and time from which you want the count to begin, offering maximum flexibility in your analysis.
• Custom Bar Target: Define exactly how many bars you want to count, whether it's 50, 100, or 200 bars.
• On-Chart Display: A running count is displayed on each bar after the start time, allowing you to visually track the progress.
• Automatic Alerts: Set up alerts to be notified via TradingView's various channels (pop-up, mobile app, email) once the target count is reached.
-----------------------------------------------------
How to Use
-----------------------------------------------------
1. Add this indicator to your chart.
2. Go to the indicator's Settings (Gear Icon ⚙️).
- Select Start Time: Set the date and time you wish to begin counting.
- Number of Bars to Count: Input your target number.
3. Set up the Alert ( Very Important! ).
- Right-click on the chart > Select " Add alert ."
- In the " Condition " dropdown, select this indicator: Smart Bar Counter with Alerts .
- In the next dropdown, choose the available alert condition.
- Set " Options " to Once Per Bar Close .
- Choose your desired notification methods under " Alert Actions ."
- Click " Create ."
-----------------------------------------------------
Use Cases
-----------------------------------------------------
• Post-Event Analysis: Count bars after a key event like a Break of Structure (BOS) or Change of Character (CHoCH) to observe subsequent price action.
• Time-based Analysis: Use it to count bars after a market open for a specific session (e.g., London, New York).
• Strategy Backtesting: Useful for testing trading rules that are based on time or a specific number of bars.
-----------------------------------------------------
Final Words
-----------------------------------------------------
Hope you find this indicator useful for your analysis and trading strategies! Feel free to leave comments or suggestions below.
