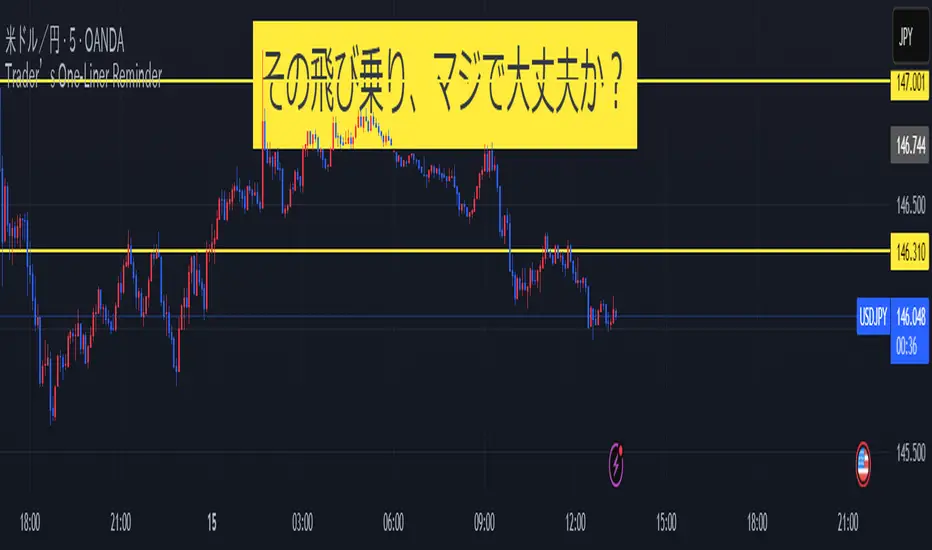
Trader’s One-Liner Reminder⚠️ このインジケーターは日本語でのメッセージ表示に特化しています。英語でのリマインドは含まれていません。
This script displays reminders only in Japanese.
【日本語説明】
本インジケーターは、日本時間(JST)8:00〜翌1:00までの時間帯に合わせて、15分刻みで一言メッセージを表示します。
トレード中の焦りや過信を防ぐための心理的リマインダーとして設計されています。
- 「Frankモード」では、関西弁風のユーモアあるメッセージを自動表示
- 「Customモード」では、全時間帯のメッセージを自分で自由に設定可能
- メッセージはチャート上部中央に、大きな文字・黄色背景で表示され、視認性にも配慮
💡ポジポジ病対策、メンタル強化、時間管理などに最適です。
---
【English Description】
This indicator displays motivational reminders in Japanese every 15 minutes from 8:00 JST to 1:00 JST (the next day).
It is designed to support traders mentally during market hours.
- “Frank mode” automatically shows prewritten humorous messages (in Kansai dialect tone)
- “Custom mode” lets users input their own message for each 15-minute time block
- Messages are shown in large text at the top-center of the chart with a yellow background for clear visibility
💡 Ideal for discipline, overtrading prevention, and improving trading psychology.
---
🔔 This indicator is intended for Japanese-speaking users. If you'd like an English version, feel free to fork and customize it!
在脚本中搜索"机械革命无界15+时不时闪屏"
The VoVix Experiment The VoVix Experiment
The VoVix Experiment is a next-generation, regime-aware, volatility-adaptive trading strategy for futures, indices, and more. It combines a proprietary VoVix (volatility-of-volatility) anomaly detector with price structure clustering and critical point logic, only trading when multiple independent signals align. The system is designed for robustness, transparency, and real-world execution.
Logic:
VoVix Regime Engine: Detects pre-move volatility anomalies using a fast/slow ATR ratio, normalized by Z-score. Only trades when a true regime spike is detected, not just random volatility.
Cluster & Critical Point Filters: Price structure and volatility clustering must confirm the VoVix signal, reducing false positives and whipsaws.
Adaptive Sizing: Position size scales up for “super-spikes” and down for normal events, always within user-defined min/max.
Session Control: Trades only during user-defined hours and days, avoiding illiquid or high-risk periods.
Visuals: Aurora Flux Bands (From another Original of Mine (Options Flux Flow): glow and change color on signals, with a live dashboard, regime heatmap, and VoVix progression bar for instant insight.
Backtest Settings
Initial capital: $10,000
Commission: Conservative, realistic roundtrip cost:
15–20 per contract (including slippage per side) I set this to $25
Slippage: 3 ticks per trade
Symbol: CME_MINI:NQ1!
Timeframe: 15 min (but works on all timeframes)
Order size: Adaptive, 1–2 contracts
Session: 5:00–15:00 America/Chicago (default, fully adjustable)
Why these settings?
These settings are intentionally strict and realistic, reflecting the true costs and risks of live trading. The 10,000 account size is accessible for most retail traders. 25/contract including 3 ticks of slippage are on the high side for MNQ, ensuring the strategy is not curve-fit to perfect fills. If it works here, it will work in real conditions.
Forward Testing: (This is no guarantee. I've provided these results to show that executions perform as intended. Test were done on Tradovate)
ALL TRADES
Gross P/L: $12,907.50
# of Trades: 64
# of Contracts: 186
Avg. Trade Time: 1h 55min 52sec
Longest Trade Time: 55h 46min 53sec
% Profitable Trades: 59.38%
Expectancy: $201.68
Trade Fees & Comm.: $(330.95)
Total P/L: $12,576.55
Winning Trades: 59.38%
Breakeven Trades: 3.12%
Losing Trades: 37.50%
Link: www.dropbox.com
Inputs & Tooltips
VoVix Regime Execution: Enable/disable the core VoVix anomaly detector.
Volatility Clustering: Require price/volatility clusters to confirm VoVix signals.
Critical Point Detector: Require price to be at a statistically significant distance from the mean (regime break).
VoVix Fast ATR Length: Short ATR for fast volatility detection (lower = more sensitive).
VoVix Slow ATR Length: Long ATR for baseline regime (higher = more stable).
VoVix Z-Score Window: Lookback for Z-score normalization (higher = smoother, lower = more reactive).
VoVix Entry Z-Score: Minimum Z-score for a VoVix spike to trigger a trade.
VoVix Exit Z-Score: Z-score below which the regime is considered decayed (exit).
VoVix Local Max Window: Bars to check for local maximum in VoVix (higher = stricter).
VoVix Super-Spike Z-Score: Z-score for “super” regime events (scales up position size).
Min/Max Contracts: Adaptive position sizing range.
Session Start/End Hour: Only trade between these hours (exchange time).
Allow Weekend Trading: Enable/disable trading on weekends.
Session Timezone: Timezone for session filter (e.g., America/Chicago for CME).
Show Trade Labels: Show/hide entry/exit labels on chart.
Flux Glow Opacity: Opacity of Aurora Flux Bands (0–100).
Flux Band EMA Length: EMA period for band center.
Flux Band ATR Multiplier: Width of bands (higher = wider).
Compliance & Transparency
* No hidden logic, no repainting, no pyramiding.
* All signals, sizing, and exits are fully explained and visible.
* Backtest settings are stricter than most real accounts.
* All visuals are directly tied to the strategy logic.
* This is not a mashup or cosmetic overlay; every component is original and justified.
Disclaimer
Trading is risky. This script is for educational and research purposes only. Do not trade with money you cannot afford to lose. Past performance is not indicative of future results. Always test in simulation before live trading.
Proprietary Logic & Originality Statement
This script, “The VoVix Experiment,” is the result of original research and development. All core logic, algorithms, and visualizations—including the VoVix regime detection engine, adaptive execution, volatility/divergence bands, and dashboard—are proprietary and unique to this project.
1. VoVix Regime Logic
The concept of “volatility of volatility” (VoVix) is an original quant idea, not a standard indicator. The implementation here (fast/slow ATR ratio, Z-score normalization, local max logic, super-spike scaling) is custom and not found in public TradingView scripts.
2. Cluster & Critical Point Logic
Volatility clustering and “critical point” detection (using price distance from a rolling mean and standard deviation) are general quant concepts, but the way they are combined and filtered here is unique to this script. The specific logic for “clustered chop” and “critical point” is not a copy of any public indicator.
3. Adaptive Sizing
The adaptive sizing logic (scaling contracts based on regime strength) is custom and not a standard TradingView feature or public script.
4. Time Block/Session Control
The session filter is a common feature in many strategies, but the implementation here (with timezone and weekend control) is written from scratch.
5. Aurora Flux Bands (From another Original of Mine (Options Flux Flow)
The “glowing” bands are inspired by the idea of volatility bands (like Bollinger Bands or Keltner Channels), but the visual effect, color logic, and integration with regime signals are original to this script.
6. Dashboard, Watermark, and Metrics
The dashboard, real-time Sharpe/Sortino, and VoVix progression bar are all custom code, not copied from any public script.
What is “standard” or “common quant practice”?
Using ATR, EMA, and Z-score are standard quant tools, but the way they are combined, filtered, and visualized here is unique. The structure and logic of this script are original and not a mashup of public code.
This script is 100% original work. All logic, visuals, and execution are custom-coded for this project. No code or logic is directly copied from any public or private script.
Use with discipline. Trade your edge.
— Dskyz, for DAFE Trading Systems

Bober XM v2.0# ₿ober XM v2.0 Trading Bot Documentation
**Developer's Note**: While our previous Bot 1.3.1 was removed due to guideline violations, this setback only fueled our determination to create something even better. Rising from this challenge, Bober XM 2.0 emerges not just as an update, but as a complete reimagining with multi-timeframe analysis, enhanced filters, and superior adaptability. This adversity pushed us to innovate further and deliver a strategy that's smarter, more agile, and more powerful than ever before. Challenges create opportunity - welcome to Cryptobeat's finest work yet.
## !!!!You need to tune it for your own pair and timeframe and retune it periodicaly!!!!!
## Overview
The ₿ober XM v2.0 is an advanced dual-channel trading bot with multi-timeframe analysis capabilities. It integrates multiple technical indicators, customizable risk management, and advanced order execution via webhook for automated trading. The bot's distinctive feature is its separate channel systems for long and short positions, allowing for asymmetric trade strategies that adapt to different market conditions across multiple timeframes.
### Key Features
- **Multi-Timeframe Analysis**: Analyze price data across multiple timeframes simultaneously
- **Dual Channel System**: Separate parameter sets for long and short positions
- **Advanced Entry Filters**: RSI, Volatility, Volume, Bollinger Bands, and KEMAD filters
- **Machine Learning Moving Average**: Adaptive prediction-based channels
- **Multiple Entry Strategies**: Breakout, Pullback, and Mean Reversion modes
- **Risk Management**: Customizable stop-loss, take-profit, and trailing stop settings
- **Webhook Integration**: Compatible with external trading bots and platforms
### Strategy Components
| Component | Description |
|---------|-------------|
| **Dual Channel Trading** | Uses either Keltner Channels or Machine Learning Moving Average (MLMA) with separate settings for long and short positions |
| **MLMA Implementation** | Machine learning algorithm that predicts future price movements and creates adaptive bands |
| **Pivot Point SuperTrend** | Trend identification and confirmation system based on pivot points |
| **Three Entry Strategies** | Choose between Breakout, Pullback, or Mean Reversion approaches |
| **Advanced Filter System** | Multiple customizable filters with multi-timeframe support to avoid false signals |
| **Custom Exit Logic** | Exits based on OBV crossover of its moving average combined with pivot trend changes |
### Note for Novice Users
This is a fully featured real trading bot and can be tweaked for any ticker — SOL is just an example. It follows this structure:
1. **Indicator** – gives the initial signal
2. **Entry strategy** – decides when to open a trade
3. **Exit strategy** – defines when to close it
4. **Trend confirmation** – ensures the trade follows the market direction
5. **Filters** – cuts out noise and avoids weak setups
6. **Risk management** – controls losses and protects your capital
To tune it for a different pair, you'll need to start from scratch:
1. Select the timeframe (candle size)
2. Turn off all filters and trend entry/exit confirmations
3. Choose a channel type, channel source and entry strategy
4. Adjust risk parameters
5. Tune long and short settings for the channel
6. Fine-tune the Pivot Point Supertrend and Main Exit condition OBV
This will generate a lot of signals and activity on the chart. Your next task is to find the right combination of filters and settings to reduce noise and tune it for profitability.
### Default Strategy values
Default values are tuned for: Symbol BITGET:SOLUSDT.P 5min candle
Filters are off by default: Try to play with it to understand how it works
## Configuration Guide
### General Settings
| Setting | Description | Default Value |
|---------|-------------|---------------|
| **Long Positions** | Enable or disable long trades | Enabled |
| **Short Positions** | Enable or disable short trades | Enabled |
| **Risk/Reward Area** | Visual display of stop-loss and take-profit zones | Enabled |
| **Long Entry Source** | Price data used for long entry signals | hl2 (High+Low/2) |
| **Short Entry Source** | Price data used for short entry signals | hl2 (High+Low/2) |
The bot allows you to trade long positions, short positions, or both simultaneously. Each direction has its own set of parameters, allowing for fine-tuned strategies that recognize the asymmetric nature of market movements.
### Multi-Timeframe Settings
1. **Enable Multi-Timeframe Analysis**: Toggle 'Enable Multi-Timeframe Analysis' in the Multi-Timeframe Settings section
2. **Configure Timeframes**: Set appropriate higher timeframes based on your trading style:
- Timeframe 1: Default is now 15 minutes (intraday confirmation)
- Timeframe 2: Default is 4 hours (trend direction)
3. **Select Sources per Indicator**: For each indicator (RSI, KEMAD, Volume, etc.), choose:
- The desired timeframe (current, mtf1, or mtf2)
- The appropriate price type (open, high, low, close, hl2, hlc3, ohlc4)
### Entry Strategies
- **Breakout**: Enter when price breaks above/below the channel
- **Pullback**: Enter when price pulls back to the channel
- **Mean Reversion**: Enter when price is extended from the channel
You can enable different strategies for long and short positions.
### Core Components
### Risk Management
- **Position Size**: Control risk with percentage-based position sizing
- **Stop Loss Options**:
- Fixed: Set a specific price or percentage from entry
- ATR-based: Dynamic stop-loss based on market volatility
- Swing: Uses recent swing high/low points
- **Take Profit**: Multiple targets with percentage allocation
- **Trailing Stop**: Dynamic stop that follows price movement
## Advanced Usage Strategies
### Moving Average Type Selection Guide
- **SMA**: More stable in choppy markets, good for higher timeframes
- **EMA/WMA**: More responsive to recent price changes, better for entry signals
- **VWMA**: Adds volume weighting for stronger trends, use with Volume filter
- **HMA**: Balance between responsiveness and noise reduction, good for volatile markets
### Multi-Timeframe Strategy Approaches
- **Trend Confirmation**: Use higher timeframe RSI (mtf2) for overall trend, current timeframe for entries
- **Entry Precision**: Use KEMAD on current timeframe with volume filter on mtf1
- **False Signal Reduction**: Apply RSI filter on mtf1 with strict KEMAD settings
### Market Condition Optimization
| Market Condition | Recommended Settings |
|------------------|----------------------|
| **Trending** | Use Breakout strategy with KEMAD filter on higher timeframe |
| **Ranging** | Use Mean Reversion with strict RSI filter (mtf1) |
| **Volatile** | Increase ATR multipliers, use HMA for moving averages |
| **Low Volatility** | Decrease noise parameters, use pullback strategy |
## Webhook Integration
The strategy features a professional webhook system that allows direct connectivity to your exchange or trading platform of choice through third-party services like 3commas, Alertatron, or Autoview.
The webhook payload includes all necessary parameters for automated execution:
- Entry price and direction
- Stop loss and take profit levels
- Position size
- Custom identifier for webhook routing
## Performance Optimization Tips
1. **Start with Defaults**: Begin with the default settings for your timeframe before customizing
2. **Adjust One Component at a Time**: Make incremental changes and test the impact
3. **Match MA Types to Market Conditions**: Use appropriate moving average types based on the Market Condition Optimization table
4. **Timeframe Synergy**: Create logical relationships between timeframes (e.g., 5min chart with 15min and 4h higher timeframes)
5. **Periodic Retuning**: Markets evolve - regularly review and adjust parameters
## Common Setups
### Crypto Trend-Following
- MLMA with EMA or HMA
- Higher RSI thresholds (75/25)
- KEMAD filter on mtf1
- Breakout entry strategy
### Stock Swing Trading
- MLMA with SMA for stability
- Volume filter with higher threshold
- KEMAD with increased filter order
- Pullback entry strategy
### Forex Scalping
- MLMA with WMA and lower noise parameter
- RSI filter on current timeframe
- Use highest timeframe for trend direction only
- Mean Reversion strategy
## Webhook Configuration
- **Benefits**:
- Automated trade execution without manual intervention
- Immediate response to market conditions
- Consistent execution of your strategy
- **Implementation Notes**:
- Requires proper webhook configuration on your exchange or platform
- Test thoroughly with small position sizes before full deployment
- Consider latency between signal generation and execution
### Backtesting Period
Define a specific historical period to evaluate the bot's performance:
| Setting | Description | Default Value |
|---------|-------------|---------------|
| **Start Date** | Beginning of backtest period | January 1, 2025 |
| **End Date** | End of backtest period | December 31, 2026 |
- **Best Practice**: Test across different market conditions (bull markets, bear markets, sideways markets)
- **Limitation**: Past performance doesn't guarantee future results
## Entry and Exit Strategies
### Dual-Channel System
A key innovation of the Bober XM is its dual-channel approach:
- **Independent Parameters**: Each trade direction has its own channel settings
- **Asymmetric Trading**: Recognizes that markets often behave differently in uptrends versus downtrends
- **Optimized Performance**: Fine-tune settings for both bullish and bearish conditions
This approach allows the bot to adapt to the natural asymmetry of markets, where uptrends often develop gradually while downtrends can be sharp and sudden.
### Channel Types
#### 1. Keltner Channels
Traditional volatility-based channels using EMA and ATR:
| Setting | Long Default | Short Default |
|---------|--------------|---------------|
| **EMA Length** | 37 | 20 |
| **ATR Length** | 13 | 17 |
| **Multiplier** | 1.4 | 1.9 |
| **Source** | low | high |
- **Strengths**:
- Reliable in trending markets
- Less prone to whipsaws than Bollinger Bands
- Clear visual representation of volatility
- **Weaknesses**:
- Can lag during rapid market changes
- Less effective in choppy, non-trending markets
#### 2. Machine Learning Moving Average (MLMA)
Advanced predictive model using kernel regression (RBF kernel):
| Setting | Description | Options |
|---------|-------------|--------|
| **Source MA** | Price data used for MA calculations | Any price source (low/high/close/etc.) |
| **Moving Average Type** | Type of MA algorithm for calculations | SMA, EMA, WMA, VWMA, RMA, HMA |
| **Trend Source** | Price data used for trend determination | Any price source (close default) |
| **Window Size** | Historical window for MLMA calculations | 5+ (default: 16) |
| **Forecast Length** | Number of bars to forecast ahead | 1+ (default: 3) |
| **Noise Parameter** | Controls smoothness of prediction | 0.01+ (default: ~0.43) |
| **Band Multiplier** | Multiplier for channel width | 0.1+ (default: 0.5-0.6) |
- **Strengths**:
- Predictive rather than reactive
- Adapts quickly to changing market conditions
- Better at identifying trend reversals early
- **Weaknesses**:
- More computationally intensive
- Requires careful parameter tuning
- Can be sensitive to input data quality
### Entry Strategies
| Strategy | Description | Ideal Market Conditions |
|----------|-------------|-------------------------|
| **Breakout** | Enters when price breaks through channel bands, indicating strong momentum | High volatility, emerging trends |
| **Pullback** | Enters when price retraces to the middle band after testing extremes | Established trends with regular pullbacks |
| **Mean Reversion** | Enters at channel extremes, betting on a return to the mean | Range-bound or oscillating markets |
#### Breakout Strategy (Default)
- **Implementation**: Enters long when price crosses above the upper band, short when price crosses below the lower band
- **Strengths**: Captures strong momentum moves, performs well in trending markets
- **Weaknesses**: Can lead to late entries, higher risk of false breakouts
- **Optimization Tips**:
- Increase channel multiplier for fewer but more reliable signals
- Combine with volume confirmation for better accuracy
#### Pullback Strategy
- **Implementation**: Enters long when price pulls back to middle band during uptrend, short during downtrend pullbacks
- **Strengths**: Better entry prices, lower risk, higher probability setups
- **Weaknesses**: Misses some strong moves, requires clear trend identification
- **Optimization Tips**:
- Use with trend filters to confirm overall direction
- Adjust middle band calculation for market volatility
#### Mean Reversion Strategy
- **Implementation**: Enters long at lower band, short at upper band, expecting price to revert to the mean
- **Strengths**: Excellent entry prices, works well in ranging markets
- **Weaknesses**: Dangerous in strong trends, can lead to fighting the trend
- **Optimization Tips**:
- Implement strong trend filters to avoid counter-trend trades
- Use smaller position sizes due to higher risk nature
### Confirmation Indicators
#### Pivot Point SuperTrend
Combines pivot points with ATR-based SuperTrend for trend confirmation:
| Setting | Default Value |
|---------|---------------|
| **Pivot Period** | 25 |
| **ATR Factor** | 2.2 |
| **ATR Period** | 41 |
- **Function**: Identifies significant market turning points and confirms trend direction
- **Implementation**: Requires price to respect the SuperTrend line for trade confirmation
#### Weighted Moving Average (WMA)
Provides additional confirmation layer for entries:
| Setting | Default Value |
|---------|---------------|
| **Period** | 15 |
| **Source** | ohlc4 (average of Open, High, Low, Close) |
- **Function**: Confirms trend direction and filters out low-quality signals
- **Implementation**: Price must be above WMA for longs, below for shorts
### Exit Strategies
#### On-Balance Volume (OBV) Based Exits
Uses volume flow to identify potential reversals:
| Setting | Default Value |
|---------|---------------|
| **Source** | ohlc4 |
| **MA Type** | HMA (Options: SMA, EMA, WMA, RMA, VWMA, HMA) |
| **Period** | 22 |
- **Function**: Identifies divergences between price and volume to exit before reversals
- **Implementation**: Exits when OBV crosses its moving average in the opposite direction
- **Customizable MA Type**: Different MA types provide varying sensitivity to OBV changes:
- **SMA**: Traditional simple average, equal weight to all periods
- **EMA**: More weight to recent data, responds faster to price changes
- **WMA**: Weighted by recency, smoother than EMA
- **RMA**: Similar to EMA but smoother, reduces noise
- **VWMA**: Factors in volume, helpful for OBV confirmation
- **HMA**: Reduces lag while maintaining smoothness (default)
#### ADX Exit Confirmation
Uses Average Directional Index to confirm trend exhaustion:
| Setting | Default Value |
|---------|---------------|
| **ADX Threshold** | 35 |
| **ADX Smoothing** | 60 |
| **DI Length** | 60 |
- **Function**: Confirms trend weakness before exiting positions
- **Implementation**: Requires ADX to drop below threshold or DI lines to cross
## Filter System
### RSI Filter
- **Function**: Controls entries based on momentum conditions
- **Parameters**:
- Period: 15 (default)
- Overbought level: 71
- Oversold level: 23
- Multi-timeframe support: Current, MTF1 (15min), or MTF2 (4h)
- Customizable price source (open, high, low, close, hl2, hlc3, ohlc4)
- **Implementation**: Blocks long entries when RSI > overbought, short entries when RSI < oversold
### Volatility Filter
- **Function**: Prevents trading during excessive market volatility
- **Parameters**:
- Measure: ATR (Average True Range)
- Period: Customizable (default varies by timeframe)
- Threshold: Adjustable multiplier
- Multi-timeframe support
- Customizable price source
- **Implementation**: Blocks trades when current volatility exceeds threshold × average volatility
### Volume Filter
- **Function**: Ensures adequate market liquidity for trades
- **Parameters**:
- Threshold: 0.4× average (default)
- Measurement period: 5 (default)
- Moving average type: Customizable (HMA default)
- Multi-timeframe support
- Customizable price source
- **Implementation**: Requires current volume to exceed threshold × average volume
### Bollinger Bands Filter
- **Function**: Controls entries based on price relative to statistical boundaries
- **Parameters**:
- Period: Customizable
- Standard deviation multiplier: Adjustable
- Moving average type: Customizable
- Multi-timeframe support
- Customizable price source
- **Implementation**: Can require price to be within bands or breaking out of bands depending on strategy
### KEMAD Filter (Kalman EMA Distance)
- **Function**: Advanced trend confirmation using Kalman filter algorithm
- **Parameters**:
- Process Noise: 0.35 (controls smoothness)
- Measurement Noise: 24 (controls reactivity)
- Filter Order: 6 (higher = more smoothing)
- ATR Length: 8 (for bandwidth calculation)
- Upper Multiplier: 2.0 (for long signals)
- Lower Multiplier: 2.7 (for short signals)
- Multi-timeframe support
- Customizable visual indicators
- **Implementation**: Generates signals based on price position relative to Kalman-filtered EMA bands
## Risk Management System
### Position Sizing
Automatically calculates position size based on account equity and risk parameters:
| Setting | Default Value |
|---------|---------------|
| **Risk % of Equity** | 50% |
- **Implementation**:
- Position size = (Account equity × Risk %) ÷ (Entry price × Stop loss distance)
- Adjusts automatically based on volatility and stop placement
- **Best Practices**:
- Start with lower risk percentages (1-2%) until strategy is proven
- Consider reducing risk during high volatility periods
### Stop-Loss Methods
Multiple stop-loss calculation methods with separate configurations for long and short positions:
| Method | Description | Configuration |
|--------|-------------|---------------|
| **ATR-Based** | Dynamic stops based on volatility | ATR Period: 14, Multiplier: 2.0 |
| **Percentage** | Fixed percentage from entry | Long: 1.5%, Short: 1.5% |
| **PIP-Based** | Fixed currency unit distance | 10.0 pips |
- **Implementation Notes**:
- ATR-based stops adapt to changing market volatility
- Percentage stops maintain consistent risk exposure
- PIP-based stops provide precise control in stable markets
### Trailing Stops
Locks in profits by adjusting stop-loss levels as price moves favorably:
| Setting | Default Value |
|---------|---------------|
| **Stop-Loss %** | 1.5% |
| **Activation Threshold** | 2.1% |
| **Trailing Distance** | 1.4% |
- **Implementation**:
- Initial stop remains fixed until profit reaches activation threshold
- Once activated, stop follows price at specified distance
- Locks in profit while allowing room for normal price fluctuations
### Risk-Reward Parameters
Defines the relationship between risk and potential reward:
| Setting | Default Value |
|---------|---------------|
| **Risk-Reward Ratio** | 1.4 |
| **Take Profit %** | 2.4% |
| **Stop-Loss %** | 1.5% |
- **Implementation**:
- Take profit distance = Stop loss distance × Risk-reward ratio
- Higher ratios require fewer winning trades for profitability
- Lower ratios increase win rate but reduce average profit
### Filter Combinations
The strategy allows for simultaneous application of multiple filters:
- **Recommended Combinations**:
- Trending markets: RSI + KEMAD filters
- Ranging markets: Bollinger Bands + Volatility filters
- All markets: Volume filter as minimum requirement
- **Performance Impact**:
- Each additional filter reduces the number of trades
- Quality of remaining trades typically improves
- Optimal combination depends on market conditions and timeframe
### Multi-Timeframe Filter Applications
| Filter Type | Current Timeframe | MTF1 (15min) | MTF2 (4h) |
|-------------|-------------------|-------------|------------|
| RSI | Quick entries/exits | Intraday trend | Overall trend |
| Volume | Immediate liquidity | Sustained support | Market participation |
| Volatility | Entry timing | Short-term risk | Regime changes |
| KEMAD | Precise signals | Trend confirmation | Major reversals |
## Visual Indicators and Chart Analysis
The bot provides comprehensive visual feedback on the chart:
- **Channel Bands**: Keltner or MLMA bands showing potential support/resistance
- **Pivot SuperTrend**: Colored line showing trend direction and potential reversal points
- **Entry/Exit Markers**: Annotations showing actual trade entries and exits
- **Risk/Reward Zones**: Visual representation of stop-loss and take-profit levels
These visual elements allow for:
- Real-time strategy assessment
- Post-trade analysis and optimization
- Educational understanding of the strategy logic
## Implementation Guide
### TradingView Setup
1. Load the script in TradingView Pine Editor
2. Apply to your preferred chart and timeframe
3. Adjust parameters based on your trading preferences
4. Enable alerts for webhook integration
### Webhook Integration
1. Configure webhook URL in TradingView alerts
2. Set up receiving endpoint on your trading platform
3. Define message format matching the bot's output
4. Test with small position sizes before full deployment
### Optimization Process
1. Backtest across different market conditions
2. Identify parameter sensitivity through multiple tests
3. Focus on risk management parameters first
4. Fine-tune entry/exit conditions based on performance metrics
5. Validate with out-of-sample testing
## Performance Considerations
### Strengths
- Adaptability to different market conditions through dual channels
- Multiple layers of confirmation reducing false signals
- Comprehensive risk management protecting capital
- Machine learning integration for predictive edge
### Limitations
- Complex parameter set requiring careful optimization
- Potential over-optimization risk with so many variables
- Computational intensity of MLMA calculations
- Dependency on proper webhook configuration for execution
### Best Practices
- Start with conservative risk settings (1-2% of equity)
- Test thoroughly in demo environment before live trading
- Monitor performance regularly and adjust parameters
- Consider market regime changes when evaluating results
## Conclusion
The ₿ober XM v2.0 represents a significant evolution in trading strategy design, combining traditional technical analysis with machine learning elements and multi-timeframe analysis. The core strength of this system lies in its adaptability and recognition of market asymmetry.
### Market Asymmetry and Adaptive Approach
The strategy acknowledges a fundamental truth about markets: bullish and bearish phases behave differently and should be treated as distinct environments. The dual-channel system with separate parameters for long and short positions directly addresses this asymmetry, allowing for optimized performance regardless of market direction.
### Targeted Backtesting Philosophy
It's counterproductive to run backtests over excessively long periods. Markets evolve continuously, and strategies that worked in previous market regimes may be ineffective in current conditions. Instead:
- Test specific market phases separately (bull markets, bear markets, range-bound periods)
- Regularly re-optimize parameters as market conditions change
- Focus on recent performance with higher weight than historical results
- Test across multiple timeframes to ensure robustness
### Multi-Timeframe Analysis as a Game-Changer
The integration of multi-timeframe analysis fundamentally transforms the strategy's effectiveness:
- **Increased Safety**: Higher timeframe confirmations reduce false signals and improve trade quality
- **Context Awareness**: Decisions made with awareness of larger trends reduce adverse entries
- **Adaptable Precision**: Apply strict filters on lower timeframes while maintaining awareness of broader conditions
- **Reduced Noise**: Higher timeframe data naturally filters market noise that can trigger poor entries
The ₿ober XM v2.0 provides traders with a framework that acknowledges market complexity while offering practical tools to navigate it. With proper setup, realistic expectations, and attention to changing market conditions, it delivers a sophisticated approach to systematic trading that can be continuously refined and optimized.

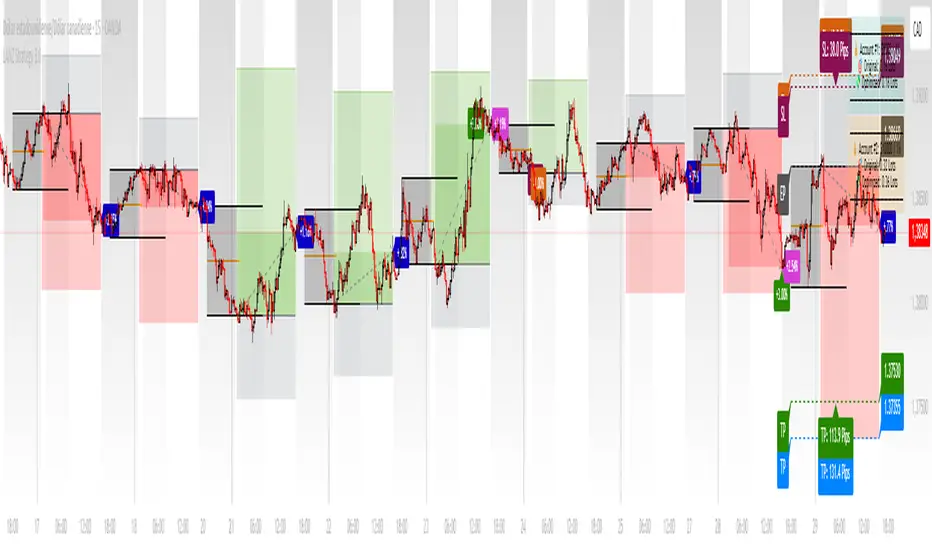
LANZ Strategy 3.0🔷 LANZ Strategy 3.0 — Asian Range Fibonacci Strategy with Execution Window Logic
LANZ Strategy 3.0 is a rule-based trading system that utilizes the Asian session range to project Fibonacci levels and manage entries during a defined execution window. Designed for Forex and index traders, this strategy focuses on structured price behavior around key levels before the New York session.
🧠 Core Components:
Asian Session Range Mapping: Automatically detects the high, low, and midpoint during the Asian session.
Fibonacci Level Projection: Projects configurable Fibonacci retracement and extension levels based on the Asian range.
Execution Window Logic: Uses the 01:15 NY candle as a reference to validate potential reversals or continuation setups.
Conditional Entry System: Includes logic for limit order entries (buy or sell) at specific Fib levels, with reversal logic if price breaks structure before execution.
Risk Management: Entry orders are paired with dynamic SL and TP based on Fibonacci-based distances, maintaining a risk-reward ratio consistent with intraday strategies.
📊 Visual Features:
Asian session high/low/mid lines.
Fibonacci levels: Original (based on raw range) and Optimized (user-adjustable).
Session background coloring for Asia, Execution Window, and NY session.
Labels and lines for entry, SL, and TP targets.
Dynamic deletion of untriggered orders after execution window expires.
⚙️ How It Works:
The script calculates the Asian session range.
Projects Fibonacci levels from the range.
Waits for the 01:15 NY candle to close to validate a signal.
If valid, a limit entry order (BUY or SELL) is plotted at the selected level.
If price structure changes (e.g., breaks the high/low), reversal logic may activate.
If no trade is triggered, orders are cleared before the NY session.
🔔 Alerts:
Alerts trigger when a valid setup appears after 01:15 NY candle.
Optional alerts for order activation, SL/TP hit, or trade cancellation.
📝 Notes:
Intended for semi-automated or discretionary trading.
Best used on highly liquid markets like Forex majors or indices.
Script parameters include session times, Fib ratios, SL/TP settings, and reversal logic toggle.
Credits:
Developed by LANZ, this script merges traditional session-based analysis with Fibonacci tools and structured execution timing, offering a unique framework for morning volatility plays.
Opening Range and Market BoundariesOpening Range and Market Boundaries
This versatile and insightful indicator combines two powerful concepts frequently used by professional traders: Opening Range Analysis and Market Boundaries derived from previous high/low levels. It is specifically designed to support intraday trading strategies and helps you identify key price zones for entries, exits, and breakout confirmations.
🔍 Features & Utility
1. Opening Range Box
What it does:
Highlights the high and low of the first candle after market open (9:15 AM IST) with a shaded box. This box spans the full trading session, from 9:15 AM to 3:30 PM, representing the key price range where the initial balance is formed.
Timeframe Compatibility:
The Opening Range box is optimized for 1-minute to 1-hour charts. It is most effective on lower timeframes (1m, 5m, 15m, 30m) where intraday price movements and breakout patterns can be clearly observed.
Usage Tips:
Breakouts above or below the Opening Range box can signal potential directional bias for the rest of the trading day.
Price consolidating within the range may indicate a choppy or range-bound session.
Works well with volume and momentum indicators for confirmation.
2. Market Boundaries
What it does:
Plots horizontal lines at:
Previous Day High/Low
Previous Week High/Low
Previous Month High/Low
Why it matters:
These levels act as natural support and resistance zones, and are commonly watched by institutional traders, making them crucial for:
Spotting reversals or breakouts
Planning stop-loss and target zones
Avoiding trades around high-rejection areas
Customization Options:
Toggle ON/OFF for Daily, Weekly, and Monthly levels.
Independent colors and line thickness for each level, enabling you to distinguish between different timeframes easily.
🛠️ How to Use Effectively
Use during market open:
Switch to a 5-minute or 15-minute chart during the first few candles of the session. Observe the Opening Range box formation and plan trades based on breakout direction.
Confluence Trading:
Look for price action near previous session highs/lows in confluence with the Opening Range box edges. These intersections often become high-probability zones for breakouts or reversals.
Session Preparation:
Before the market opens, analyze where the price is relative to past high/low boundaries. If it's near a weekly/monthly level, be cautious — those areas can cause whipsaws or false breakouts.
Avoid low-volume breakouts:
Use this indicator in conjunction with volume tools or price action confirmation to validate the strength of a move outside the Opening Range or Market Boundaries.
📌 Summary
This indicator is designed for intraday traders, scalpers, and swing traders who want a reliable structure to guide their decisions. It visually marks the opening balance of the market and essential higher timeframe boundaries, helping you trade with discipline and precision.

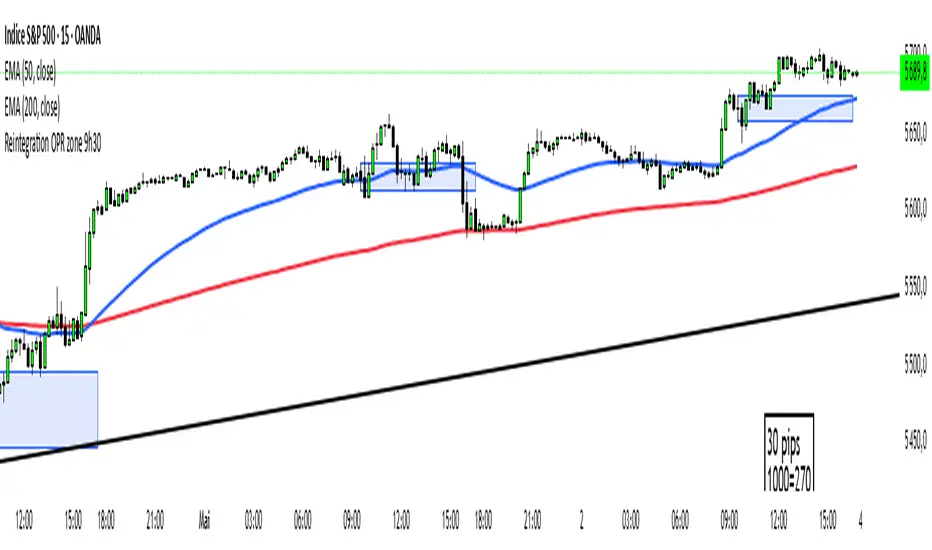
Reintegration OPR zone 9h30📝 Indicator Description (for TradingView):
Name: Reintegration OPR Zone – 9:30 AM EST (UTC-4)
Purpose:
This indicator is designed for US indices like NAS100, US30, or SPX500. It helps identify potential false breakouts or retests by tracking when the price re-enters the Opening Price Range (OPR) after an initial breakout.
🔍 How it works:
At 9:30 AM New York time (UTC-4), the script captures the high and low of the first 15-minute candle (which is key for the US session open).
It then draws a horizontal box (rectangle) from the high to the low of that candle.
The box extends horizontally for 7 hours (28 candles on a 15-minute chart).
The script tracks if price:
Breaks above or below the OPR zone
Then re-enters the zone (a potential "fakeout" or "retest" signal)
No label or text is displayed on the chart (you requested it to be hidden).
🕒 Timeframe:
Designed for the 15-minute chart (M15)
Assumes New York session open at 9:30 AM EST (UTC-4)
Adaptive Freedom Machine w/labelsAdaptive Freedom Machine w/ Labels
Overview
The Adaptive Freedom Machine w/ Labels is a versatile Pine Script indicator designed to assist traders in identifying buy and sell opportunities across various market conditions (trending, ranging, or volatile). It combines Exponential Moving Averages (EMAs), Relative Strength Index (RSI), Average True Range (ATR), and customizable time filters to generate actionable signals. The indicator overlays on the price chart, displaying EMAs, a dynamic cloud, scaled RSI levels, buy/sell signals, and market condition labels, making it suitable for swing trading, day trading, or scalping.
What It Does
This indicator generates buy and sell signals based on the interaction of two EMAs, filtered by RSI thresholds, ATR-based volatility, and user-defined time windows. It adapts to the selected market condition by adjusting EMA lengths, RSI thresholds, and trading hours. A dynamic cloud highlights trend direction or neutral zones, and candlestick bodies are colored in neutral conditions for clarity. A table displays real-time trend and volatility status.
How It Works
The indicator uses the following components:
EMAs: Two EMAs (short and long) are calculated on a user-selected timeframe (1, 5, 15, 30, or 60 minutes). Their crossover or crossunder generates potential buy/sell signals, with lengths adjusted based on the market condition (e.g., longer EMAs for trending markets, shorter for ranging).
Dynamic Cloud: The area between the EMAs forms a cloud, colored green for uptrends, red for downtrends, or a user-defined color (default yellow) for neutral zones (when EMAs are close, determined by an ATR-based threshold). Users can widen the cloud for visibility.
RSI Filter: RSI is scaled to price levels and plotted on the chart (optional). Signals are filtered to ensure RSI is within user-defined buy/sell thresholds and not in overbought/oversold zones, with thresholds tailored to the market condition.
ATR Volatility Filter: An optional filter ensures signals occur during sufficient volatility (ATR(14) > SMA(ATR, 20)).
Time Filter: Signals are restricted to a user-defined or market-specific time window (e.g., 10:00–15:00 UTC for volatile markets), with an option for custom hours.
Visual Aids: Buy/sell signals appear as green triangles (buy) or red triangles (sell). Candlesticks in neutral zones are colored (default yellow). A table in the top-right corner shows the current trend (Uptrend, Downtrend, Neutral) and volatility (High or Low).
The indicator ensures compatibility with standard chart types (e.g., candlestick charts) to produce realistic signals, avoiding non-standard types like Heikin Ashi or Renko.
How to Use It
Add to Chart: Apply the indicator to a candlestick or bar chart on TradingView.
Configure Settings:
Timeframe: Choose a timeframe (1, 5, 15, 30, or 60 minutes) to align with your trading style.
Market Condition: Select one market condition (Trending, Ranging, or Volatile). Volatile is the default if none is selected. Only one condition can be active.
Filters:
Enable/disable the ATR volatility filter to trade only in high-volatility periods.
Enable the time filter and choose default hours (specific to the market condition) or set custom UTC hours.
Cloud Settings: Adjust the cloud width, neutral zone threshold, and color. Enable/disable the neutral cloud.
RSI Display: Toggle the scaled RSI and its thresholds on the chart.
Interpret Signals:
Buy Signal: A green triangle below the bar indicates a potential long entry (EMA crossover, RSI above buy threshold, within time window, and passing volatility filter).
Sell Signal: A red triangle above the bar indicates a potential short entry (EMA crossunder, RSI below sell threshold, within time window, and passing volatility filter).
Neutral Zone: Yellow candlesticks and cloud (if enabled) suggest a lack of clear trend; avoid trading or use for range-bound strategies.
Monitor the Table: Check the top-right table for real-time trend (Uptrend, Downtrend, Neutral) and volatility (High or Low) to confirm market context.
Unique Features
Adaptive Parameters: Automatically adjusts EMA lengths, RSI thresholds, and trading hours based on the selected market condition, reducing manual tweaking.
Neutral Zone Detection: Uses an ATR-based threshold to identify low-trend periods, helping traders avoid choppy markets.
Scaled RSI Visualization: Plots RSI and thresholds directly on the price chart, making it easier to assess momentum relative to price action.
Flexible Time Filtering: Supports both default and custom UTC-based trading windows, ideal for day traders targeting specific sessions.
Dynamic Cloud: Enhances trend visualization with customizable width and neutral zone coloring, improving readability.
Notes
Use on standard candlestick or bar charts to ensure realistic signals.
Test the indicator on a demo account to understand its behavior in your chosen market and timeframe.
Adjust settings to match your trading strategy, but avoid over-optimizing for past data.
The indicator is not a standalone system; combine it with other analysis (e.g., support/resistance, news events) for better results.
Limitations
Signals may lag in fast-moving markets due to EMA-based calculations.
Neutral zone detection may vary in extremely volatile or illiquid markets.
Time filters are UTC-based; ensure your platform’s timezone settings align.
This indicator is designed for traders seeking a customizable, trend-following tool that adapts to different market environments while providing clear visual cues and robust filtering.

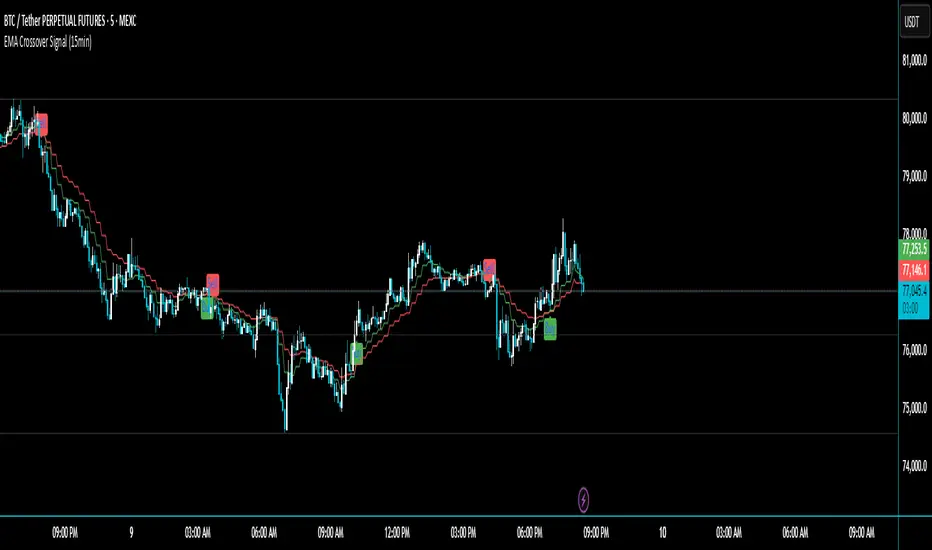
EMA Crossover Signal (15min)📈 EMA Crossover Signal (15min)
This indicator generates Buy and Sell signals based on a simple yet effective Exponential Moving Average (EMA) crossover strategy, strictly evaluated on the 15-minute timeframe.
✅ Strategy:
Buy Signal: Triggered when the 5 EMA crosses above the 10 EMA.
Sell Signal: Triggered when the 5 EMA crosses below the 10 EMA.
📌 Features:
Signals are evaluated using 15-minute data, regardless of your current chart timeframe.
Clear Buy/Sell labels are displayed directly on the chart.
Optional plotting of the 5 EMA and 10 EMA from the 15-minute chart for visual confirmation.
This tool is ideal for traders who want to follow short-term momentum shifts with high clarity and precision.
Dskyz Adaptive Futures Elite (DAFE)Dskyz Adaptive Futures Edge (DAFE)
imgur.com
A Dynamic Futures Trading Strategy
DAFE adapts to market volatility and price action using technical indicators and advanced risk management. It’s built for high-stakes futures trading (e.g., MNQ, BTCUSDT.P), offering modular logic for scalpers and swing traders alike.
Key Features
Adaptive Moving Averages
Dynamic Logic: Fast and slow SMAs adjust lengths via ATR, reacting to momentum shifts and smoothing in calm markets.
Signals: Long entry on fast SMA crossing above slow SMA with price confirmation; short on cross below.
RSI Filtering (Optional)
Momentum Check: Confirms entries with RSI crossovers (e.g., above oversold for longs). Toggle on/off with custom levels.
Fine-Tuning: Adjustable lookback and thresholds (e.g., 60/40) for precision.
Candlestick Pattern Recognition
Eng|Enhanced Detection: Identifies strong bullish/bearish engulfing patterns, validated by volume and range strength (vs. 10-period SMA).
Conflict Avoidance: Skips trades if both patterns appear in the lookback window, reducing whipsaws.
Multi-Timeframe Trend Filter
15-Minute Alignment: Syncs intrabar trades with 15-minute SMA trends; optional for flexibility.
Dollar-Cost Averaging (DCA) New!
Scaling: Adds up to a set number of entries (e.g., 4) on pullbacks/rallies, spaced by ATR multiples.
Control: Caps exposure and resets on exit, enhancing trend-following potential.
Trade Execution & Risk Management
Entry Rules: Prioritizes moving averages or patterns (user choice), with volume, volatility, and time filters.
Stops & Trails:
Initial Stop: ATR-based (2–3.5x, volatility-adjusted).
Trailing Stop: Locks profits with configurable ATR offset and multiplier.
Discipline
Cooldown: Pauses post-exit (e.g., 0–5 minutes).
Min Hold: Ensures trades last a set number of bars (e.g., 2–10).
Visualization & Tools
Charts: Overlays MAs, stops, and signals; trend shaded in background.
Dashboard: Shows position, P&L, win rate, and more in real-time.
Debugging: Logs signal details for optimization.
Input Parameters
Parameter Purpose Suggested Use
Use RSI Filter - Toggle RSI confirmation *Disable 4 price-only
trading
RSI Length - RSI period (e.g., 14) *7–14 for sensitivity
RSI Overbought/Oversold - Adjust for market type *Set levels (e.g., 60/40)
Use Candlestick Patterns - Enables engulfing signals *Disable for MA focus
Pattern Lookback - Pattern window (e.g., 19) *10–20 bars for balance
Use 15m Trend Filter - Align with 15-min trend *Enable for trend trades
Fast/Slow MA Length - Base MA lengths (e.g., 9/19) *10–25 / 30–60 per
timeframe
Volatility Threshold - Filters volatile spikes *Max ATR/close (e.g., 1%)
Min Volume - Entry volume threshold *Avoid illiquid periods
(e.g., 10)
ATR Length - ATR period (e.g., 14) *Standard volatility
measure
Trailing Stop ATR Offset - Trail distance (e.g., 0.5) *0.5–1.5 for tightness
Trailing Stop ATR Multi - Trail multiplier (e.g., 1.0) *1–3 for trend room
Cooldown Minutes - Post-exit pause (e.g., 0–5) *Prevents overtrading
Min Bars to Hold - Min trade duration (e.g., 2) *5–10 for intraday
Trading Hours - Active window (e.g., 9–16) *Focus on key sessions
Use DCA - Toggle DCA *Enable for scaling
Max DCA Entries - Cap entries (e.g., 4) *Limit risk exposure
DCA ATR Multiplier Entry spacing (e.g., 1.0) *1–2 for wider gaps
Compliance
Realistic Testing: Fixed quantities, capital, and slippage for accurate backtests.
Transparency: All logic is user-visible and adjustable.
Risk Controls: Cooldowns, stops, and hold periods ensure stability.
Flexibility: Adapts to various futures and timeframes.
Summary
DAFE excels in volatile futures markets with adaptive logic, DCA scaling, and robust risk tools. Currently in prop account testing, it’s a powerful framework for precision trading.
Caution
DAFE is experimental, not a profit guarantee. Futures trading risks significant losses due to leverage. Backtest, simulate, and monitor actively before live use. All trading decisions are your responsibility.

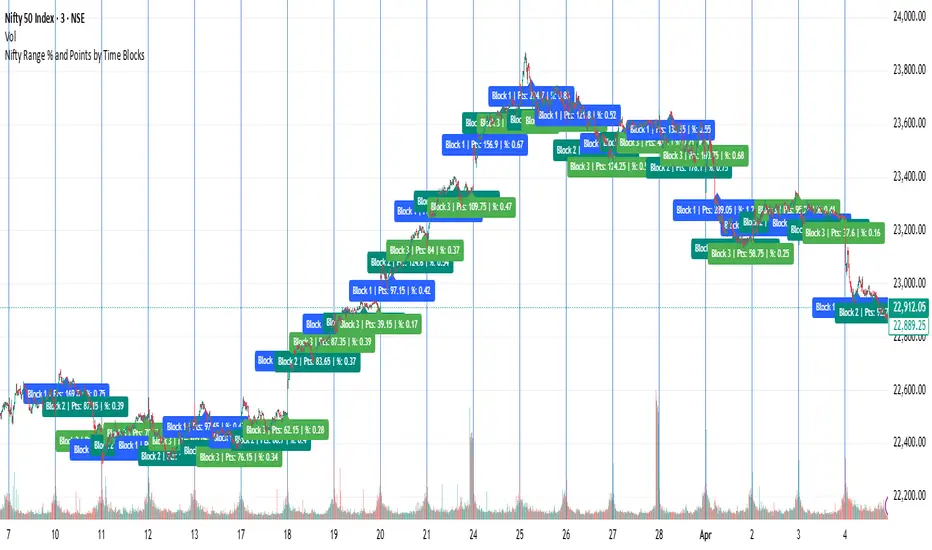
Nifty Range % and Points by Time BlocksPine Script that gives you day-wise intraday range percentage for these 3 time blocks (9:16–10:45, 10:45–1:15, 1:15–3:15), we can:
Detect time blocks during the day
Track High/Low for each block
Calculate range % for each block:
\text{Range %} = \frac{(High - Low)}{\text{Previous Day Close}} \times 100
Plot / Label it on the chart at the end of each block
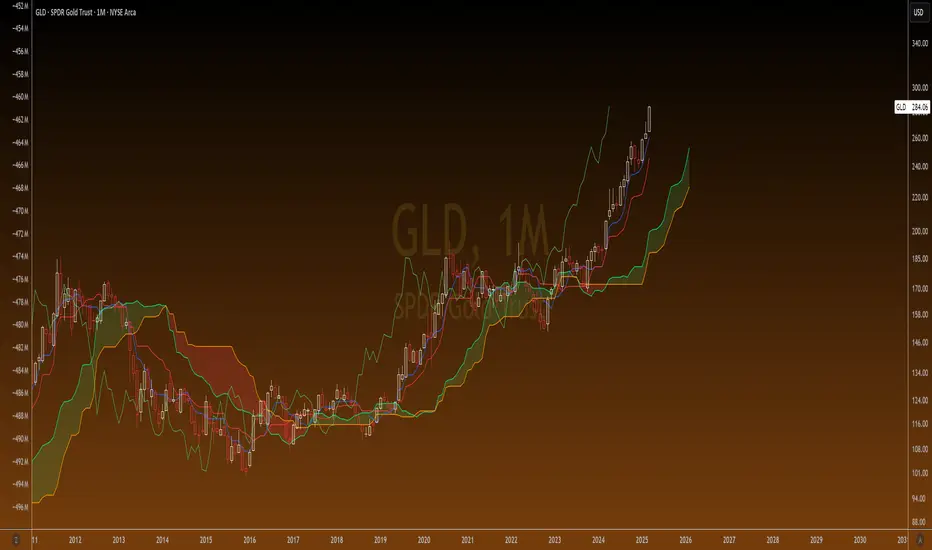
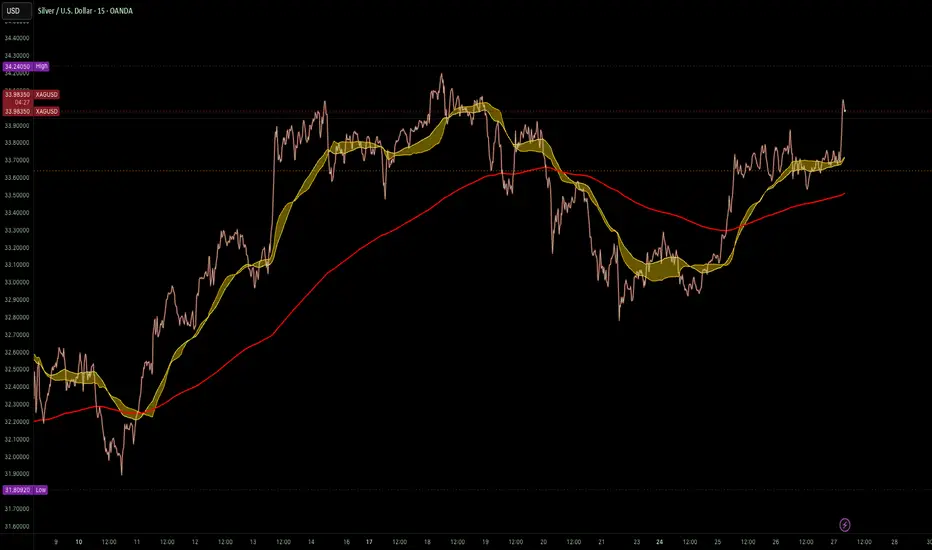
Ichimoku Cloud Auto TF🧠 Timeframe Breakdown for Ichimoku Cloud Auto TF
Each timeframe in this indicator is carefully calibrated to reflect meaningful Ichimoku behavior relative to its scale. Here's how each one is structured and what it's best used for:
⏱️ 1 Minute (1m)
Tenkan / Kijun / Span B: 5 / 15 / 45
Use: Scalping fast price action.
Logic: Quick reaction to short-term momentum. Best for highly active traders or bots.
⏱️ 2 Minutes (2m)
Tenkan / Kijun / Span B: 6 / 18 / 54
Use: Slightly smoother than 1m, still ideal for scalping with a little more stability.
⏱️ 5 Minutes (5m)
Tenkan / Kijun / Span B: 8 / 24 / 72
Use: Intraday setups, quick trend capture.
Logic: Balanced between reactivity and noise reduction.
⏱️ 15 Minutes (15m)
Tenkan / Kijun / Span B: 9 / 27 / 81
Use: Short-term swing and intraday entries with higher reliability.
⏱️ 30 Minutes (30m)
Tenkan / Kijun / Span B: 10 / 30 / 90
Use: Intra-swing entries or confirmation of 5m/15m signals.
🕐 1 Hour (1H)
Tenkan / Kijun / Span B: 12 / 36 / 108
Use: Ideal for swing trading setups.
Logic: Anchored to Daily reference (1H × 24 ≈ 1D).
🕐 2 Hours (2H)
Tenkan / Kijun / Span B: 14 / 42 / 126
Use: High-precision swing setups with better context.
🕒 3 Hours (3H)
Tenkan / Kijun / Span B: 15 / 45 / 135
Use: Great compromise between short and mid-term vision.
🕓 4 Hours (4H)
Tenkan / Kijun / Span B: 18 / 52 / 156
Use: Position traders & intraday swing confirmation.
Logic: Designed to echo the structure of 1D Ichimoku but on smaller scale.
📅 1 Day (1D)
Tenkan / Kijun / Span B: 9 / 26 / 52
Use: Classic Ichimoku settings.
Logic: Standard used globally for technical analysis. Suitable for swing and position trading.
📆 1 Week (1W)
Tenkan / Kijun / Span B: 12 / 24 / 120
Use: Long-term position trading & institutional swing confirmation.
Logic: Expanded ratios for broader perspective and noise filtering.
🗓️ 1 Month (1M)
Tenkan / Kijun / Span B: 6 / 12 / 24
Use: Macro-level trend visualization and investment planning.
Logic: Condensed but stable structure to handle longer data cycles.
📌 Summary
This indicator adapts Ichimoku settings dynamically to your chart's timeframe, maintaining logical ratios between Tenkan, Kijun, and Span B. This ensures each timeframe remains responsive yet meaningful for its respective market context.
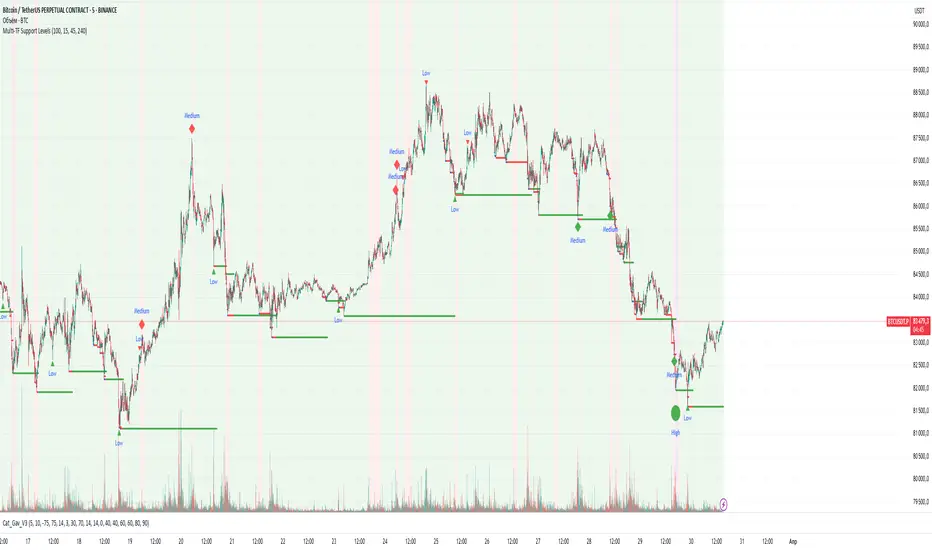
Multi-TF Support LevelsThe Multi-TF Support Levels indicator identifies and displays key support levels based on swing lows across three user-selected timeframes.
How it works:
Input Parameters:
Lookback Period (100) — historical depth to search for swing lows.
Timeframe 1-3 (15, 45, 240) — three timeframes (e.g., 15min, 45min, 4hr).
Logic:
For each timeframe, a swing low is detected: the lowest price within the lookback period that is also lower than the two preceding candles.
Support levels update dynamically when new swing lows are formed.
The most recent levels are plotted as horizontal cross marks (blue, red, green for each timeframe).
Purpose: Visualize significant support zones from multiple timeframes to identify confluent areas for trading decisions.
Индикатор Multi-TF Support Levels (Мультитаймфреймовые уровни поддержки) определяет и отображает ключевые уровни поддержки на основе минимумов свингов (swing lows) на трёх выбранных таймфреймах.
Как работает:
Входные параметры:
Lookback Period (100) — глубина анализа для поиска минимумов.
Timeframe 1-3 (15, 45, 240) — три таймфрейма (например, 15 минут, 45 минут, 4 часа).
Логика:
Для каждого таймфрейма определяется свинг-минимум: цена, которая является самой низкой за период lookback и ниже двух предыдущих свечей.
Уровни поддержки обновляются при появлении новых свинг-минимумов.
Последние актуальные уровни отображаются на графике в виде горизонтальных линий-крестиков (синий, красный, зелёный для каждого таймфрейма).
Цель: Визуализировать значимые уровни поддержки с разных таймфреймов для поиска зон "конфлюэнса".
Granular MA Ribbon🎗️ The Granular MA Ribbon provides a structured view of price action on lower timeframes by incorporating both price-based and volume-weighted moving averages, offering a more nuanced view of market trends and momentum shifts. Furthermore, by using 15-minute intervals for its calculations, it ensures that intraday traders receive a smooth and responsive representation of higher timeframe trends.
⚠️ Note that this indicator is specifically optimized for the 15-minute and 1-hour charts; applying it to longer or shorter periods will distort its calculations and reduce its effectiveness. Adjust visibility settings accordingly.
🧰 Unlike traditional moving averages that may lag or fail to reflect real-time shifts in price dynamics, the Granular MA Ribbon includes a one-day exponential moving average (1D EMA), a one-day volume-weighted moving average (1D VWMA), and a one-week exponential moving average (1W EMA). Together, these elements allow traders to stay aligned with the broader market while making precise intraday trading decisions.
🤷🏻 Why Two Daily Moving Averages?
🔊 Instead of relying on a single moving average, this indicator uses both an EMA and a VWMA to provide a clearer picture of price movement. The EMA reacts quickly to price changes, making it a useful tool for identifying short-term momentum shifts. The VWMA, meanwhile, accounts for volume, ensuring that price movements supported by higher trading activity carry greater weight in the trend calculation.
💪🏻 When the EMA and VWMA diverge significantly, it signals strong momentum. If they begin to converge, it suggests that momentum is weakening or that price may be entering consolidation. The space between these two moving averages is filled with a ribbon, making it easier to see shifts in trend strength. A wide ribbon typically indicates strong momentum, while a narrowing ribbon suggests the trend may be losing steam.
🧮 Calculation Rationale
🔎 The 1D EMA and 1D VWMA are constructed using 15-minute blocks to maintain accuracy on lower timeframes. A full trading day consists of 96 fifteen-minute intervals. Instead of relying on daily candle data, which would reduce the granularity of the moving averages, this method allows the indicator to reflect intra-day trends more accurately. By breaking the day into smaller increments, the moving averages adapt more smoothly to changes in price and volume, making them more reliable for traders working on shorter timeframes.
🔍 The weekly EMA follows the same logic, adjusting based on the selected five-day or seven-day setting. If the market follows a standard five-day trading week, the one-week EMA is calculated using 480 fifteen-minute bars. If the market trades seven days a week, such as in crypto, the weekly EMA is adjusted accordingly to reflect 672 fifteen-minute bars. This setting ensures that traders using the indicator across different asset classes receive accurate trend information.
🫤 Sideways Markets
🔄 When the broader market is in a range-bound state, with no clear trend on the one-day or one-week chart, this indicator helps traders make sense of the short-term price structure. In these conditions, the ribbon will often appear flat, with the 1D EMA and 1D VWMA frequently crossing each other. This suggests that momentum is weak and that price action lacks a strong directional bias.
⚠️ A narrowing ribbon in a sideways market indicates reduced volatility and a potential breakout. If the EMA crosses above the VWMA during consolidation, it may signal a short-term upward move, especially if volume begins to increase. Conversely, if the EMA moves below the VWMA, it could indicate that selling pressure is increasing. However, in choppy conditions, crossovers alone are not enough to confirm a trade. Traders should wait for additional confirmation, such as a breakout from a defined range or a shift in volume.
♭ If the weekly EMA remains flat while the daily ribbon fluctuates, it confirms that the market lacks a strong trend. In such cases, traders may consider fading moves near the top and bottom of a range rather than expecting sustained breakouts.
💹 Trending Markets
🏗️ When the market is in a strong uptrend or downtrend, the ribbon takes on a more structured shape. A widening ribbon that slopes upward signals strong bullish momentum, with price consistently respecting the 1D EMA and VWMA as support. In a downtrend, the ribbon slopes downward, acting as dynamic resistance.
📈 In trending conditions, traders can use the ribbon to time pullback entries. In an uptrend, price often retraces to the VWMA before resuming its upward move. If price holds above both the EMA and VWMA, the trend remains strong. If price begins to close below the VWMA but remains above the EMA, it suggests weakening momentum but not necessarily a reversal. A clean break below both moving averages indicates a shift in trend structure.
📊 The one-week EMA serves as a higher timeframe guide. When price remains above the weekly EMA, it confirms that the broader trend is intact. If price pulls back to the weekly EMA and bounces, it can provide a high-confidence trade entry. Conversely, if price breaks below the weekly EMA and fails to reclaim it, it suggests that the trend may be reversing.
⏳ 5-Day and 7-Day Week Variants
🎚️ The setting for a five-day or seven-day trading week adjusts the calculation of the one-week EMA. This ensures that the indicator remains accurate across different asset classes.
5️⃣ A five-day trading week is appropriate for stocks, futures, and forex markets, where trading pauses on weekends. Using a seven-day week for these markets would create artificial distortions by including non-trading days. 7️⃣ In contrast, the seven-day week setting is ideal for crypto markets, which trade continuously. Without this adjustment, the weekly EMA would fail to reflect weekend price action, leading to misleading trend signals.
🧐 This indicator is expressly designed to complement its higher timeframe counterpart, the Triple Differential Moving Average Braid, optimized for the 1-Day chart.
CVD Oscillator - Short Term SwiftEdgeOverview
The CVD Oscillator - Short Term is a technical indicator designed to assist traders in identifying short-term buying and selling pressure in the market. It calculates the Cumulative Volume Delta (CVD) to measure the net volume difference between buying and selling activity, displayed as an oscillator in a separate panel. This indicator is tailored for short-term trading strategies, such as scalping or day trading, on low timeframes (e.g., 1-minute, 5-minute, or 15-minute charts).
How It Works
Cumulative Volume Delta (CVD): The indicator calculates CVD by assigning volume to buyers (when close > open) or sellers (when close < open). If close = open, the volume is neutral.
Short-Term Focus: The CVD is calculated over a user-defined lookback period (default: 10 candles), making it sensitive to recent market activity.
Normalization: The raw CVD is normalized by dividing it by the average volume (over a short period, default: 5 candles) and scaled to fit within a range of -100 to +100, creating an oscillator-like behavior.
Reset Options: Users can reset the CVD at specific intervals (e.g., every minute, 5 minutes, 15 minutes, or daily) to focus on intraday movements.
Live CVD Value: The raw (unnormalized) CVD value is displayed as a label on each candle for real-time monitoring.
Key Features
Customizable Lookback Period: Adjust the number of recent candles (default: 10) to calculate CVD, allowing for precise short-term analysis.
Flexible Reset Periods: Choose to reset the CVD every 1 minute, 5 minutes, 15 minutes, daily, or never, to suit your trading style.
Normalized Oscillator: The CVD is scaled between -100 and +100, making it easier to visualize short-term momentum.
Live CVD Labels: Displays the raw CVD value on each candle, with options to position the label above or below the oscillator line.
How to Use
Add to Chart: Apply the indicator to your chart on a low timeframe (e.g., 1m, 5m, or 15m) for short-term trading.
Interpret the Oscillator:
Above 0 (Green): Indicates buying pressure dominates.
Below 0 (Red): Indicates selling pressure dominates.
Near 0: Suggests neutral market conditions.
Monitor Live CVD: Use the raw CVD value (shown in the label) to assess the exact net volume difference over the lookback period.
Combine with Other Tools: Use the oscillator alongside price action, support/resistance levels, or other indicators to confirm trading decisions.
Adjust Settings:
CVD Lookback Period: Set to a small value (e.g., 5-20 candles) for scalping.
CVD Reset Period: Choose "1m" or "5m" for intraday resets to focus on very short-term trends.
Volume Average Length: Use a short length (e.g., 3-5) for faster responsiveness.
Scale Factor: Increase (e.g., 2.0-3.0) to amplify small changes in CVD.
Settings
CVD Reset Period: Defines when to reset the CVD calculation ("None", "D" for daily, "15m", "5m", "1m").
CVD Lookback Period (Candles): Number of recent candles to calculate CVD (default: 10).
Volume Average Length: Period for averaging volume to normalize CVD (default: 5).
CVD Scale Factor: Adjusts the sensitivity of the normalized CVD (default: 2.0).
CVD Label Position: Choose to display the raw CVD label above or below the oscillator line.
CVD Label Color: Customize the color of the CVD label (default: white).
Limitations
Not a Standalone Tool: This indicator should be used in conjunction with other technical analysis tools, as it does not guarantee profitable trades.
Volume Dependency: The accuracy of CVD relies on the quality of volume data provided by your broker or exchange.
Short-Term Focus: The indicator is optimized for low timeframes and may produce noise on higher timeframes unless adjusted.
No Predictive Claims: The CVD Oscillator reflects past and current market activity but does not predict future price movements.
Notes
This indicator is designed for informational purposes and does not constitute financial advice. Trading involves risk, and past performance is not indicative of future results.
Test the indicator on a demo account to understand its behavior before using it in live trading.
Feedback is welcome! If you have suggestions for improvements, feel free to share them in the comments.

Advanced Session Profile Predictor with SR Boxes & ORAdvanced Session Profile Predictor with Momentum Arrows
Designed for intraday traders, this indicator analyzes price action across Asia, London, and New York sessions to predict market profiles and highlight key trading opportunities. By combining session-based profiling, Opening Range (OR) visualization, and momentum signals from Traders Dynamic Index (TDI), it offers a unique tool for anticipating trends, reversals, and breakouts. Ideal for forex, indices, and crypto on 15M–1H charts.
What Makes This Indicator Unique?
Unlike typical session indicators that only mark time zones or standard TDI scripts that focus on momentum, this tool:
Predicts market profiles (e.g., "Trend Continuation," "NY Manipulation") by analyzing session ranges and directional moves, offering actionable insights into how sessions interact.
Visualizes Opening Range (OR) boxes for the first 15 minutes of each session, helping traders spot early breakout levels.
Integrates TDI with momentum to generate precise bullish/bearish arrows, filtered by session context for improved reliability.
Simplifies decision-making with dynamic profile labels showing real-time long/short conditions based on price levels.
How Does It Work?
Session Tracking:
Asia (00:00–08:00 UTC, yellow), London (08:00–16:00 UTC, red), and New York (13:00–21:00 UTC, blue) sessions are highlighted with background colors and high/low lines (crosses).
OR boxes (first 15 minutes) are drawn for each session: yellow for Asia, red for London, blue for NY.
Profile Prediction:
Compares Asia and London session ranges and directions (e.g., trending if range > 1.5x 5-period SMA).
Examples:
Trend Continuation: Asia and London trend in the same direction—long above Asia high (uptrend) or short below Asia low (downtrend).
NY Manipulation: Asia trends, London consolidates—watch for NY breakouts at London high/low.
Displays the predicted profile and entry conditions in labels (e.g., "IF price hits 1.2000 LONG").
Momentum Arrows:
Uses TDI (RSI period 21, bands 34, fast MA 2) and 12-period momentum.
Green up arrow: Fast MA > upper band (>68) and momentum rising (bullish).
Red down arrow: Fast MA < lower band (<32) and momentum falling (bearish).
Support/Resistance (SR):
Plots dynamic SR boxes based on pivot highs/lows, filtered by volume (inspired by ChartPrime’s methodology, credited below).
How to Use It
Setup: Apply to a 15M–1H chart. Adjust time zone (default: UTC) and session times if needed. Customize TDI/momentum settings for sensitivity.
Trading:
Check the top-right labels for the current profile and entry conditions (e.g., "IF price hits LONG/SHORT").
Confirm entries with green up arrows (bullish) or red down arrows (bearish).
Use OR boxes and session high/low lines to identify breakout or reversal levels.
Example: In "NY Manipulation," wait for price to hit London high (long) or low (short) during NY session, confirmed by an arrow.
Best Markets: Forex (EUR/USD), indices (SPX500), crypto (BTC/USD) with sufficient intraday volatility.
Underlying Concepts
Session Profiling: Detects trends (range > SMA * threshold) and manipulation (e.g., London breaking Asia’s high/low) to predict NY behavior.
OR Boxes: Marks the first 15 minutes’ high/low as a breakout zone (time-based, 900,000 ms).
TDI + Momentum: Combines RSI-based bands with price change (close – close ) for momentum signals.
SR Boxes: Identifies pivots over a lookback period (default 20), scaled by ATR and filtered by volume thresholds.
Credits
The SR box logic is inspired by ChartPrime’s volume-filtered support/resistance methodology, adapted with custom breakout/hold detection. Original authors are credited for their foundational work.
Chart Setup
Displays session backgrounds, OR boxes, high/low lines, TDI arrows, and profile labels. Keep other indicators off for clarity.

Bollinger Bands MTF & Kalman Filter | Flux Charts📈 Multi-Timeframe Kalman Filtered Bollinger Bands Indicator
Introducing our MTF Kalman Filtered Bollinger Bands – a powerful multi-timeframe Bollinger Bands (BB) indicator enhanced with Kalman filtering for superior smoothing and trend analysis. This indicator dynamically adapts Bollinger Bands across multiple timeframes while incorporating volume-based gradient transparency to highlight significant price movements. This indicator is better optimized for lower timeframes.
❓ How to Interpret the Bands & Volume Gradient:
Our indicator combines Lower Timeframe (LTF) and Higher Timeframe (HTF) Bollinger Bands to provide a comprehensive trend analysis. It applies Kalman filtering to the LTF bands, ensuring smoother, noise-reduced signals. The color gradient and relative volume-based transparency offer deeper insights into price strength.
🔹 LTF Bollinger Bands: Shorter-period bands filtered with a Kalman smoothing algorithm, reducing lag and noise.
🔹 HTF Bollinger Bands: Traditional Bollinger Bands plotted on a higher timeframe, offering macro trend analysis.
🔹 Volume Gradient Transparency: The bands adjust their opacity based on relative buy/sell volume, allowing traders to assess momentum strength.
📌 How Does It Work?
1️⃣ Multi-Timeframe Bollinger Bands Calculation
The LTF BB uses Kalman filtering for a smoother price representation, helping to reduce false signals.
The HTF BB is EMA-smoothed for improved trend clarity.
2️⃣ Adaptive Gradient Transparency
The opacity of the fill color between the bands is determined by relative buy/sell volume.
Higher buy volume = stronger bullish signal (greener bands).
Higher sell volume = stronger bearish signal (redder bands).
3️⃣ Dynamic Trend Signals & Breakouts
Buy Signal: When price breaks below the HTF lower band and LTF bands start rising.
Sell Signal: When price breaks above the HTF upper band and LTF bands start falling.
⚙️ Settings & Customization:
🛠 LTF and HTF Bollinger Bands Settings:
Multiplier: The multiplier applied to the BB to determine the upper and lower bands
Length: Define the number of bars determines the BB calculations.
Custom Timeframe Selection: Choose from predefined options (e.g., 5m, 15m, 1H, 4H, etc).
🎨 Gradient & Transparency Settings:
Bullish/Bearish Color Options: Customize colors for uptrend and downtrend conditions.
Max & Min Opacity: Adjust the transparency levels based on volume intensity.
Solid vs. Gradient Mode: Choose between a gradient fill or a solid color mode for clarity.
📌 Recommended Settings for Optimal Use:
1️⃣ Timeframe Selection (LTF -> HTF):
1 min -> 5 min
2 min -> 5 min
3 min -> 15 min
5 min -> 15 min
15 min -> 1 hr
1 hr -> 4 hr
4 hr -> 1 day
2️⃣ Multiplier: Use 2.0 for LTF and 2.25 for HTF
3️⃣Length: Use a length of 20 - 30 bars
🚀 Why Use This Indicator?
✅ Multi-Timeframe Bollinger Bands with Kalman Filtering – Ideal for traders looking for reduced lag and clearer trend signals.
✅ Volume-Based Transparency – See momentum shifts instantly with adaptive opacity.
✅ Dynamic Buy & Sell Signals – Alerts based on price action + volume trends.
✅ Customizable for Any Strategy – Adjust colors, timeframes, and filtering options for personalized trading.

Trendchange Zones Indicator | iSolani
Spotting Reversals Before They Happen: The iSolani Trendshift System
Where RSI Meets Smart Volume Analysis - Your Visual Guide to Market Turns
Core Methodology
RSI-Powered Zones
Identifies critical levels using:
14-period RSI (default) with 70/30 thresholds
Semi-transparent boxes marking overbought (red) and oversold (green) territories
Zone persistence until RSI returns to neutral range
Dynamic Level Tracking
Plots evolving support/resistance using:
Pivot highs/lows with 15-bar lookback (default)
Auto-extending lines that adapt to new price extremes
Volume-Confirmed Breakouts
Flags significant moves with:
5/10 EMA volume oscillator
20% volume threshold (default) for confirmation
Technical Innovation
Three-Layer Confirmation
Unique combination of:
Classic RSI extremes
Price structure through pivot points
Volume-fueled momentum shifts
Adaptive Visualization
Zones maintain historical context at 33% transparency
Dynamic lines extend indefinitely until invalidated
Discreet labels for breakout events
System Workflow
Calculates RSI values in real-time
Draws colored zones when RSI crosses 70/30
Marks pivot points every 15 bars (default)
Updates support/resistance lines on new pivots
Triggers alerts when price breaks levels with volume confirmation
Standard Configuration
RSI Settings : 14-period length
Pivot Detection : 15-bar left/right lookback
Visuals : 33% transparency zones with thin borders
Volume Threshold : 20% oscillator difference
Alerts : Breakout signals with "B" labels
This system transforms the classic RSI into a spatial analysis tool - not just showing when markets are overextended, but where they're likely to reverse. The dynamic lines act as moving barriers that adapt to market structure, while the volume filter ensures only high-conviction breaks get flagged. By layering momentum, price action, and volume dynamics, it creates a multi-spectrum view of potential trend changes.

6-Hour Forecast (15m Steps) with Arrowed Lines & 95% CI -BesharaExplanation
Timeframe Conversion:
The helper function converts the chart’s timeframe (e.g., "15", "1H", etc.) into minutes so that the script can determine how many bars correspond to a 15‑minute interval.
Regression & Forecasting:
The script calculates a linear regression over the specified number of bars, approximates the slope, and computes the standard deviation of the residuals for error estimation. Then, for each forecast step (every 15 minutes for 6 hours), it extrapolates the forecast, calculates the 95% confidence interval, and draws red line segments connecting forecast points.
Visualization:
Arrows: At each forecast point, an arrow (▲ for upward, ▼ for downward, or → for unchanged) is drawn to indicate direction.
Confidence Intervals: Dotted orange lines display the 95% confidence interval at each forecast point.
Final Label: A label at the final forecast point shows the predicted price and its confidence interval.
Historical Regression: The blue line represents the historical regression line.
This script is provided for educational purposes only and does not guarantee predictive accuracy. Always use multiple tools and proper risk management in trading.

Boilerplate Configurable Strategy [Yosiet]This is a Boilerplate Code!
Hello! First of all, let me introduce myself a little bit. I don't come from the world of finance, but from the world of information and communication technologies (ICT) where we specialize in data processing with the aim of automating it and eliminating all human factors and actors in the processes. You could say that I am an algotrader.
That said, in my journey through trading in recent years I have understood that this world is often shown to be incomplete. All those who want to learn about trading only end up learning a small part of what it really entails, they only seek to learn how to read candlesticks. Therefore, I want to share with the entire community a fraction of what I have really understood it to be.
As a computer scientist, the most important thing is the data, it is the raw material of our work and without data you simply cannot do anything. Entropy is simple: Data in -> Data is transformed -> Data out.
The quality of the outgoing data will directly depend on the incoming data, there is no greater mystery or magic in the process. In trading it is no different, because at the end of the day it is nothing more than data. As we often say, if garbage comes in, garbage comes out.
Most people focus on the results only, on the outgoing data, because in the end we all want the same thing, to make easy money. Very few pay attention to the input data, much less to the process.
Now, I am not here to delude you, because there is no bigger lie than easy money, but I am here to give you a boilerplate code that will help you create strategies where you only have to concentrate on the quality of the incoming data.
To the Point
The code is a strategy boilerplate that applies the technique that you decide to customize for the criteria for opening a position. It already has the other factors involved in trading programmed and automated.
1. The Entry
This section of the boilerplate is the one that each individual must customize according to their needs and knowledge. The code is offered with two simple, well-known strategies to exemplify how the code can be reused for your own benefits.
For the purposes of this post on tradingview, I am going to use the simplest of the known strategies in trading for entries: SMA Crossing
// SMA Cross Settings
maFast = ta.sma(close, length)
maSlow = ta.sma(open, length)
The Strategy Properties for all cases published here:
For Stock TSLA H1 From 01/01/2025 To 02/15/2025
For Crypto XMR-USDT 30m From 01/01/2025 To 02/15/2025
For Forex EUR-USD 5m From 01/01/2025 To 02/15/2025
But the goal of this post is not to sell you a dream, else to show you that the same Entry decision works very well for some and does not for others and with this boilerplate code you only have to think of entries, not exits.
2. Schedules, Days, Sessions
As you know, there are an infinite number of markets that are susceptible to the sessions of each country and the news that they announce during those sessions, so the code already offers parameters so that you can condition the days and hours of operation, filter the best time parameters for a specific market and time frame.
3. Data Filtering
The data offered in trading are numerical series presented in vectors on a time axis where an endless number of mathematical equations can be applied to process them, with matrix calculation and non-linear regressions being the best, in my humble opinion.
4. Read Fundamental Macroeconomic Events, News
The boilerplate has integration with the tradingview SDK to detect when news will occur and offers parameters so that you can enable an exclusion time margin to not operate anything during that time window.
5. Direction and Sense
In my experience I have found the peculiarity that the same algorithm works very well for a market in a time frame, but for the same market in another time frame it is only a waste of time and money. So now you can easily decide if you only want to open LONG, SHORT or both side positions and know how effective your strategy really is.
6. Reading the money, THE PURPOSE OF EVERYTHING
The most important section in trading and the reason why many clients usually hire me as a financial programmer, is reading and controlling the money, because in the end everyone wants to win and no one wants to lose. Now they can easily parameterize how the money should flow and this is the genius of this boilerplate, because it is what will really decide if an algorithm (Indicator: A bunch of math equations) for entries will really leave you good money over time.
7. Managing the Risk, The Ego Destroyer
Many trades, little money. Most traders focus on making money and none of them know about statistics and the few who do know something about it, only focus on the winrate. Well, with this code you can unlock what really matters, the true success criteria to be able to live off of trading: Profit Factor, Sortino Ratio, Sharpe Ratio and most importantly, will you really make money?
8. Managing Emotions
Finally, the main reason why many lose money is because they are very bad at managing their emotions, because with this they will no longer need to do so because the boilerplate has already programmed criteria to chase the price in a position, cut losses and maximize profits.
In short, this is a boilerplate code that already has the data processing and data output ready, you only have to worry about the data input.
“And so the trader learned: the greatest edge was not in predicting the storm, but in building a boat that could not sink.”
DISCLAIMER
This post is intended for programmers and quantitative traders who already have a certain level of knowledge and experience. It is not intended to be financial advice or to sell you any money-making script, if you use it, you do so at your own risk.

Crypto Scanner v4This guide explains a version 6 Pine Script that scans a user-provided list of cryptocurrency tokens to identify high probability tradable opportunities using several technical indicators. The script combines trend, momentum, and volume-based analyses to generate potential buying or selling signals, and it displays the results in a neatly formatted table with alerts for trading setups. Below is a detailed walkthrough of the script’s design, how traders can interpret its outputs, and recommendations for optimizing indicator inputs across different timeframes.
## Overview and Key Components
The script is designed to help traders assess multiple tokens by calculating several indicators for each one. The key components include:
- **Input Settings:**
- A comma-separated list of symbols to scan.
- Adjustable parameters for technical indicators such as ADX, RSI, MFI, and a custom Wave Trend indicator.
- Options to enable alerts and set update frequencies.
- **Indicator Calculations:**
- **ADX (Average Directional Index):** Measures trend strength. A value above the provided threshold indicates a strong trend, which is essential for validating momentum before entering a trade.
- **RSI (Relative Strength Index):** Helps determine overbought or oversold conditions. When the RSI is below the oversold level, it may present a buying opportunity, while an overbought condition (not explicitly part of this setup) could suggest selling.
- **MFI (Money Flow Index):** Similar in concept to RSI but incorporates volume, thus assessing buying and selling pressure. Values below the designated oversold threshold indicate potential undervaluation.
- **Wave Trend:** A custom indicator that calculates two components (WT1 and WT2); a crossover where WT1 moves from below to above WT2 (particularly near oversold levels) may signal a reversal and a potential entry point.
- **Scanning and Trading Zone:**
- The script identifies a *bullish setup* when the following conditions are met for a token:
- ADX exceeds the threshold (strong trend).
- Both RSI and MFI are below their oversold levels (indicating potential buying opportunities).
- A Wave Trend crossover confirms near-term reversal dynamics.
- A *trading zone* condition is also defined by specific ranges for ADX, RSI, MFI, and a limited difference between WT1 and WT2. This zone suggests that the token might be in a consolidation phase where even small moves may be significant.
- **Alerts and Table Reporting:**
- A table is generated, with each row corresponding to a token. The table contains columns for the symbol, ADX, RSI, MFI, WT1, WT2, and the trading zone status.
- Visual cues—such as different background colors—highlight tokens with a bullish setup or that are within the trading zone.
- Alerts are issued based on the detection of a bullish setup or entry into a trading zone. These alerts are limited per bar to avoid flooding the trader with notifications.
## How to Interpret the Indicator Outputs
Traders should use the indicator values as guidance, verifying them against their own analysis before making any trading decision. Here’s how to assess each output:
- **ADX:**
- **High values (above threshold):** Indicate strong trends. If other indicators confirm an oversold condition, a trader may consider a long position for a corrective reversal.
- **Low values:** Suggest that the market is not trending strongly, and caution should be taken when considering entry.
- **RSI and MFI:**
- **Below oversold levels:** These conditions are traditionally seen as signals that an asset is undervalued, potentially triggering a bounce.
- **Above typical resistance levels (not explicitly used here):** Would normally caution a trader against entering a long position.
- **Wave Trend (WT1 and WT2):**
- A crossover where WT1 moves upward above WT2 in an oversold environment can signal the beginning of a recovery or reversal, thereby reinforcing buy signals.
- **Trading Zone:**
- Being “in zone” means that the asset’s current values for ADX, RSI, MFI, and the closeness of the Wave Trend lines indicate a period of consolidation. This scenario might be suitable for both short-term scalping or as an early exit indicator, depending on further market analysis.
## Timeframe Optimization Input Table
Traders can optimize indicator inputs depending on the timeframe they use. The following table provides a set of recommended input values for various timeframes. These values are suggestions and should be adjusted based on market conditions and individual trading styles.
Timeframe ADX RSI MFI ADX RSI MFI WT Channel WT Average
5-min 10 10 10 20 30 20 7 15
15-min 12 12 12 22 30 20 9 18
1-hour 14 14 14 25 30 20 10 21
4-hour 16 16 16 27 30 20 12 24
1-day 18 18 18 30 30 20 14 28
Adjust these parameters directly in the script’s input settings to match the selected timeframe. For shorter timeframes (e.g., 5-min or 15-min), the shorter lengths help filter high-frequency noise. For longer timeframes (e.g., 1-day), longer input values may reduce false signals and capture more significant trends.
## Best Practices and Usage Tips
- **Token Limit:**
- Limit the number of tokens scanned to 10 per query line. If you need to scan more tokens, initiate a new query line. This helps manage screen real estate and ensures the table remains legible.
- **Confirming Signals:**
- Use this script as a starting point for identifying high potential trades. Each indicator’s output should be used to confirm your trading decision. Always cross-reference with additional technical analysis tools or market context.
- **Regular Review:**
- Since the script updates the table every few bars (as defined by the update frequency), review the table and alerts regularly. Market conditions change rapidly, so timely decisions are crucial.
## Conclusion
This Pine Script provides a comprehensive approach for scanning multiple cryptocurrencies using a combination of trend strength (ADX), momentum (RSI and MFI), and reversal signals (Wave Trend). By using the provided recommendation table for different timeframes and limiting the tokens to 20 per query line (with a maximum of four query lines), traders can streamline their scanning process and more effectively identify high probability tradable tokens. Ultimately, the outputs should be critically evaluated and combined with additional market research before executing any trades.

Adaptive Supply and Demand [EdgeTerminal]Adaptive Supply and Demand is a dynamic supply and demand indicator with a few unique twists. It considers volume pressure, volatility-based adjustments and multi-time frame momentum for confidence scoring (multi-step confirmation) to generate dynamic lines that adjust based on the market and also to generate dynamic support/resistance levels for the supply and demand lines.
The dynamic support and resistance lines shown gives you a better situational awareness of the current state of the market and add more context to why the market is moving into a certain direction.
> Trading Scenarios
When the confidence score is over 80%, strong volume pressure in trend direction (up or down), volatility is low and momentum is aligned across timeframes, there is an indication of a strong upward or downward trend.
When the supply and demand line crossover, the confidence score is over 75% and the volume pressure is shifting, this can be an indicator of trend reversal. Use tight initial stops, scale into position as trend develops, monitor the volume pressure for continuation and wait for confidence confirmation.
When the confiance score is below 60%, the volume pressure is choppy, volatility is high, you want to avoid trading or reduce position size, wait for confidence improvements, use support and resistance for entries/exits and use tighter stops due to market conditions. This is an indication of a ranging market.
Another scenario is when there is a sudden volume pressure increase, and a raising confidence score, the volatility is expanding and the bar momentum is aligning the volatility direction. This can indicate a breakout scenario.
> How it Works
1. Volume Pressure Analysis
Volume Pressure Analysis is a key component that measures the true buying and selling force in the market. Here's a detailed breakdown. The idea is to standardize volume to prevent large spikes from skewing results.
The indicator employs an adaptive volume normalization technique to detect genuine buying and selling pressure.
It takes current volume and divides it by average volume.
If normVol > 1: Current volume is above average
If normVol < 1: Current volume is below average
An example if this would be If current volume is 1500 and average is 1000, normVol = 1.5 (50% above average)
Another component of the volume pressure analysis is the Price Change Calculation sub-module. The purpose of this is to measure price movement relative to recent average.
It works by subtracting the average price from the current price. If the value is positive, price is average and if negative, price is below average.
Finally, the volume pressure is calculated to combine volume and price for true pressure reading.
2. Savitzky-Golay Filtering
SG filtering implements advanced signal smoothing while preserving important trend features. It uses weighted moving average approximation, preserves higher moments of data and reduces noise while maintaining signal integrity.
This results in smoother signal lines, reduced false crossovers and better trend identification. Traditional moving averages tend to lag and smooth out important features. Additionally, simple moving averages can miss critical turning points and regular smoothing can delay signal generation.
SG filtering preserves higher moments such as peaks, valleys and trends, reduces noise while maintaining signal sharpness.
It works by creating a symmetric weighting scheme. This way center points get the highest weights while edge points get the lowest weight.
3. Parkinson's Volatility
Parkinson's Volatility is an advanced volatility measurement formula using high-low range data. It uses high-low range for volatility calculation, incorporates logarithmic returns and annualized the volatility measure.
This results in more accurate volatility measurement, better risk assessment and dynamic signal sensitivity.
4. Multi-timeframe Momentum
This combines signals from each module for each timeframe to calculate momentum across three timeframes. It also applies weighted importance to each timeframe and generates a composite momentum signal.
This results in a more comprehensive trend analysis, reduced timeframe bias and better trend confirmation.
> Indicator Settings
Short-term Period:
Lower values makes it more sensitive, meaning it will generate more signals. Higher values makes it less sensitive, resulting in fewer signals. We recommend a 5 to 15 range for day trading, and 10 to 20 for swing trading
Medium-term Period:
Lower values result in faster trend confirmation and higher values show slower and more reliable confirmation. We recommend a range of 15-25 for day trading and 20-30 for swing trading.
Long-term Period:
Lower values makes it more responsive to trend changes and higher values are better for major trend identification. We recommend a range of 40-60 for day trading and 50-100 for swing trading.
Volume Analysis Window:
Lower values result in more sensitivity to volume changes and higher values result in smoother volume analysis. The optimal range is 15-25 for most trading styles.
Confidence Threshold:
Lower values generate more signals but quality decreases. Higher values generate fewer signals but accuracy increases.The optimal range is 0.65-0.8 for most trading conditions.

Session Opening Ranges [DB](Reuploaded with open source script)
A simple indicator that displays the 15 minute opening ranges of the Asia, London and New York trading sessions.
You can select how many days you want to display in total and also customise the colors of each session. The indicator is coded to NY time and should always display at the correct times, which are:
- 18:00 - 18:15 for Asia
- 03:00 - 03:15 for London
- 09:30 - 09:45 for New York
You can also choose to display the sessions name and/or range in points.
If you find any bugs let me know in the comments.
Enjoy!
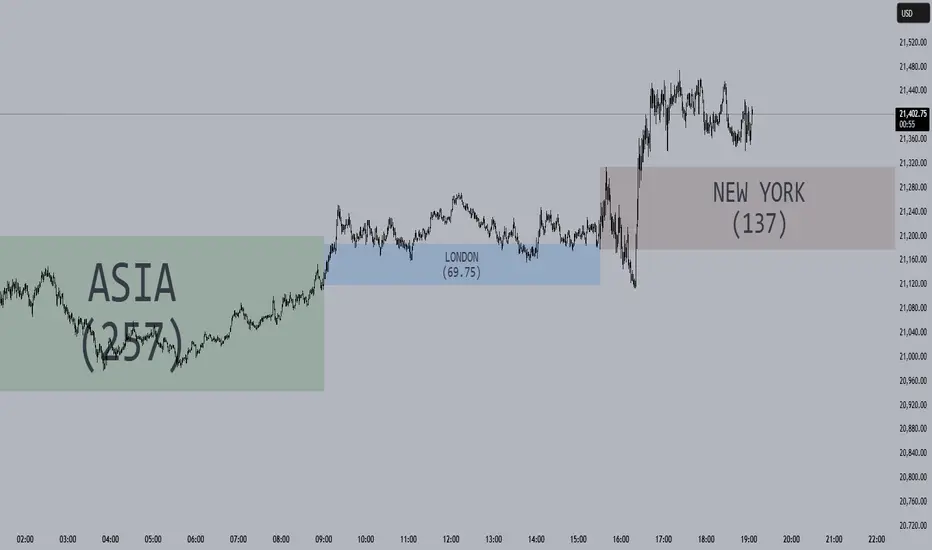
Twitter Model ICT [TradingFinder] MMXM ERL D + FVG + M15 MSS/SMT🔵 Introduction
The Twitter Model ICT is a trading approach based on ICT (Inner Circle Trader) models, focusing on price movement between external and internal liquidity in lower timeframes. This model integrates key concepts such as Market Structure Shift (MSS), Smart Money Technique (SMT) divergence, and CISD level break to identify precise entry points in the market.
The primary goal of this model is to determine key liquidity levels, such as the previous day’s high and low (PDH/PDL) and align them with the Fair Value Gap (FVG) in the 1-hour timeframe. The overall strategy involves framing trades around the 1H FVG and using the M15 Market Structure Shift (MSS) for entry confirmation.
The Twitter Model ICT is designed to utilize external liquidity levels, such as PDH/PDL, as key entry zones. The model identifies FVG in the 1-hour timeframe, which acts as a magnet for price movement. Additionally, traders confirm entries using M15 Market Structure Shift (MSS) and SMT divergence.
Bullish Twitter Model :
In a bullish setup, the price sweeps the previous day’s low (PDL), and after confirming reversal signals, buys are executed in internal liquidity zones. Conversely, in a bearish setup, the price sweeps the previous day’s high (PDH), and after confirming weakness signals, sells are executed.
Bearish Twitter Model :
In short setups, entries are only executed above the Midnight Open, while in long setups, entries are taken below the Midnight Open. Adhering to these principles allows traders to define precise entry and exit points and analyze price movement with greater accuracy based on liquidity and market structure.
🔵 How to Use
The Twitter Model ICT is a liquidity-based trading strategy that analyzes price movements relative to the previous day’s high and low (PDH/PDL) and Fair Value Gap (FVG). This model is applicable in both bullish and bearish directions and utilizes the 1-hour (1H) and 15-minute (M15) timeframes for entry confirmation.
The price first sweeps an external liquidity level (PDH or PDL) and then provides an entry opportunity based on Market Structure Shift (MSS) and SMT divergence. Additionally, the entry should be positioned relative to the Midnight Open, meaning long entries should occur below the Midnight Open and short entries above it.
🟣 Bullish Twitter Model
In a bullish setup, the price first sweeps the previous day’s low (PDL) and reaches an external liquidity level. Then, in the 1-hour timeframe (1H), a bullish Fair Value Gap (FVG) forms, which serves as the price target.
To confirm the entry, a Market Structure Shift (MSS) in the 15-minute timeframe (M15) should be observed, signaling a trend reversal to the upside. Additionally, SMT divergence with correlated assets can indicate weakness in selling pressure.
Under these conditions, a long position is taken below the Midnight Open, with a stop-loss placed at the lowest point of the recent bearish move. The price target for this trade is the FVG in the 1-hour timeframe.
🟣 Bearish Twitter Model
In a bearish setup, the price first sweeps the previous day’s high (PDH) and reaches an external liquidity level. Then, in the 1-hour timeframe (1H), a bearish Fair Value Gap (FVG) is identified, serving as the trade target.
To confirm entry, a Market Structure Shift (MSS) in the 15-minute timeframe (M15) should form, signaling a trend shift to the downside. If an SMT divergence is present, it can provide additional confirmation for the trade.
Once these conditions are met, a short position is taken above the Midnight Open, with a stop-loss placed at the highest level of the recent bullish move. The trade's price target is the FVG in the 1-hour timeframe.
🔵 Settings
Bar Back Check : Determining the return of candles to identify the CISD level.
CISD Level Validity : CISD level validity period based on the number of candles.
Daily Position : Determines whether only the first signal of the day is considered or if signals are evaluated throughout the entire day.
Session : Specifies in which trading sessions the indicator will be active.
Second Symbol : This setting allows you to select another asset for comparison with the primary asset. By default, "XAUUSD" (Gold) is set as the second symbol, but you can change it to any currency pair, stock, or cryptocurrency. For example, you can choose currency pairs like EUR/USD or GBP/USD to identify divergences between these two assets.
Divergence Fractal Periods : This parameter defines the number of past candles to consider when identifying divergences. The default value is 2, but you can change it to suit your preferences. This setting allows you to detect divergences more accurately by selecting a greater number of candles.
The indicator allows displaying sessions based on various time zones. The user can select one of the following options :
UTC (Coordinated Universal Time)
Local Time of the Session
User’s Local Time
Show Open Price : Displays the New York market opening price.
Show PDH / PDL : Displays the previous day’s high and low to identify potential entry points.
Show SMT Divergence : Displays lines and labels for bullish ("+SMT") and bearish ("-SMT") divergences.
🔵 Conclusion
The Twitter Model ICT is an effective approach for analyzing and executing trades in financial markets, utilizing a combination of liquidity principles, market structure, and SMT confirmations to identify optimal entry and exit points.
By analyzing the previous day’s high and low (PDH/PDL), Fair Value Gaps (FVG), and Market Structure Shift (MSS) in the 1H and M15 timeframes, traders can pinpoint liquidity-driven trade opportunities. Additionally, considering the Midnight Open level helps traders avoid random entries and ensures better trade placement.
By applying this model, traders can interpret market movements based on liquidity flow and structural changes, allowing them to fine-tune their trading decisions with higher precision. Ultimately, the Twitter Model ICT provides a structured and logical approach for traders who seek to trade based on liquidity behavior and trend shifts in the market.
