Larry Williams Bonus Track PatternThis strategy trades the day immediately following an Inside Day, under specific directional and timing conditions. It is designed for daily-based setups but executed on intraday charts to ensure orders are placed exactly at the open of the following day, rather than at the daily bar close.
Entry Conditions
Only trades on Monday, Thursday, or Friday.
The previous day must be an Inside Day (its high is lower than the prior high and its low is higher than the prior low).
The bar before the Inside Day must be bullish (close > open).
On the following day (t):
The daily open must be below both the Inside Day’s high and the highest high of the two days before that.
A buy stop is placed at the highest high of the three previous days (Inside Day and the two days before it).
If the new day’s open is already above that level (gap up), the strategy enters long immediately at the open.
Exit Rules
Stop Loss: Fixed, defined in points or percentage (user input).
FPO (First Profitable Open): the position is closed at the first daily open after the entry day where the open price is above the average entry price (the first profitable open).
Notes
The script must be applied on an intraday timeframe (e.g., 15-minute or 1-hour) so that the strategy can:
Detect the Inside Day pattern using daily data (request.security).
Execute orders in real time at the next day’s open.
Running it directly on the daily timeframe will delay executions by one bar due to Pine Script’s evaluation model.
在脚本中搜索"机械革命无界15+时不时闪屏"

Stochastic Enhanced [DCAUT]█ Stochastic Enhanced
📊 ORIGINALITY & INNOVATION
The Stochastic Enhanced indicator builds upon George Lane's classic momentum oscillator (developed in the late 1950s) by providing comprehensive smoothing algorithm flexibility. While traditional implementations limit users to Simple Moving Average (SMA) smoothing, this enhanced version offers 21 advanced smoothing algorithms, allowing traders to optimize the indicator's characteristics for different market conditions and trading styles.
Key Improvements:
Extended from single SMA smoothing to 21 professional-grade algorithms including adaptive filters (KAMA, FRAMA), zero-lag methods (ZLEMA, T3), and advanced digital filters (Kalman, Laguerre)
Maintains backward compatibility with traditional Stochastic calculations through SMA default setting
Unified smoothing algorithm applies to both %K and %D lines for consistent signal processing characteristics
Enhanced visual feedback with clear color distinction and background fill highlighting for intuitive signal recognition
Comprehensive alert system covering crossovers and zone entries for systematic trade management
Differentiation from Traditional Stochastic:
Traditional Stochastic indicators use fixed SMA smoothing, which introduces consistent lag regardless of market volatility. This enhanced version addresses the limitation by offering adaptive algorithms that adjust to market conditions (KAMA, FRAMA), reduce lag without sacrificing smoothness (ZLEMA, T3, HMA), or provide superior noise filtering (Kalman Filter, Laguerre filters). The flexibility helps traders balance responsiveness and stability according to their specific needs.
📐 MATHEMATICAL FOUNDATION
Core Stochastic Calculation:
The Stochastic Oscillator measures the position of the current close relative to the high-low range over a specified period:
Step 1: Raw %K Calculation
%K_raw = 100 × (Close - Lowest Low) / (Highest High - Lowest Low)
Where:
Close = Current closing price
Lowest Low = Lowest low over the %K Length period
Highest High = Highest high over the %K Length period
Result ranges from 0 (close at period low) to 100 (close at period high)
Step 2: Smoothed %K Calculation
%K = MA(%K_raw, K Smoothing Period, MA Type)
Where:
MA = Selected moving average algorithm (SMA, EMA, etc.)
K Smoothing = 1 for Fast Stochastic, 3+ for Slow Stochastic
Traditional Fast Stochastic uses %K_raw directly without smoothing
Step 3: Signal Line %D Calculation
%D = MA(%K, D Smoothing Period, MA Type)
Where:
%D acts as a signal line and moving average of %K
D Smoothing typically set to 3 periods in traditional implementations
Both %K and %D use the same MA algorithm for consistent behavior
Available Smoothing Algorithms (21 Options):
Standard Moving Averages:
SMA (Simple): Equal-weighted average, traditional default, consistent lag characteristics
EMA (Exponential): Recent price emphasis, faster response to changes, exponential decay weighting
RMA (Rolling/Wilder's): Smoothed average used in RSI, less reactive than EMA
WMA (Weighted): Linear weighting favoring recent data, moderate responsiveness
VWMA (Volume-Weighted): Incorporates volume data, reflects market participation intensity
Advanced Moving Averages:
HMA (Hull): Reduced lag with smoothness, uses weighted moving averages and square root period
ALMA (Arnaud Legoux): Gaussian distribution weighting, minimal lag with good noise reduction
LSMA (Least Squares): Linear regression based, fits trend line to data points
DEMA (Double Exponential): Reduced lag compared to EMA, uses double smoothing technique
TEMA (Triple Exponential): Further lag reduction, triple smoothing with lag compensation
ZLEMA (Zero-Lag Exponential): Lag elimination attempt using error correction, very responsive
TMA (Triangular): Double-smoothed SMA, very smooth but slower response
Adaptive & Intelligent Filters:
T3 (Tilson T3): Six-pass exponential smoothing with volume factor adjustment, excellent smoothness
FRAMA (Fractal Adaptive): Adapts to market fractal dimension, faster in trends, slower in ranges
KAMA (Kaufman Adaptive): Efficiency ratio based adaptation, responds to volatility changes
McGinley Dynamic: Self-adjusting mechanism following price more accurately, reduced whipsaws
Kalman Filter: Optimal estimation algorithm from aerospace engineering, dynamic noise filtering
Advanced Digital Filters:
Ultimate Smoother: Advanced digital filter design, superior noise rejection with minimal lag
Laguerre Filter: Time-domain filter with N-order implementation, adjustable lag characteristics
Laguerre Binomial Filter: 6-pole Laguerre filter, extremely smooth output for long-term analysis
Super Smoother: Butterworth filter implementation, removes high-frequency noise effectively
📊 COMPREHENSIVE SIGNAL ANALYSIS
Absolute Level Interpretation (%K Line):
%K Above 80: Overbought condition, price near period high, potential reversal or pullback zone, caution for new long entries
%K in 70-80 Range: Strong upward momentum, bullish trend confirmation, uptrend likely continuing
%K in 50-70 Range: Moderate bullish momentum, neutral to positive outlook, consolidation or mild uptrend
%K in 30-50 Range: Moderate bearish momentum, neutral to negative outlook, consolidation or mild downtrend
%K in 20-30 Range: Strong downward momentum, bearish trend confirmation, downtrend likely continuing
%K Below 20: Oversold condition, price near period low, potential bounce or reversal zone, caution for new short entries
Crossover Signal Analysis:
%K Crosses Above %D (Bullish Cross): Momentum shifting bullish, faster line overtakes slower signal, consider long entry especially in oversold zone, strongest when occurring below 20 level
%K Crosses Below %D (Bearish Cross): Momentum shifting bearish, faster line falls below slower signal, consider short entry especially in overbought zone, strongest when occurring above 80 level
Crossover in Midrange (40-60): Less reliable signals, often in choppy sideways markets, require additional confirmation from trend or volume analysis
Multiple Failed Crosses: Indicates ranging market or choppy conditions, reduce position sizes or avoid trading until clear directional move
Advanced Divergence Patterns (%K Line vs Price):
Bullish Divergence: Price makes lower low while %K makes higher low, indicates weakening bearish momentum, potential trend reversal upward, more reliable when %K in oversold zone
Bearish Divergence: Price makes higher high while %K makes lower high, indicates weakening bullish momentum, potential trend reversal downward, more reliable when %K in overbought zone
Hidden Bullish Divergence: Price makes higher low while %K makes lower low, indicates trend continuation in uptrend, bullish trend strength confirmation
Hidden Bearish Divergence: Price makes lower high while %K makes higher high, indicates trend continuation in downtrend, bearish trend strength confirmation
Momentum Strength Analysis (%K Line Slope):
Steep %K Slope: Rapid momentum change, strong directional conviction, potential for extended moves but also increased reversal risk
Gradual %K Slope: Steady momentum development, sustainable trends more likely, lower probability of sharp reversals
Flat or Horizontal %K: Momentum stalling, potential reversal or consolidation ahead, wait for directional break before committing
%K Oscillation Within Range: Indicates ranging market, sideways price action, better suited for range-trading strategies than trend following
🎯 STRATEGIC APPLICATIONS
Mean Reversion Strategy (Range-Bound Markets):
Identify ranging market conditions using price action or Bollinger Bands
Wait for Stochastic to reach extreme zones (above 80 for overbought, below 20 for oversold)
Enter counter-trend position when %K crosses %D in extreme zone (sell on bearish cross above 80, buy on bullish cross below 20)
Set profit targets near opposite extreme or midline (50 level)
Use tight stop-loss above recent swing high/low to protect against breakout scenarios
Exit when Stochastic reaches opposite extreme or %K crosses %D in opposite direction
Trend Following with Momentum Confirmation:
Identify primary trend direction using higher timeframe analysis or moving averages
Wait for Stochastic pullback to oversold zone (<20) in uptrend or overbought zone (>80) in downtrend
Enter in trend direction when %K crosses %D confirming momentum shift (bullish cross in uptrend, bearish cross in downtrend)
Use wider stops to accommodate normal trend volatility
Add to position on subsequent pullbacks showing similar Stochastic pattern
Exit when Stochastic shows opposite extreme with failed cross or bearish/bullish divergence
Divergence-Based Reversal Strategy:
Scan for divergence between price and Stochastic at swing highs/lows
Confirm divergence with at least two price pivots showing divergent Stochastic readings
Wait for %K to cross %D in direction of anticipated reversal as entry trigger
Enter position in divergence direction with stop beyond recent swing extreme
Target profit at key support/resistance levels or Fibonacci retracements
Scale out as Stochastic reaches opposite extreme zone
Multi-Timeframe Momentum Alignment:
Analyze Stochastic on higher timeframe (4H or Daily) for primary trend bias
Switch to lower timeframe (1H or 15M) for precise entry timing
Only take trades where lower timeframe Stochastic signal aligns with higher timeframe momentum direction
Higher timeframe Stochastic in bullish zone (>50) = only take long entries on lower timeframe
Higher timeframe Stochastic in bearish zone (<50) = only take short entries on lower timeframe
Exit when lower timeframe shows counter-signal or higher timeframe momentum reverses
Zone Transition Strategy:
Monitor Stochastic for transitions between zones (oversold to neutral, neutral to overbought, etc.)
Enter long when Stochastic crosses above 20 (exiting oversold), signaling momentum shift from bearish to neutral/bullish
Enter short when Stochastic crosses below 80 (exiting overbought), signaling momentum shift from bullish to neutral/bearish
Use zone midpoint (50) as dynamic support/resistance for position management
Trail stops as Stochastic advances through favorable zones
Exit when Stochastic fails to maintain momentum and reverses back into prior zone
📋 DETAILED PARAMETER CONFIGURATION
%K Length (Default: 14):
Lower Values (5-9): Highly sensitive to price changes, generates more frequent signals, increased false signals in choppy markets, suitable for very short-term trading and scalping
Standard Values (10-14): Balanced sensitivity and reliability, traditional default (14) widely used,适合 swing trading and intraday strategies
Higher Values (15-21): Reduced sensitivity, smoother oscillations, fewer but potentially more reliable signals, better for position trading and lower timeframe noise reduction
Very High Values (21+): Slow response, long-term momentum measurement, fewer trading signals, suitable for weekly or monthly analysis
%K Smoothing (Default: 3):
Value 1: Fast Stochastic, uses raw %K calculation without additional smoothing, most responsive to price changes, generates earliest signals with higher noise
Value 3: Slow Stochastic (default), traditional smoothing level, reduces false signals while maintaining good responsiveness, widely accepted standard
Values 5-7: Very slow response, extremely smooth oscillations, significantly reduced whipsaws but delayed entry/exit timing
Recommendation: Default value 3 suits most trading scenarios, active short-term traders may use 1, conservative long-term positions use 5+
%D Smoothing (Default: 3):
Lower Values (1-2): Signal line closely follows %K, frequent crossover signals, useful for active trading but requires strict filtering
Standard Value (3): Traditional setting providing balanced signal line behavior, optimal for most trading applications
Higher Values (4-7): Smoother signal line, fewer crossover signals, reduced whipsaws but slower confirmation, better for trend trading
Very High Values (8+): Signal line becomes slow-moving reference, crossovers rare and highly significant, suitable for long-term position changes only
Smoothing Type Algorithm Selection:
For Trending Markets:
ZLEMA, DEMA, TEMA: Reduced lag for faster trend entry, quick response to momentum shifts, suitable for strong directional moves
HMA, ALMA: Good balance of smoothness and responsiveness, effective for clean trend following without excessive noise
EMA: Classic choice for trending markets, faster than SMA while maintaining reasonable stability
For Ranging/Choppy Markets:
Kalman Filter, Super Smoother: Superior noise filtering, reduces false signals in sideways action, helps identify genuine reversal points
Laguerre Filters: Smooth oscillations with adjustable lag, excellent for mean reversion strategies in ranges
T3, TMA: Very smooth output, filters out market noise effectively, clearer extreme zone identification
For Adaptive Market Conditions:
KAMA: Automatically adjusts to market efficiency, fast in trends and slow in congestion, reduces whipsaws during transitions
FRAMA: Adapts to fractal market structure, responsive during directional moves, conservative during uncertainty
McGinley Dynamic: Self-adjusting smoothing, follows price naturally, minimizes lag in trending markets while filtering noise in ranges
For Conservative Long-Term Analysis:
SMA: Traditional choice, predictable behavior, widely understood characteristics
RMA (Wilder's): Smooth oscillations, reduced sensitivity to outliers, consistent behavior across market conditions
Laguerre Binomial Filter: Extremely smooth output, ideal for weekly/monthly timeframe analysis, eliminates short-term noise completely
Source Selection:
Close (Default): Standard choice using closing prices, most common and widely tested
HLC3 or OHLC4: Incorporates more price information, reduces impact of sudden spikes or gaps, smoother oscillator behavior
HL2: Midpoint of high-low range, emphasizes intrabar volatility, useful for markets with wide intraday ranges
Custom Source: Can use other indicators as input (e.g., Heikin Ashi close, smoothed price), creates derivative momentum indicators
📈 PERFORMANCE ANALYSIS & COMPETITIVE ADVANTAGES
Responsiveness Characteristics:
Traditional SMA-Based Stochastic:
Fixed lag regardless of market conditions, consistent delay of approximately (K Smoothing + D Smoothing) / 2 periods
Equal treatment of trending and ranging markets, no adaptation to volatility changes
Predictable behavior but suboptimal in varying market regimes
Enhanced Version with Adaptive Algorithms:
KAMA and FRAMA reduce lag by up to 40-60% in strong trends compared to SMA while maintaining similar smoothness in ranges
ZLEMA and T3 provide near-zero lag characteristics for early entry signals with acceptable noise levels
Kalman Filter and Super Smoother offer superior noise rejection, reducing false signals in choppy conditions by estimations of 30-50% compared to SMA
Performance improvements vary by algorithm selection and market conditions
Signal Quality Improvements:
Adaptive algorithms help reduce whipsaw trades in ranging markets by adjusting sensitivity dynamically
Advanced filters (Kalman, Laguerre, Super Smoother) provide clearer extreme zone readings for mean reversion strategies
Zero-lag methods (ZLEMA, DEMA, TEMA) generate earlier crossover signals in trending markets for improved entry timing
Smoother algorithms (T3, Laguerre Binomial) reduce false extreme zone touches for more reliable overbought/oversold signals
Comparison with Standard Implementations:
Versus Basic Stochastic: Enhanced version offers 21 smoothing options versus single SMA, allowing optimization for specific market characteristics and trading styles
Versus RSI: Stochastic provides range-bound measurement (0-100) with clear extreme zones, RSI measures momentum speed, Stochastic offers clearer visual overbought/oversold identification
Versus MACD: Stochastic bounded oscillator suitable for mean reversion, MACD unbounded indicator better for trend strength, Stochastic excels in range-bound and oscillating markets
Versus CCI: Stochastic has fixed bounds (0-100) for consistent interpretation, CCI unbounded with variable extremes, Stochastic provides more standardized extreme readings across different instruments
Flexibility Advantages:
Single indicator adaptable to multiple strategies through algorithm selection rather than requiring different indicator variants
Ability to optimize smoothing characteristics for specific instruments (e.g., smoother for crypto volatility, faster for forex trends)
Multi-timeframe analysis with consistent algorithm across timeframes for coherent momentum picture
Backtesting capability with algorithm as optimization parameter for strategy development
Limitations and Considerations:
Increased complexity from multiple algorithm choices may lead to over-optimization if parameters are curve-fitted to historical data
Adaptive algorithms (KAMA, FRAMA) have adjustment periods during market regime changes where signals may be less reliable
Zero-lag algorithms sacrifice some smoothness for responsiveness, potentially increasing noise sensitivity in very choppy conditions
Performance characteristics vary significantly across algorithms, requiring understanding and testing before live implementation
Like all oscillators, Stochastic can remain in extreme zones for extended periods during strong trends, generating premature reversal signals
USAGE NOTES
This indicator is designed for technical analysis and educational purposes to provide traders with enhanced flexibility in momentum analysis. The Stochastic Oscillator has limitations and should not be used as the sole basis for trading decisions.
Important Considerations:
Algorithm performance varies with market conditions - no single smoothing method is optimal for all scenarios
Extreme zone signals (overbought/oversold) indicate potential reversal areas but not guaranteed turning points, especially in strong trends
Crossover signals may generate false entries during sideways choppy markets regardless of smoothing algorithm
Divergence patterns require confirmation from price action or additional indicators before trading
Past indicator characteristics and backtested results do not guarantee future performance
Always combine Stochastic analysis with proper risk management, position sizing, and multi-indicator confirmation
Test selected algorithm on historical data of specific instrument and timeframe before live trading
Market regime changes may require algorithm adjustment for optimal performance
The enhanced smoothing options are intended to provide tools for optimizing the indicator's behavior to match individual trading styles and market characteristics, not to create a perfect predictive tool. Responsible usage includes understanding the mathematical properties of selected algorithms and their appropriate application contexts.

EMAs 20 - 40 - 100 - 200
This script contains the 20-40-100-200 EMAs.
EMA (Exponential)
Best for active or short-term trading because:
It adjusts more quickly to recent price changes.
It allows for earlier detection of trend reversals.
It is preferred by traders who trade calls and puts for a few days or weeks.
Example:
On 15-minute, 1-hour, or daily time frames, the 20-EMA or 40-EMA gives you early signals to open or close options.
It is good for momentum trades or quick breakouts.
Session-Conditioned Regime ATRWhy this exists
Classic ATR is great—until the open. The first few bars often inherit overnight gaps and 24-hour noise that have nothing to do with the intraday regime you actually trade. That inflates early ATR, scrambles thresholds, and invites hyper-recency bias (“today is crazy!”) when it’s just the open being the open.
This tool was built to:
Separate session reality from 24h noise. Measure volatility only inside your defined session (e.g., NYSE 09:30–16:00 ET).
Judge candles against the current regime, not the last 2–3 bars. A rolling statistic from the last N completed sessions defines what “typical” means right now.
Label “large” and “small” objectively. Bars are colored only when True Range meaningfully departs from the session regime—no gut feel, no open-bar distortion (gap inclusion optional).
Overview
Purpose: objectively identify unusually big or small candles within the active trading session, compared to the recent session regime.
Use cases: volatility filters, entry/exit confirmation, session bias detection, adaptive sizing.
This indicator replaces generic ATR with a session-conditioned, regime-aware measure. It colors candles only when their True Range (TR) is abnormally large/small versus the last N completed sessions of the same session window.
How it works
Session gating: Only bars inside the selected session are evaluated (presets for NYSE, CME RTH, FX NY; custom supported).
Per-bar TR: TR = max(high, prevRef) − min(low, prevRef).
prevRef is the prior close for in-session bars.
First bar of the session can include the overnight gap (optional; default off).
Regime statistic: For any bar in session k, aggregate all in-session TRs from the previous N completed sessions (k−N … k−1), then compute Median (default) or Mean.
Today’s anchor: Running statistic from today’s session start → current bar (for context and the on-chart ratio).
Color logic:
Big if TR ≥ bigMult × RegimeStat
Small if TR ≤ smallMult × RegimeStat
Colored states: big bull, big bear, small bull, small bear.
Non-triggering bars retain the chart’s native colors.
Panel (top-right by default)
Regime ATR (Nd): session-conditioned statistic over the past N completed sessions.
Today ATR (anchored): running statistic for the current session.
Ratio (Today/Regime): intraday volatility vs regime.
Sample size n: number of bars used in the regime calculation.
Inputs
Session Preset: NYSE (09:30–16:00 ET), CME RTH (08:30–15:00 CT), FX NY (08:00–17:00 ET), Custom (session + IANA timezone).
Regime Window: number of completed sessions (default 5).
Statistic: Median (robust) or Mean.
Include Open Gap: include overnight gap in the first in-session bar’s TR (default off).
Big/Small thresholds: multipliers relative to RegimeStat (defaults: Big=1.5×, Small=0.67×).
Colors: four independent colors for big/small × bull/bear.
Panel position & text size.
Hidden outputs: expose RegimeStat, TodayStat, Ratio, and Z-score to other scripts.
Alerts
RegimeATR: BIG bar — triggers when a bar meets the “Big” condition.
RegimeATR: SMALL bar — triggers when a bar meets the “Small” condition.
Hidden outputs (for strategies/screeners)
RegimeATR_stat, TodayATR_stat, Today_vs_Regime_Ratio, BarTR_Zscore.
Notes & limitations
No look-ahead: calculations only use information available up to that bar. Historical colors reflect what would have been known then.
Warm-up: colors begin once there are at least N completed sessions; before that, regime is undefined by design.
Changing inputs (session window, multipliers, median/mean, gap toggle) recomputes the full series using the same rolling regime logic per bar.
Designed for standard candles. Styling respects existing chart colors when no condition triggers.
Practical tips
For a broader or tighter notion of “unusual,” adjust Big/Small multipliers.
Prefer Median in markets prone to outliers; use Mean if you want Z-score alignment with the panel’s regime mean/std.
Use the Ratio readout to spot compression/expansion days quickly (e.g., <0.7× = compressed session, >1.3× = expanded).
Roadmap
More session presets:
24h continuous (crypto, index CFDs).
23h/Globex futures (CME ETH with a 60-minute maintenance break).
Regional equities (LSE, Xetra, TSE), Asia/Europe/NY overlaps for FX.
Half-day/holiday templates and dynamic calendars.
Multi-regime comparison: track multiple overlapping regimes (e.g., RTH vs ETH for futures) and show separate stats/ratios.
Robust stats options: trimmed mean, MAD/Huber alternatives; optional percentile thresholds instead of fixed multipliers.
Subpanel visuals: rolling TodayATR and Ratio plots; optional Z-score ribbon.
Screener/strategy hooks: export boolean series for BIG/SMALL, plus a lightweight strategy template for backtesting entries/exits conditioned on regime volatility.
Performance/QOL: per-symbol presets, smarter warm-up, and finer control over sample caps for ultra-low TF charts.
Changelog
v0.9b (Beta)
Session presets (NYSE/CME RTH/FX NY/Custom) with timezone handling.
Panel enhancements: ratio + sample size n.
Four-state bar coloring (big/small × bull/bear).
Alerts for BIG/SMALL bars.
Hidden Z-score stream for downstream use.
Gap-in-TR toggle for the first in-session bar.
Disclaimer
For educational purposes only. Not investment advice. Validate thresholds and session settings across symbols/timeframes before live use.

Rolling Midpoint of Price & VWAP with ATR BandsThe Rolling Midpoint of Price & VWAP with ATR Bands indicator is a dual-equilibrium concept that fuses price-range structure and traded-volume flow into one continuously updating hybrid model. Traditional VWAPs reset each session and reflect where trading occurred by volume, while midpoints used here reveal where price has structurally balanced between extremes. This script merges both ideas into a cohesive, dynamic system. The Rolling Price Midpoint (50 % of range) represents the structural fair-value line, calculated as the average of the highest high and lowest low over a selected window. The Rolling VWAP (Volume-Weighted Window) tracks the flow-based fair-value line by weighting each bar’s typical price by its volume. Together, these components form the Hybrid Equilibrium — the adaptive center of gravity that shifts as price and volume evolve. Surrounding this equilibrium, ATR Bands at ± 2.226 ATR and ± 5.382 ATR define volatility envelopes that expand and contract with market energy. The result is a living cloud that breathes with the market: compressing during phases of balance and widening during impulsive movements, offering traders a clear visual framework for understanding equilibrium, volatility, and directional bias in real time.
➖
⚙️ Auto-Preset System
The Auto-Preset System intelligently adjusts lookback windows for both the Price Midpoint and VWAP calculations according to the active chart timeframe.
This ensures that the indicator automatically adapts to any trading style — from scalping on 1-minute charts to swing trading on daily or weekly charts — without manual tuning.
🔹 How It Works
When Auto-Preset mode is enabled, the script dynamically selects the most effective lookback lengths for each timeframe.
These presets are optimized to balance responsiveness and stability, maintaining consistent real-world coverage (e.g., the same approximate duration of price data) across all intervals.
📊 Preset Mapping Table
| Chart Timeframe | Price Midpoint Lookback | VWAP Lookback |
|:----------------:|:-----------------------:|:--------------:|
| 1–3m | 13 bars | 21 bars
| 5–10m | 21 bars | 34 bars
| 15–30m | 34 bars | 55 bars
| 1–2 hr | 55 bars | 89 bars
| 4 hr-1D | 89 bars | 144 bars
| 1W | 144 bars | 233 bars
| 1M | 233 bars | 377 bars
⚡ Notes & Customization
- Manual Override: Turn off Auto-Preset Mode to specify your own custom lookback lengths.
- Consistency Across Scales: These adaptive values keep the indicator visually coherent when switching between timeframes — avoiding distortions that can occur with static lengths.
- Practical Benefit: Traders can maintain a single chart layout that self-tunes seamlessly, removing the need to manually recalibrate settings when shifting from short-term to long-term analysis.
In short, the Auto-Preset System is designed to make this hybrid equilibrium tool timeframe-aware — automatically scaling its logic so that the cloud behaves consistently, regardless of chart resolution.
➖
🌐 Hybrid Equilibrium Envelope
The core hybrid midpoint acts as the mean of structural (price) and volumetric (VWAP) balance.
ATR-based bands project natural expansion zones:
🔸+2.226 / –2.226 ATR → inner equilibrium (controlled trend)
*🔸+5.382 / –5.382 ATR → outer volatility extension (over-stretch / reversion zones)
Color-coded fills show regime strength:
* 🟧 Upper Outer (+5.382) – strong bullish expansion
* 🟩 Upper Inner (+2.226) – trending equilibrium
* 🔴 Lower Inner (–2.226) – mild bearish control
* 🟣 Lower Outer (–5.382) – volatility exhaustion
➖
🧭 Higher-Timeframe Framework
Two macro anchors — Price length of 144 and VWAP length of 233 — outline higher-timeframe bias zones. These help confirm when local momentum aligns with (or fades against) long-term structure.
Labels on the right show active lookback values for quick readout:
`$(13) V(21)` → current rolling pair
`$144 / V233` → macro anchors
➖
🧩 Chart Examples
**AMD 15m (Equilibrium Expansion)**
Price steadily rides above the hybrid midpoint as teal and orange (bullish) ATR zones widen, confirming a phase of controlled bullish volatility and healthy trend expansion.
BTCUSD 1m (Volatility Compression)
Bitcoin coils tightly inside the teal-to-maroon equilibrium bands before breaking out.
The hybrid midpoint flattens and ATR envelopes contract, signaling a state of balance before volatility expansion.
ETHUSD 15m (Transition from Compression → Impulse)
Ethereum transitions from purple-zone compression into a clear upper-band expansion.
The hybrid midpoint breaks above the macro VWAP 233, confirming the shift from equilibrium to directional momentum.
SOFI 1m (Micro Bias Reversal)
SOFI’s intraday structure flips as price reclaims the hybrid midpoint.
The macro VWAP 233 flattens, signaling a transition from oversold lower bands back toward equilibrium and early trend recovery.
➖
🎯 How to Use
1. Bias Detection – Price > Hybrid Midpoint → bullish; < → bearish.
2. Volatility Gauge – Watch band spacing for compression / expansion cycles.
3. Confluence Checks – Align Hybrid Midpoint with HTF 233 VWAP for strong continuation signals.
4. Mean Reversion Zones – Outer bands highlight areas where probability of snap-back increases.
➖
🔧 Inputs & Customization
Auto Presets toggle
🔸Manual Lookback Overrides** for fine-tuning
🔸Plot Window Length** (show recent vs full history)
🔸ATR Sensitivity & Fill Opacity** controls
🔸Label Padding / Font Size** for cleaner overlay visuals
➖
🧮 Formula Highlights
➖Rolling Midpoint = (highest(high,N) + lowest(low,N)) / 2
➖Rolling VWAP = Σ(Typical Price×Vol) / Σ(Vol)
➖Hybrid = (PriceMid + VWAP) / 2
➖Upper₂ = Hybrid + ATR×2.226
➖Lower₂ = Hybrid − ATR×2.226
➖Upper₅ = Hybrid + ATR×5.382
➖Lower₅ = Hybrid − ATR×5.382
➖
🎯 Ideal For
➡️ Traders who want adaptive fair-value zones that evolve with both price and volume.
➡️ Analysts who shift between scalping, swing, and position timeframes, and need a tool that self-adjusts.
➡️ Those who rely on visual structure clarity to confirm setups across changing volatility conditions.
➡️ Anyone seeking a hybrid model that unites structural range logic (midpoint) and flow-based balance (VWAP).
➖
🏁 Final Word
This script is more than a visual overlay — it’s a complete trend and structure framework built to adapt with market rhythm. It helps traders visualize equilibrium, momentum, and volatility as one cohesive system. Whether you’re seeking clean trend alignment, dynamic support/resistance, or early warning signs of reversals, this indicator is tuned to help you react with confidence — not hindsight.
➖
Remember — no single indicator should ever stand alone. For best results, pair it with price action context, higher-timeframe structure, and complementary tools such as moving averages or trendlines. Use it to confirm setups, not define them in isolation.
💡 Turn logic into clarity, structure into trades, and uncertainty into confidence.

Market Structure ICT Screener [TradingFinder] BoS ChoCh🔵 Introduction
Market Structure is the foundation of every Smart Money and ICT based trading model. It describes how price moves through a sequence of highs and lows, forming clear phases of expansion, retracement and reversal. Understanding this structure allows traders to read institutional order flow and align their positions with the true direction of liquidity.
Two of the most critical components in Market Structure are the Break of Structure (BOS) and Change of Character (CHOCH). A BOS represents trend continuation, confirming strength within the current direction. In contrast, CHOCH also known as a Market Structure Shift (MSS) signals the first sign of a trend reversal or liquidity shift where order flow begins to change from bullish to bearish or vice versa.
Because the market is fractal, structure can exist at multiple levels known as Major (External) and Minor (Internal). Major structure defines the overall trend on higher timeframes while minor or internal structure reveals short term swings and early reversals within that larger move.
🔵 How to Use
Understanding Market Structure starts with identifying how price interacts with previous swing highs and swing lows. Every trend in the market, whether bullish or bearish, is built from a sequence of impulsive and corrective moves. Impulsive legs show strong displacement in the direction of liquidity flow, while corrective legs represent temporary pullbacks as the market rebalances before the next expansion. Recognizing these sequences is essential for reading the story of price and anticipating what may happen next.
A Break of Structure (BOS) occurs when price decisively moves beyond a previous structural point by breaking above the last high in an uptrend or falling below the last low in a downtrend. This event confirms that the current trend remains intact and that liquidity has been successfully taken from one side of the market. A BOS acts as confirmation of continuation and reflects strength within the existing directional bias.
A Change of Character (CHOCH) appears when price violates structure in the opposite direction of the prevailing trend. This is the first signal that market sentiment and order flow may be shifting. For example, during a downtrend if price breaks above a previous high, it indicates that sellers are losing control and a potential bullish reversal may be developing. In an uptrend, when price drops below a recent low, it suggests a possible bearish transition.
Because the market is fractal, structure exists across multiple layers. Major structure reflects the dominant movement visible on higher timeframes and defines the broader directional bias. Minor or internal structure represents smaller swings within that move and helps identify early transitions before they appear on the higher timeframe. When internal and external structures align, they offer a high probability signal for trend continuation or reversal.
By observing BOS and CHOCH across both internal and external structures, traders can clearly visualize when the market is expanding, contracting or preparing to shift direction. This structured understanding of price movement forms the foundation for precise trend analysis and high quality decision making in any Smart Money or ICT based trading approach.
🔵 Settings
🟣 Display Settings
Table on Chart : Allows users to choose the position of the signal dashboard either directly on the chart or below it, depending on their layout preference.
Number of Symbols : Enables users to control how many symbols are displayed in the screener table, from 10 to 20, adjustable in increments of 2 symbols for flexible screening depth.
Table Mode : This setting offers two layout styles for the signal table :
Basic : Mode displays symbols in a single column, using more vertical space.
Extended : Mode arranges symbols in pairs side-by-side, optimizing screen space with a more compact view.
Table Size : Lets you adjust the table’s visual size with options such as: auto, tiny, small, normal, large, huge.
Table Position : Sets the screen location of the table. Choose from 9 possible positions, combining vertical (top, middle, bottom) and horizontal (left, center, right) alignments.
🟣 Symbol Settings
Each of the 20 symbol slots comes with a full set of customizable parameters :
Symbol : Define or select the asset (e.g., XAUUSD, BTCUSD, EURUSD, etc.).
Timeframe : Set your desired timeframe for each symbol (e.g., 15, 60, 240, 1D).
Pivot Period : Set the length used to detect swing highs and lows. Shorter values increase sensitivity, longer ones focus on major structures.
🔵 Conclusion
Mastering Market Structure and understanding the relationship between BOS and CHOCH allows traders to see the market with greater clarity and confidence. These two elements reveal how liquidity moves through different phases of expansion and retracement and how institutional order flow shifts between accumulation and distribution.
By analyzing both internal and external structures, traders can align short term and long term perspectives and anticipate where price is most likely to react. The ability to read these structural shifts helps identify continuation points, reversals and areas where liquidity is engineered or collected.
Incorporating Market Structure into a consistent trading process transforms the way a trader views the chart. Instead of reacting to random movements, each swing, break and shift becomes part of a logical framework that reflects the true behavior of the market. Understanding BOS and CHOCH is not just a concept but a complete language of price that guides every professional decision in Smart Money and ICT based trading.

Institutional Activity DetectorInstitutional Activity Detector - Complete Tutorial
Table of Contents
Installation
Understanding the Indicator
Signal Interpretation
Settings Configuration
Trading Strategies
Best Practices
Common Mistakes to Avoid
1. Installation {#installation}
Step-by-Step Setup:
Step 1: Access TradingView
Go to TradingView.com
Log in to your account (free account works fine)
Step 2: Open Pine Editor
Click on "Pine Editor" at the bottom of the chart
If you don't see it, go to the top menu and select "Pine Editor"
Step 3: Add the Script
Click "New" to create a new indicator
Delete any default code
Copy the entire Institutional Activity Detector code
Paste it into the editor
Step 4: Save and Apply
Click "Save" (give it a name like "Inst Detector")
Click "Add to Chart"
The indicator will now appear on your chart
2. Understanding the Indicator {#understanding}
What It Detects:
This indicator identifies institutional traders (banks, hedge funds, market makers) by analyzing:
Volume Analysis
Detects unusual volume spikes that indicate large players entering
Compares current volume to 20-period average
Institutional trades create volume 2-5x normal levels
Order Flow
Delta: Difference between buying and selling volume
Positive delta = More buying pressure
Negative delta = More selling pressure
Institutions leave "footprints" in order flow
Price Action Patterns
Bullish Rejection Wicks:
| <- Small upper wick
|
███ <- Small body
███
|
|
| <- Large lower wick (rejection)
Indicates institutions bought aggressively at lower prices
Bearish Rejection Wicks:
|
|
| <- Large upper wick (rejection)
|
███ <- Small body
███
| <- Small lower wick
Indicates institutions sold aggressively at higher prices
Liquidity Grabs
Institutions often:
Push price above resistance or below support
Trigger stop losses (grab liquidity)
Reverse direction and trade the other way
Dark Pool Activity
Large block trades executed off-exchange:
High volume with minimal price movement
Indicates institutional accumulation/distribution without moving price
3. Signal Interpretation {#signals}
Signal Types:
🟢 INSTITUTIONAL BUY Signal
Appears as green triangle below candle with strength number (2-5)
What it means:
Institutions are actively accumulating (buying)
Higher strength = More confirmation factors
Strength Levels:
2-3: Moderate confidence - Wait for confirmation
4: High confidence - Strong institutional interest
5: Maximum confidence - Multiple factors aligned
🔴 INSTITUTIONAL SELL Signal
Appears as red triangle above candle with strength number (2-5)
What it means:
Institutions are actively distributing (selling)
Higher strength = More confirmation factors
🟠 Dark Pool (DP) Marker
Small orange diamond
What it means:
Large block trade executed
Accumulation/distribution happening quietly
Often precedes significant moves
Liquidity Zones
Red boxes above price = Resistance/sell liquidity
Green boxes below price = Support/buy liquidity
Institutions target these zones to trigger stops
4. Settings Configuration {#settings}
Recommended Settings by Asset Type:
For Stocks (SPY, AAPL, TSLA):
Volume Spike Multiplier: 2.0
Volume Average Period: 20
Delta Threshold: 70%
Minimum Signal Strength: 3
Timeframe: 5m, 15m, 1H
For Forex (EUR/USD, GBP/USD):
Volume Spike Multiplier: 1.5
Volume Average Period: 30
Delta Threshold: 65%
Minimum Signal Strength: 3
Timeframe: 15m, 1H, 4H
For Crypto (BTC, ETH):
Volume Spike Multiplier: 2.5
Volume Average Period: 20
Delta Threshold: 70%
Minimum Signal Strength: 4
Timeframe: 15m, 1H, 4H
For Futures (ES, NQ):
Volume Spike Multiplier: 2.0
Volume Average Period: 20
Delta Threshold: 75%
Minimum Signal Strength: 3
Timeframe: 5m, 15m, 30m
Parameter Explanations:
Volume Spike Multiplier (1.0 - 10.0)
Lower = More sensitive (more signals, some false)
Higher = Less sensitive (fewer signals, more reliable)
Start with 2.0 and adjust based on your asset's volatility
Delta Threshold % (50 - 100)
Measures buying vs selling pressure
70% = Strong institutional bias required
Lower for ranging markets, higher for trending
Minimum Signal Strength (2 - 5)
Number of factors that must align for a signal
2 = Very sensitive (many signals)
5 = Very conservative (rare signals)
Recommended: 3-4 for balance
5. Trading Strategies {#strategies}
Strategy 1: Liquidity Grab Reversal
Setup:
Price approaches a liquidity zone (green/red box)
Price penetrates the zone briefly
Institutional BUY/SELL signal appears
Price reverses away from the zone
Entry:
Enter on the signal candle close
Or wait for next candle confirmation
Stop Loss:
Below the liquidity grab low (for buys)
Above the liquidity grab high (for sells)
Take Profit:
2:1 or 3:1 risk/reward ratio
Or next opposing liquidity zone
Example:
Price drops below support → Triggers stops →
Institutional BUY signal (4-5 strength) →
Enter LONG → Price rallies
Strategy 2: Trend Continuation
Setup:
Identify the trend (higher highs/higher lows for uptrend)
Wait for pullback to support in uptrend
Institutional BUY signal appears during pullback
Confirms institutions are adding to positions
Entry:
Enter on signal with strength ≥ 4
Or next candle after signal
Stop Loss:
Below the pullback low + small buffer
Take Profit:
Previous swing high
Or trailing stop using ATR
Strategy 3: Dark Pool Accumulation
Setup:
Dark Pool (DP) markers appear multiple times
Price consolidates in tight range
Institutional BUY signal with high strength appears
Breakout occurs
Entry:
Enter on breakout candle after signal
Or on retest of breakout level
Stop Loss:
Below consolidation range
Take Profit:
Measured move (height of consolidation projected)
Strategy 4: Divergence Play
Setup:
Price makes lower low
MFI/RSI makes higher low (bullish divergence)
Institutional BUY signal appears
Volume confirms with spike
Entry:
Enter on signal candle or next
Stop Loss:
Below the divergence low
Take Profit:
Previous swing high or resistance
6. Best Practices {#best-practices}
✅ DO's:
1. Use Multiple Timeframes
Check higher timeframe for trend direction
Trade signals that align with higher timeframe
Example: 15m signals in direction of 1H trend
2. Combine with Key Levels
Support/resistance
Supply/demand zones
Previous day high/low
Round numbers (psychological levels)
3. Wait for Confirmation
Don't rush into trades
Let the signal candle close
Watch next candle for follow-through
4. Check the Metrics Table
Look at Relative Volume (should be >2.0)
Check Delta % (should be strong positive/negative)
Verify Order Flow aligns with signal
5. Consider Market Context
News events can override signals
Low liquidity times (lunch, overnight) less reliable
Major economic releases need caution
6. Paper Trade First
Test the indicator for 2-4 weeks
Learn how it behaves on your chosen assets
Develop confidence before using real money
Best Times to Trade:
Stock Market Hours:
9:30-11:30 AM EST (high volume, strong moves)
2:00-4:00 PM EST (institutional positioning)
Avoid: 11:30 AM-2:00 PM (lunch, low volume)
Forex:
London Open: 3:00-6:00 AM EST
New York Open: 8:00-11:00 AM EST
London/NY Overlap: 8:00 AM-12:00 PM EST
Crypto:
24/7 market, but highest volume during US/European hours
Watch for weekend low liquidity
7. Common Mistakes to Avoid {#mistakes}
❌ DON'T:
1. Trade Every Signal
Not all signals are equal
Focus on strength 4-5 signals
Wait for optimal setups
2. Ignore Market Structure
Don't buy into strong downtrends (catch falling knife)
Don't sell into strong uptrends (fight the tape)
Respect major support/resistance
3. Use Too Small Timeframes
1m and 2m charts are too noisy
Minimum recommended: 5m for scalping
Better: 15m, 30m, 1H for reliability
4. Overtrade
Quality over quantity
2-5 good trades per day is excellent
Forcing trades leads to losses
5. Ignore Risk Management
Always use stop losses
Risk only 1-2% per trade
Don't revenge trade after losses
6. Trade During Low Volume
Signals less reliable with low volume
Check Relative Volume metric (should be >1.5)
Avoid pre-market/after-hours for stocks
7. Misread Liquidity Grabs
Not every wick is a liquidity grab
Need volume confirmation
Must have institutional signal
Advanced Tips:
Filtering False Signals:
Use Signal Strength Filter:
Minimum strength 3 = Balanced
Minimum strength 4 = Conservative (recommended)
Minimum strength 5 = Ultra conservative
Confluence Checklist:
Signal strength ≥ 4
Relative volume > 2.0
At key support/resistance
Aligns with higher timeframe trend
Delta % strongly positive/negative
Clean price action setup
If 4+ boxes checked = High probability trade
Setting Up Alerts:
Click the three dots on the indicator
Select "Create Alert"
Choose condition:
"Institutional Buy Signal"
"Institutional Sell Signal"
"Dark Pool Activity"
Set up notification (email, SMS, app)
Save alert
Alert Strategy:
Set minimum strength to 4 for fewer, better alerts
Use for assets you can't watch constantly
Don't rely solely on alerts - check chart context
Practice Exercise:
Week 1-2: Observation
Add indicator to your favorite assets
Watch how signals develop
Note which ones lead to profitable moves
Don't trade yet - just observe
Week 3-4: Paper Trading
Use TradingView's paper trading
Trade only strength 4-5 signals
Record results in a journal
Note: entry, exit, profit/loss, what worked/didn't
Week 5+: Small Live Positions
Start with smallest position size
Trade only your best setups
Gradually increase size as you gain confidence
Keep detailed journal
Quick Reference Card:
Signal Quality Ranking:
🔥 Best Setups (Take These):
Strength 5 + Liquidity grab + Key level
Strength 4-5 + Volume >3.0 + Trend alignment
Dark Pool markers + Strength 4+ signal
✅ Good Setups:
Strength 4 at support/resistance
Strength 3-4 with strong delta
Liquidity grab + Strength 3+
⚠️ Caution (Wait for More):
Strength 2-3 in middle of nowhere
Against higher timeframe trend
Low volume (Rel Vol <1.5)
❌ Avoid:
Strength 2 only
During major news
Low liquidity hours
Against strong trend
Troubleshooting:
"Too many signals"
→ Increase Minimum Signal Strength to 4
→ Increase Volume Spike Multiplier to 2.5-3.0
"Too few signals"
→ Decrease Minimum Signal Strength to 2-3
→ Decrease Volume Spike Multiplier to 1.5
"Signals not working"
→ Check if you're trading during low volume hours
→ Verify you're using recommended timeframes
→ Make sure signals align with market structure
"Can't see liquidity zones"
→ Enable "Show Liquidity Zones" in settings
→ Adjust Swing Detection Length (try 7-15)
Resources for Further Learning:
Concepts to Study:
Order Flow Trading
Market Profile / Volume Profile
Smart Money Concepts (SMC)
Liquidity Sweeps and Stop Hunts
Institutional Order Flow
Wyckoff Method
Volume Spread Analysis (VSA)
Recommended Practice:
Study past signals on chart
Replay market using TradingView's bar replay feature
Join trading communities to share setups
Keep a detailed trading journal
Final Thoughts:
This indicator is a tool, not a crystal ball. It identifies high-probability setups where institutions are active, but still requires:
Proper risk management
Market context understanding
Patience and discipline
Continuous learning
Success Formula:
Right Tool + Proper Training + Risk Management + Discipline = Consistent Profits
Start slow, master the basics, and gradually increase complexity as you gain experience.
Good luck and trade smart! 📊📈

LA - EMA Bands with MTF DashboardDetailed Explanation of the LA - EMA Bands with MTF Dashboard Indicator
This custom Pine Script v6 indicator, designed for Trading View, overlays EMA-based price channels on the chart while incorporating a multi-timeframe (MTF) dashboard for broader market context. It focuses on visualizing trend direction and momentum through three sets of EMA bands, each representing different time horizons, and extends this with a tabular dashboard that summarizes signals across user-selected timeframes. The bands help identify support, resistance, and trend shifts, while the dashboard provides at-a-glance alignment across multiple periods, aiding in confirming trades or spotting divergences. Unlike volatility-based channels (e.g., Bollinger or Keltner), it relies solely on EMAs for simplicity and lag-reduced responsiveness.
Inputs Section
The script begins with user-configurable options grouped for ease. A timeframe input allows specifying a resolution for the EMA bands' data fetching, defaulting to the chart's timeframe if left empty—this enables higher-timeframe overlays on lower charts for context.
Next, a shared source input defines the price data for all midlines, defaulting to the midpoint of high and low (hl2) but customizable to close, open, or others.
The EMA bands have dedicated toggles and length inputs for each of the three sets: the first (long-term) defaults to 144 periods, the second (medium-term) to 72, and the third (short-term) to 12. These are inlined for compact settings panels, with minimum lengths of 1 to prevent errors.
A boolean toggle controls the visibility of the MTF dashboard. Following this are nine pairs of inputs for dashboard timeframes: each pair includes a show/hide toggle and an editable timeframe string (e.g., '1' for 1-minute, 'D' for daily). Defaults progress from short (1, 3, 5 minutes) to longer (15, 30, 60 minutes, daily, weekly, monthly), grouped in inlines for organization. Only enabled and non-empty timeframes appear in the dashboard.
Helpers Section
Two utility functions are defined here. The first computes an EMA on any source series over a specified length using Trading View's built-in function, reused throughout for midlines and bands.
The second function generates a signal string ("B" for buy/bullish, "S" for sell/bearish, or "-" for neutral) based on the direction of an EMA applied to high prices. It compares the current EMA value to the previous one, mirroring the band fill logic for consistency in the dashboard.
Core Components per Band Set:
Midline: An EMA calculated on a user-selectable source price (default: hl2, which is the midpoint between high and low prices). This acts as the central trend line.
Upper Band: An EMA applied directly to the high prices of each bar.
Lower Band: An EMA applied to the low prices of each bar.
These form a channel that captures the smoothed range of price action, highlighting potential support (lower band), resistance (upper band), and overall trend direction (midline).
Multiple Band Sets: The indicator includes three independent EMA band sets, each with its own length parameter for customization:
EMA1 (default length: 144) – Focuses on long-term trends.
EMA2 (default length: 72) – Targets medium-term trends.
EMA3 (default length: 12) – Emphasizes short-term momentum.
Each set can be toggled on or off via input checkboxes, allowing users to reduce chart clutter if needed.
Visual Elements:
Midline Plot: Displayed as a line colored based on its direction compared to the previous bar: green for rising (bullish), red for falling (bearish), and black for neutral (flat).
Band Fill: The area between the upper and lower bands is filled with a semi-transparent color indicating the trend of the upper band: light green for rising (suggesting expanding highs/upward momentum) and light pink for falling (contracting highs/downward pressure). The bands themselves are plotted in blue with a thin linewidth.
Multi-Timeframe Support: Users can input a custom timeframe (e.g., 'D' for daily), and the indicator fetches data from that resolution. This enables higher-timeframe context on lower-timeframe charts, such as viewing daily EMA bands on a 1-hour chart.
Calculation Mechanics:
All EMAs are computed using Trading View's built-in ta.ema() function.
Data is retrieved in a single request.security() call for efficiency, with lookahead enabled to avoid repainting.
No multipliers or volatility adjustments are included, making it a simple EMA-based envelope rather than a true volatility channel.
In practice, this indicator helps traders identify trend strength, potential breakouts (price crossing bands), or mean-reversion opportunities (price bouncing within bands). It's particularly useful for swing or position trading where multi-period alignment (e.g., all midlines green) signals conviction.
Pros
Multi-Period Insight: By combining short (12), medium (72), and long (144) periods, it offers a layered view of trends across time horizons, helping confirm alignments or divergences without needing multiple separate indicators.
Visual Clarity: Color-coded trends and fills make it easy to spot bullish/bearish shifts at a glance, reducing analysis time.
Flexibility: Custom timeframe input allows for multi-timeframe analysis, while shared source and toggles provide user control.
Simplicity and Efficiency: Purely EMA-based, it's computationally light and avoids overcomplication, making it accessible for beginners while still useful for spotting channel-based setups like squeezes or expansions.
No Repainting: With lookahead, plots are stable once bars close.
Cons
Lagging Nature: EMAs inherently lag price action, especially longer ones like 144-period, which may cause delayed signals in fast-moving or ranging markets.
Lack of Volatility Adjustment: Unlike Keltner Channels or Bollinger Bands, it doesn't incorporate ATR or standard deviation, so bands may not accurately reflect true volatility—potentially leading to false breakouts in high-volatility environments.
Chart Clutter: Displaying all three band sets simultaneously can overcrowd the chart, particularly on lower timeframes or volatile assets.
Subjective Interpretation: Color changes and band interactions require trader discretion; there's no built-in alerting or quantitative signals, which might lead to inconsistent results.
Market Dependency: Defaults may not suit all assets (e.g., stocks vs. crypto); shorter periods like 12 could whipsaw in noisy markets, while 144 might be too slow for intraday trading.
Justification for Default Values (12, 72, and 144)
The default lengths of 12, 72, and 144 are not arbitrary but draw from established trading principles, particularly W.D. Gann's geometric and numerical theories, as well as Fibonacci sequences, to create a harmonic progression for short-, medium-, and long-term analysis. Here's the rationale:
12 (Short-Term): This is a common period for capturing recent momentum in technical indicators, often seen in setups like the MACD (which uses 12- and 26-day EMAs). It aligns with natural cycles, such as the 12 months in a year, and in Gann theory, 12 serves as a base unit for squaring price and time (e.g., in the "Square of 12" where multiples like 12, 24, etc., measure cycles in days, weeks, or months). At 12 periods, the EMA reacts quickly to price changes without excessive noise, making it ideal for short-term trend detection.
72 (Medium-Term): This acts as an intermediate bridge, derived from Gann's divisions of the 360-degree circle (a key Gann concept representing a full cycle). Specifically, 72 is 360/5 (relating to pentagonal geometry and natural harmonics) and appears in Gann's time cycle measurements (e.g., as a multiple in the Square of 12: 12×6=72). It's roughly half of 144, providing a balanced midpoint for medium-term trends without overlapping too closely with the others. In practice, 72 periods smooth out short-term fluctuations while still responding to developing trends.
144 (Long-Term): This is a powerhouse number in trading lore, being both 12 squared (12×12=144, central to Gann's "Square of 144" for monthly charts and major cycle turns, as there are 12 months in a year) and a Fibonacci sequence value (1, 1, 2, 3, 5, 8, 13, 21, 34, 55, 89, 144...). Fibonacci periods are popular in moving averages for their alignment with natural growth patterns in markets, and 144 is often used for long-term regime definition (e.g., confirming trends over 144 bars). It helps identify major support/resistance in extended cycles.
Overall, these values form a geometric/harmonic series (12, 72=12×6, 144=12×12), promoting alignment with market cycles as per Gann and Fibonacci principles, rather than generic lengths like 50 or 200. They can be adjusted based on the asset or timeframe, but the defaults provide a starting point rooted in time-tested trading numerology for balanced multi-period analysis.
Please use this along with other indicators (eg. Pivot, MACD, etc) for better results.

ULTIMATE Smart Trading Pro 🔥
## 🇬🇧 ENGLISH
### 📊 The Most Complete All-in-One Trading Indicator
**ULTIMATE Smart Trading Pro** combines the best technical analysis tools and Smart Money Concepts into a single powerful and intelligent indicator. Designed for serious traders who want a real edge in the markets.
---
### ✨ KEY FEATURES
#### 💰 **SMART MONEY CONCEPTS**
- **Order Blocks**: Automatically detects institutional zones where "smart money" enters positions
- **Break of Structure (BOS)**: Identifies structure breaks to confirm trend changes
- **Liquidity Zones**: Spots equal highs/lows areas where institutions hunt stops
- **Market Structure**: Visually displays bullish (green background) or bearish (red background) structure
#### 📈 **ADVANCED TECHNICAL INDICATORS**
- **RSI with Auto Divergences**: Classic RSI + automatic detection of bullish and bearish divergences
- **MACD with Signals**: Identifies bullish and bearish crossovers in real-time
- **Dynamic Support & Resistance**: Adaptive zones with intelligent scoring based on volume, multiple touches, and ATR
- **Fair Value Gaps (FVG)**: Detects unfilled price gaps (imbalance zones)
#### 📐 **AUTOMATIC TOOLS**
- **Auto Fibonacci**: Automatically calculates Fibonacci retracement levels on the last major trend
- **Pivot Points**: Daily, Weekly, or Monthly pivot points (PP, R1, R2, S1, S2)
- **Pattern Finder**: Automatically detects candlestick patterns (Hammer, Shooting Star, Engulfing, Morning/Evening Star) and chart patterns (Double Top/Bottom)
---
### 🎯 HOW TO USE IT
#### Quick Setup:
1. **Add the indicator** to your chart
2. **Open Settings** and enable/disable modules as needed
3. **Adjust parameters** for your trading style (scalping, swing, day trading)
#### Optimal Trading Setup:
🔥 **ULTRA STRONG Signal** when you have:
- An institutional **Order Block**
- Aligned with a **Support/Resistance** tested 3+ times
- An unfilled **FVG** nearby
- An **RSI divergence** confirming the reversal
- On a key **Fibonacci** level (50%, 61.8%, or 78.6%)
- Favorable market structure (green background for buys, red for sells)
---
### 💡 UNIQUE ADVANTAGES
✅ **Adaptive Intelligence**: Automatically adjusts to market volatility (ATR)
✅ **Volume Filters**: Validates important levels with volume confirmation
✅ **Multi-Timeframe Ready**: Works on all timeframes (1m to 1M)
✅ **Complete Alerts**: Notifications for all important signals
✅ **Clear Interface**: Emojis and colored labels for quick identification
✅ **Intelligent Scoring**: Levels ranked by importance (🔴🔴🔴 = very strong)
✅ **100% Customizable**: Enable only what you need
---
### 🎨 SYMBOL LEGEND
**Smart Money:**
- 🟢 OB = Bullish Order Block
- 🔴 OB = Bearish Order Block
- BOS ↑/↓ = Break of Structure
- 💧 LIQ = Liquidity Zone
**Candlestick Patterns:**
- 🔨 = Hammer (bullish signal)
- ⭐ = Shooting Star (bearish signal)
- 📈 = Bullish Engulfing
- 📉 = Bearish Engulfing
- 🌅 = Morning Star (bullish reversal)
- 🌆 = Evening Star (bearish reversal)
**Indicators:**
- 🚀 MACD ↑ = Bullish crossover
- 📉 MACD ↓ = Bearish crossover
- ⚠️ DIV = Bearish RSI divergence
- ✅ DIV = Bullish RSI divergence
**Support & Resistance:**
- 🟢/🔴 S1, R1 = Support/Resistance
- 🟢🟢🟢/🔴🔴🔴 = VERY strong level (3+ touches)
- (×N) = Number of times touched
---
### ⚙️ RECOMMENDED SETTINGS
**For Scalping (1m - 5m):**
- SR Lookback: 15
- Structure Strength: 3
- RSI: 14
- Volume Filter: ON
**For Day Trading (15m - 1H):**
- SR Lookback: 20
- Structure Strength: 5
- RSI: 14
- All filters: ON
**For Swing Trading (4H - Daily):**
- SR Lookback: 30
- Structure Strength: 7
- Pattern Lookback: 100
- Fibonacci: ON
---
### 🚨 DISCLAIMER
This indicator is a decision support tool. It does not guarantee profits and does not constitute financial advice. Always test on a demo account before real use. Trading involves significant risks.
---
## 📞 SUPPORT & UPDATES
For questions, suggestions, or bug reports, please comment below or contact the author.
**Version:** 1.0
**Last Updated:** October 2025
**Compatible:** TradingView Pine Script v6
---
### 🌟 If you find this indicator useful, please give it a 👍 and share it with other traders!
**Happy Trading! 🚀📈**

US Opening 5-Minute Candle HighlighterUS Opening 5-Minute Candle Highlighter — True RVOL (Two-Tier + Label)
What it does (in plain English)
This indicator finds the first 5-minute bar of the US cash session (09:30–09:35 ET) and highlights it when the candle has the specific “strong open” look you want:
Opens near the low of its own range, and
Closes near the high of its own range, and
Has a decisive real body (not a wick-y doji), and
(Optionally) is a green candle, and
Meets a TRUE opening-bar RVOL filter (compares today’s 09:30–09:35 volume only to prior sessions’ 09:30–09:35 volumes).
You get two visual intensities based on opening RVOL:
Tier-1 (≥ threshold 1, default 1.0×) → light green highlight + lime arrow
Tier-2 (≥ threshold 2, default 1.5×) → darker green highlight + green arrow
An RVOL label (e.g., RVOL 1.84x) can be shown above or below the opening bar.
Designed for 5-minute charts. On other timeframes the “opening bar” will be the bar that starts at 09:30 on that timeframe (e.g., 15-minute 09:30–09:45). For best results keep the chart on 5m.
How the pattern is defined
For the opening 5-minute bar, we compute:
Range = high − low
Body = |close − open|
Then we measure where the open and close sit within the bar’s own range on a 0→1 scale:
0 means exactly at the low
1 means exactly at the high
Using two quantiles:
Open ≤ position in range (0–1) (default 0.20)
Example: 0.20 means “open must be in the lowest 20% of the bar’s range.”
Close ≥ position in range (0–1) (default 0.80)
Example: 0.80 means “close must be in the top 20% of the bar’s range.”
This keeps the logic range-normalized so it adapts across different tickers and vol regimes (you’re not using fixed cents or % of price).
Body ≥ fraction of range (0–1) (default 0.55)
Requires the real body to be at least that fraction of the total range.
0.55 = body fills ≥ 55% of the candle.
Purpose: filter out indecisive, wick-heavy bars.
Raise to 0.7–0.8 for only the fattest thrusts; lower to 0.3–0.4 to admit more bars.
Require green candle? (default ON)
If ON, close > open must be true. Turn OFF if you also want to catch strong red opens for shorts.
Minimum range (ticks)
Ignore tiny, illiquid opens: e.g., set to 2–5 ticks to suppress micro bars.
TRUE Opening-Bar RVOL (why it’s “true”)
Most “RVOL” compares against any recent bars, which isn’t fair at the open.
This indicator calculates only against prior opening bars:
At 09:30–09:35 ET, take today’s opening 5-minute volume.
Compare it to the average of the last N sessions’ opening 5-minute volumes.
RVOL = today_open_volume / average_prior_open_volumes.
So:
1.0× = equal to average prior opens.
1.5× = 150% of average prior opens.
2.0× = double the typical opening participation.
A minimum prior samples guard (default 10) ensures you don’t judge with too little history. Until enough samples exist, the RVOL gate won’t pass (you can disable RVOL temporarily if needed).
Visuals & tiers
Light green highlight + lime arrow → price filters pass and RVOL ≥ Tier-1 (default 1.0×)
Dark green highlight + green arrow → price filters pass and RVOL ≥ Tier-2 (default 1.5×)
Optional bar paint in matching green tones for extra visibility.
Optional RVOL label (e.g., RVOL 1.84x) above or below the opening bar.
You can show the label only when the candle qualifies, or on every open.
Inputs (step-by-step)
Price-action filters
Open ≤ position in range (0–1): default 0.20. Smaller = stricter (must open nearer the low).
Close ≥ position in range (0–1): default 0.80. Larger = stricter (must close nearer the high).
Body ≥ fraction of range (0–1): default 0.55. Raise to demand a “fatter” body.
Require green candle?: default ON. Turn OFF to also mark bearish thrusts.
Minimum range (ticks): default 0. Set to 2–5 for liquid mid/large caps.
Time settings
Timezone: default America/New_York. Leave as is for US equities.
Start hour / minute: defaults 09:30. The bar that starts at this time is evaluated.
TRUE Opening-Bar RVOL (two-tier)
Require TRUE opening-bar RVOL?: ON = must pass Tier-1 to highlight; OFF = price filters alone can highlight (still shows Tier-2 when hit).
RVOL lookback (prior opens count): default 20. How many prior openings to average.
Min prior opens required: default 10. Warm-up guard.
Tier-1 RVOL threshold (× avg): default 1.00× (light green).
Tier-2 RVOL threshold (× avg): default 1.50× (dark green).
Display
Also paint candle body?: OFF by default. Turn ON for instant visibility on a chart wall.
Arrow size: tiny/small/normal/large.
Light/Dark opacity: tune highlight strength.
Show RVOL label?: ON/OFF.
Show label only when candle qualifies?: ON by default; OFF to see RVOL every open.
Label position: Above candle or Below candle.
Label size: tiny/small/normal/large.
How to use (quick start)
Apply to a 5-minute chart.
Keep defaults: Open ≤ 0.20, Close ≥ 0.80, Body ≥ 0.55, Require green ON.
Turn RVOL required ON, with Tier-1 = 1.0×, Tier-2 = 1.5×, Lookback = 20, Min prior = 10.
Optional: enable Paint bar and set Arrow size = large for monitor-wall visibility.
Optional: show RVOL label below the bar to keep wicks clean.
Interpretation:
Dark green = A+ opening thrust with strong participation (≥ Tier-2).
Light green = Valid opening thrust with at least average participation (≥ Tier-1).
No highlight = one or more filters failed (quantiles, body, green, range, or RVOL if required).
Alerts
Two alert conditions are included:
Opening 5m Match — Tier-2 RVOL → fires when the opening candle passes price filters and RVOL ≥ Tier-2.
Opening 5m Match — Tier-1 RVOL → fires when the opening candle passes price filters and RVOL ≥ Tier-1 (but < Tier-2).
Recommended alert settings
Condition: choose the script + desired tier.
Options: Once Per Bar Close (you want the confirmed 09:30–09:35 bar).
Set your watchlist to symbols of interest (themes/sectors) and let the alerts pull you to the right charts.
Recommended starting values
Quantiles: Open ≤ 0.20, Close ≥ 0.80
Body fraction: 0.55
Require green: ON
RVOL: Required ON, Tier-1 = 1.0×, Tier-2 = 1.5×, Lookback 20, Min prior 10
Display: Paint bar ON, Arrow large, Label ON, Below candle
Tune tighter for A-plus selectivity:
Open ≤ 0.15, Close ≥ 0.85, Body ≥ 0.65, Tier-2 2.0×.
Notes, tips & limitations
5-minute timeframe is the intended use. On higher TFs, the 09:30 bar spans more than 5 minutes; geometry may not reflect the first 5 minutes alone.
RTH only: The opening detection looks at the clock (09:30 ET). Pre-market bars are ignored for the signal and for RVOL history.
Warm-up period: Until you have Min prior opens required samples, the RVOL gate won’t pass. You can temporarily toggle RVOL off.
DST & timezone: Leave timezone on America/New_York for US equities. If you trade non-US exchanges, set the appropriate TZ and opening time.
Illiquid tickers: Use Minimum range (ticks) and require RVOL to reduce noise.
No strategy orders: This is a visual/alert tool. Combine with your execution and risk plan.
Why this is useful on multi-monitor setups
Instant pattern recognition: the two-shade green makes A vs A+ opens pop at a glance.
Adaptive thresholds: quantiles & body are within-bar, so it works across $5 and $500 names.
Fair volume test: TRUE opening RVOL avoids comparing to pre-market or midday bars.
Optional labels: glanceable RVOL x-value helps triage the strongest themes quickly.

Reversal Nexus Pro Suite — Smart Scalper/Swing Trader/Hybrid 📝 Description
The Reversal Suite (5–15m) is a dynamic price-action-driven indicator built for scalpers and intraday traders who want to catch high-probability reversals with precision.
This system combines SFP (Swing Failure Patterns), Volume Climax filters, EMA bias, and momentum confirmation logic — all customizable to match your personal trading style.
The default configuration is tuned for NASDAQ futures (NQ1!) and similar indices on 5–15-minute charts, but it can adapt seamlessly to crypto, forex, and equities.
⚙️ How It Works
The indicator looks for exhaustion points in price where:
Volume Climax confirms liquidity sweeps,
EMA bias determines directional filters (single or dual-EMA),
Reclaim and rejection mechanics confirm structure shifts,
Momentum thrust ensures strength on reversal confirmation.
Each setup requires multi-factor alignment to reduce noise and increase signal precision.
🧩 Default Custom Settings (Recommended Start)
Setting Value Description
Mode Custom Enables full manual control
Signals must align within N bars 6 Forces confluence across recent bars
TP1 / TP2 (R-Multiples) 1.5 / 2.5 Default reward zones
RSI Divergence Enabled Adds secondary reversal confirmation
Volume Climax Enabled Detects high-volume exhaustion
Vol SMA Length 21 Volume baseline calculation
Climax ≥ k × SMA 7 Strength multiplier for volume spikes
EMA Length 200 Trend bias reference
Bias Both Allows both long and short setups
Dual EMA Bias Enabled Uses fast (21) vs slow (100) bias tracking
Min Distance from EMA Bias 2.55% Filter to avoid signals too close to MAs
Reclaim Buffer After Sweep 0.22% Ensures valid break-and-reclaim setups
Max Bars for Retest 1 Tight retest condition
Momentum Thrust Confirm Enabled Ensures volume and price thrust
Body ≥ ATR -6 Controls candle thrust sizing
TR SMA Length 20 Measures dynamic volatility
Body ≥ k × TR-SMA -4.4 Confirms structure-based rejection
Opposite-Signal Exit Enabled Auto-clears opposite signals
Opposite Signal Window 5 bars Short-term conflict filter
Swing Lookback (SFP) 2 Finds recent liquidity highs/lows
Cooldown Bars After Signal 8 Prevents over-triggering
🟢 Inputs are fully adjustable, so traders can optimize for:
Scalping (lower EMA, smaller swing lookback)
Swing trading (higher EMA, larger retest window)
Aggressive vs conservative confirmations
🧭 Recommended Use
Works best on 5m–15m timeframes
Pair with VWAP or EMA cloud overlays for directional context
Use Trend Guard to align only with higher-timeframe trend
Ideal for indices, forex majors, and large-cap stocks
🚀 Highlights
✅ Smart confluence-based reversal detection
✅ Built-in retest and rejection logic
✅ Dual EMA and volume climax filters
✅ Customizable momentum thrust confirmation
✅ Optimized for scalpers and intraday swing traders
🧱 Suggested Layout
Chart type: Candlestick
Timeframe: 5m or 15m
Overlay: VWAP / EMA Cloud / ORB Zone
Optional filters: ATR Bands, Volume Profile (VPVR), Session Boxes
⚠️ Disclaimer
The Reversal Nexus Pro indicator is provided for educational and informational purposes only. It is not financial advice and should not be interpreted as a recommendation to buy, sell, or trade any financial instrument.
Trading involves significant risk and may not be suitable for all investors. Past performance does not guarantee future results. Always perform your own analysis and use proper risk management before placing any trades.
The author of this script is not responsible for any financial losses or decisions made based on the use of this tool.
By using this indicator, you acknowledge that you understand these terms and accept full responsibility for your own trading results.
© 2025. All rights reserved. Redistribution or resale of this indicator, in full or in part, is strictly prohibited without the author’s written consent.

CloudShiftCloudShift + Bollinger Bands
This version of CloudShift now includes fully optimized Bollinger Bands with all three dynamic lines:
Upper Band: Highlights expansion during volatility spikes.
Lower Band: Identifies compression and accumulation zones.
Centerline (Basis): A smooth reference of the moving average, providing better visual balance and directional context.
The bands are drawn with thin, clean lime lines, designed to integrate perfectly with the cloud logic — keeping your chart minimalist yet powerful.
This update enhances the CloudShift indicator by providing a clear visual framework of market volatility and structure without altering its original logic.
Recommended for use on: NASDAQ, S&P 500, and other high-volatility futures.
Recommended timeframe: 5–15 minutes.
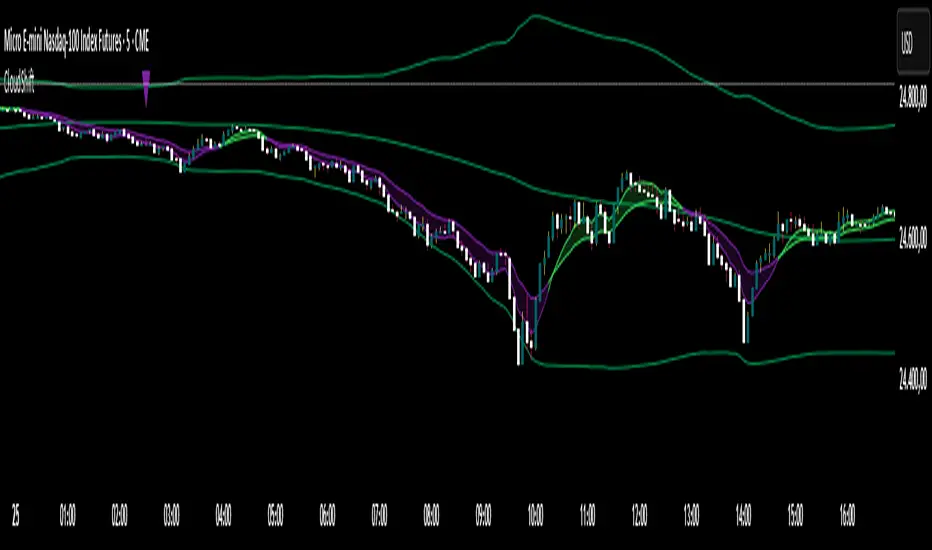
4H + 15m Sell Signals It shows sell positions on the 15 min based on 4 hour ,imbalance, order block and swing high and low frameworks.
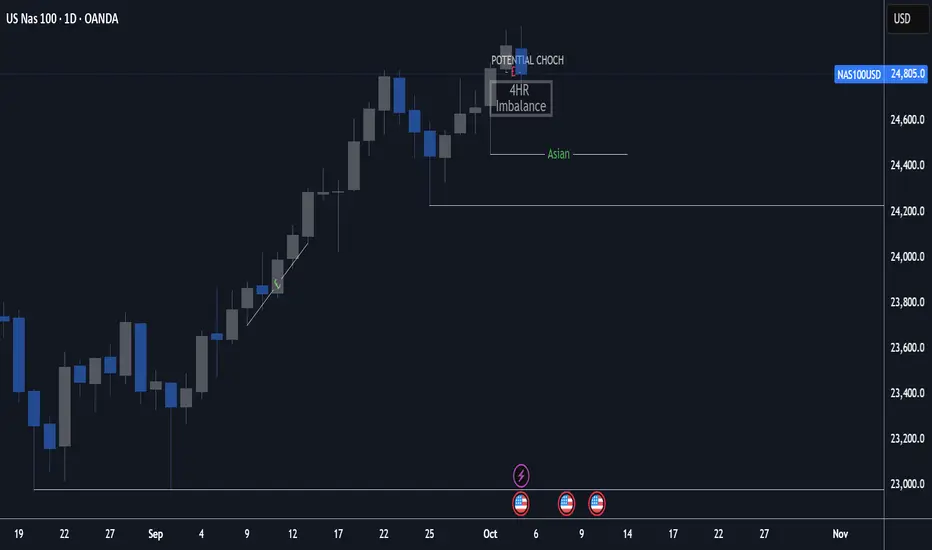
GEX Options Flow Pro 100% free
INTRODUCTION
This script is designed to visualize advanced options-derived metrics and levels on TradingView charts, including Gamma Exposure (GEX) walls, gamma flip points, vanna levels, delta-neutral prices (DEX), max pain, implied moves, and more. It overlays dynamic lines, labels, boxes, and an info table to highlight potential support, resistance, volatility regimes, and flow dynamics based on options data.
These visualizations aim to help users understand how options market structure might influence price action, such as areas of potential stability (positive GEX) or volatility (negative GEX). All data is user-provided via pasted strings, as Pine Script cannot fetch external options data directly due to platform limitations (detailed below).
The script is open-source under TradingView's terms, allowing study, modification, and improvement. It draws inspiration from standard options Greeks and exposure metrics (e.g., gamma, vanna, charm) discussed in financial literature like Black-Scholes models and dealer positioning analyses. No external code is copied; all logic is original or based on mathematical formulas.
Disclaimer: This is an educational tool only. It does not provide investment advice, trading signals, or guarantees of performance. Past data is not indicative of future results. Use at your own risk, and combine with your own analysis. Not intended for qualified investors only.
How the Options Levels Are Calculated
Levels are not computed in Pine Script—they rely on pre-calculated values from external tools (e.g., Python scripts using libraries like yfinance for options chains). Here's how they're typically derived externally before pasting into the script:
Fetching Options Data: Retrieve options chain for a ticker: strikes, open interest (OI), volume, implied volatility (IV), expirations (e.g., shortest: 0-7 DTE, short: 7-14 DTE, medium: ~30 DTE, long: ~90 DTE). Get current price and 5-day history for context.
Gamma Walls (Put/Call Walls): Compute gamma for each option using Black-Scholes: gamma = N'(d1) / (S * σ * √T) where S = spot price, K = strike, T = time to expiration (years), σ = IV, N'(d1) = normal PDF. Aggregate GEX at strikes: GEX = sign * gamma * OI * 100 * S^2 * 0.01 (per 1% move, with sign based on dealer positioning: typically short calls/puts = negative GEX). Put Wall: Highest absolute GEX put strike below S (support via dealer buying on dips). Call Wall: Highest absolute GEX call strike above S (resistance via dealer selling on rallies). Secondary/Tertiary: Next highest levels. Historical walls track tier-1 levels over 5 days.
Gamma Flip: Net GEX profile across prices: Sum GEX for all options at hypothetical spots. Flip point: Interpolated price where net GEX changes sign (stable above, volatile below).
Vanna Levels: Vanna = -N'(d1) * d2 / σ. Weighted by OI; highest positive/negative strikes.
DEX (Delta-Neutral Price): Net dealer delta: Sum (delta * OI * 100 * sign), with delta from Black-Scholes. DEX: Price where net delta = 0 (interpolated).
Max Pain: Strike minimizing total intrinsic value for all options holders.
Skew: 25-delta skew: IV difference between 25-delta put and call (interpolated).
Net GEX/Delta: Total signed GEX/delta at current S.
Implied Move: ATM IV * √(DTE/365) for 1σ range.
C/P Ratio: (Call OI + volume) / (Put OI + volume).
Smart Stop Loss: Below lowest support (e.g., Put Wall, gamma flip), buffered by IV * √(DTE/30).
Other Metrics: IV: ATM average. 5-day metrics: Avg volume, high/low.
External tools handle dealer assumptions (e.g., short calls/puts) and scaling (per % move).
Effect as Support and Resistance in Technical Trading
Options levels reflect dealer hedging dynamics:
Put Wall (Gamma Support): High put GEX creates buying pressure on dips (dealers hedge short puts by buying stock). Use for long entries, bounces, or stops below.
Call Wall (Gamma Resistance): High call GEX leads to selling on rallies. Good for trims, shorts, or reversals.
Gamma Flip: Pivot for volatility—above: dampened moves (positive GEX, mean reversion); below: amplified trends (negative GEX, momentum).
Vanna Levels: Sensitivity to IV changes; crosses may signal vol shifts.
DEX: Dealer delta neutral—bullish if price below with positive delta.
Max Pain: Price magnet minimizing option payouts.
Implied Move/Confidence Bands: Expected ranges (1σ/2σ/3σ); breakouts suggest extremes.
Liquidity Zones: Wall ranges as price magnets.
Smart Stop Loss: Protective level below supports, IV-adjusted.
C/P Ratio & Skew: Sentiment (high C/P = bullish; high skew = put demand).
Net GEX: Positive = low vol strategies (e.g., condors); negative = momentum trades.
Combine with TA (e.g., volume, trends). High activity strengthens effects; alerts on crosses/proximities for awareness.
Limitations of the TradingView Platform for Data Pulling
Pine Script is sandboxed:
No API calls or internet access (can't fetch options data directly).
Limited to chart/symbol data; no real-time chains.
Inputs static per load; manual updates needed.
Caching not persistent across sessions.
This ensures lightweight scripts but requires external data sourcing.
Creative Solution for On-Demand Data Pulling
Users can use external tools (e.g., Python scripts with yfinance) to fetch/compute data on demand. Generate a formatted string (ticker,timestamp|term1_data|term2_data|...), paste into inputs. Tools can process multiple tickers, cache for ~15-30 min, and output strings for quick portfolio scanning. Run locally or via custom setups for near-real-time updates without platform violations.
For convenience, a free bot is available on my website that accepts commands like !gex to generate both current data strings (for all expiration terms) and historical walls data on demand. This allows users to easily obtain fresh or cached data (refreshed every ~30 min) for pasting into the indicator—ideal for scanning portfolios without manual coding.
Script Functionality Breakdown
Inputs: Data strings (current/historical); term selector (Shortest/Short/Medium/Long); toggles (historical walls, GEX profile, secondaries, vanna, table, max pain, DEX, stop loss, implied move, liquidity, bands); colors/styles.
Parsing: Extracts term-specific data; validates ticker match; gets timestamp for freshness.
Drawing: Dynamic lines/labels (width/color by GEX strength); boxes (moves, zones, bands); clears on updates.
Info Table: Dashboard with status (freshness emoji), Greeks (GEX/delta with emojis), vol (IV/skew), levels (distances), flow (C/P, vol vs 5D).
Historical Walls: Displays past tier-1 walls on daily+ timeframes.
Alerts: 20+ conditions (e.g., near/cross walls, GEX sign change, high IV).
Performance: Efficient for real-time; smart label positioning.
Release Notes
Initial release: Full features including multi-term support, enhanced table with emojis/sentiment, dynamic visuals, smart stop loss.
Data String Format: TICKER,TIMESTAMP|TERM1_DATA|TERM2_DATA|TERM3_DATA|TERM4_DATA Where each TERM_DATA = val0,val1,...,val30 (31 floats: current_price, prev_close, call_wall_1, call_wall_1_gex, ..., low_5d). Historical: TICKER|TERM1_HIST|... where TERM_HIST = date:cw,pw;date:cw,pw;...
Feedback welcome in comments. Educational only—not advice.

FirstStrike Long 200 - Daily Trend Rider [KedArc Quant]Strategy Description
FirstStrike Long 200 is a disciplined, long-only momentum strategy designed for daily "strike-first" entries in trending markets. It scans for RSI momentum above a customizable trigger (default 50), confirmed by EMA trend filters, and limits you to *exactly one trade per day* to avoid overtrading. It uses ATR for dynamic risk management (1.5x stop, 2:1 RR target) and optional trailing stops to ride winners. Backtested with realistic commissions and sizing, it prioritizes low drawdowns (<1% max in tests) over aggressive gains—ideal for swing traders seeking quality setups in bull runs.
Why It's Different from Other Strategies
Unlike generic RSI crossover bots or EMA ribbon mashups that spam signals and bleed in chop, FirstStrike enforces a "one-and-done" daily gate, blending precision momentum (RSI modes with grace/sustain) with robust filters (volume, sessions, rearm dips).
How It Helps Traders
- Reduces Emotional Trading: One entry/day forces discipline—miss a setup? Wait for tomorrow. Perfect for busy pros avoiding screen fatigue.
- Adapts to Regimes: Switch modes for trends ("Cross+Grace") vs. ranges ("Any bar")—boosts win rates 5-10% in backtests on high-beta names like .
- Risk-First Design: ATR scales stops to vol capping DD at 0.2% while targeting 2R winners. Trailing option locks +3-5% runs without early exits.
- Quick Insights: Labels/alerts flag entries with RSI values; bgcolor highlights signals for visual scanning. Helps spot "first-strike" edges in uptrends, filtering ~60% noise.
Why This Is Not a Mashup
This isn't a Frankenstein of off-the-shelf indicators—while it uses standard RSI/EMA/ATR (core Pine primitives), the innovation lies in:
- Custom Trigger Engine: Switchable modes (e.g., "Cross+Grace+Sustain" requires post-cross hold) prevent perpetual signals, unlike basic `ta.crossover()`.
- Daily Rearm Gate: Resets eligibility only after a dip (if enabled), tying momentum to mean-reversion—original logic not found in common scripts.
- Per-Day Isolation: `var` vars + `ta.change(time("D"))` ensure zero pyramiding/overlaps, beyond simple session filters.
All formulae are derived in-house for "first-strike" (early RSI pops in trends), not copied from public repos.
Input Configurations
Let's break down every input in the FirstStrike Long 200 strategy. These settings let you tweak the strategy like a dashboard—start with defaults for quick testing,
then adjust based on your asset or timeframe (5m for intraday). They're grouped logically to keep things organized, and most have tooltips in the script for quick reminders.
RSI / Trigger Group: The Heart of Momentum Detection
This is where the magic starts—the strategy hunts for "upward energy" using RSI (Relative Strength Index), a tool that measures if a stock is overbought (too hot) or oversold (too cold) on a 0-100 scale.
- RSI Length: How many bars (candles) back to calculate RSI. Default is 14, like a 14-day window for daily charts. Shorter (e.g., 9) makes it snappier for fast markets; longer (21) smooths out noise but misses quick turns.
- Trigger Level (RSI >= this): The key RSI value where the strategy says, "Go time!" Default 50 means enter when RSI crosses or holds above the neutral midline. Why is this trigger required? It acts as your "green light" filter—without it, you'd enter on every tiny price wiggle, leading to endless losers. RSI above this shows building buyer power, avoiding weak or sideways moves. It's essential for quality over quantity, especially in one-trade-per-day setups.
- Trigger Mode: Picks how strict the RSI signal must be. Options: "Cross only" (exact RSI crossover above trigger—super precise, fewer trades); "Cross+Grace" (crossover or within a grace window after—gives a second chance); "Cross+Grace+Sustain" (crossover/grace plus RSI holding steady for bars—best for steady climbs); "Any bar >= trigger" (looser, any bar above—more opportunities but riskier in chop). Start with "Any bar" for trends, switch to "Cross only" for caution.
- Grace Window (bars after cross): If mode allows, how many bars post-RSI-cross you can still enter if RSI dips but recovers. Default 30 (about 2.5 hours on 5m). Zero means no wiggle room—pure precision.
- Sustain Bars (RSI >= trigger): In sustain mode, how many straight bars RSI must stay above trigger. Default 3 ensures it's not a fluke spike.
- Require RSI Dip Below Rearm Before Any Entry?: A yes/no toggle. If on, the strategy "rearms" only after RSI dips below a low level (like a breather), preventing back-to-back signals in overextended rallies.
- Rearm Level (if requireDip=true): The dip threshold for rearming. Default 45—RSI must go below this to reset eligibility. Lower (30) for deeper pullbacks in volatile stocks.
For the trigger level itself, presets matter a lot—default 50 is neutral and versatile for broad trends. Bump to 55-60 for "strong momentum only" (fewer but higher-win trades, great in bull runs like tech surges); drop to 40-45 for "early bird" catches in recoveries (more signals but watch for fakes in ranges). The optimize hint (40-60) lets you test these in TradingView to match your risk—higher presets cut noise by 20-30% in backtests.
Trend / Filters Group: Keeping You on the Right Side of the Market
These EMAs (Exponential Moving Averages) act like guardrails, ensuring you only long in uptrends.
- EMA (Fast) Confirmation: Short-term EMA for price action. Default 20 periods—price must be above this for "recent strength." Shorter (10) reacts faster to intraday pops.
- EMA (Trend Filter): Long-term EMA for big-picture trend. Default 200 (classic "above the 200-day" rule)—price above it confirms bull market. Minimum 50 to avoid over-smoothing.
Optional Hour Window Group: Timing Your Strikes
Avoid bad hours like lunch lulls or after-hours tricks.
- Restrict by Session?: Yes/no for using exact market hours. Default off.
- Session (e.g., 0930-1600 for NYSE): Time string like "0930-1600" for open to close. Auto-skips pre/post-market noise.
- Restrict by Hour Range?: Fallback yes/no for simple hours. Default off.
- Start Hour / End Hour: Clock times (0-23). Defaults 9-15 ET—focus on peak volume.
Volume Filter Group: No Volume, No Party
Confirms conviction—big moves need big participation.
- Require Volume > SMA?: Yes/no toggle. Default off—only fires on above-average volume.
- Volume SMA Length: Periods for the average. Default 20—compares current bar to recent norm.
Risk / Exits Group: Protecting and Profiting Smartly
Dynamic stops based on volatility (ATR = Average True Range) keep things realistic.
- ATR Length: Bars for ATR calc. Default 14—measures recent "wiggle room" in price.
- ATR Stop Multiplier: How far below entry for stop-loss. Default 1.5x ATR—gives breathing space without huge risk
- Take-Profit R Multiple: Reward target as multiple of risk. Default 2.0 (2:1 ratio)—aims for twice your stop distance.
- Use Trailing Stop?: Yes/no for profit-locking trail. Default off—activates after entry.
- Trailing ATR Multiplier: Trail distance. Default 2.0x ATR—looser than initial stop to let winners run.
These inputs make the strategy plug-and-play: Defaults work out-of-box for trending stocks, but tweak RSI trigger/modes first for your style.
Always backtest changes—small shifts can flip a 40% win rate to 50%+!
Outputs (Visuals & Alerts):
- Plots: Blue EMA200 (trend line), Orange EMA20 (price filter), Green dashed entry price.
- Labels: Green "LONG" arrow with RSI value on entries.
- Background: Light green highlight on signal bars.
- Alerts: "FirstStrike Long Entry" fires on conditions (integrates with TradingView notifications).
Entry-Exit Logic
Entry (Long Only, One Per Day):
1. Daily Reset: New day clears trade gate and (if required) rearm status.
2. Filters Pass: Time/session OK + Close > EMA200 (trend) + Close > EMA20 (price) + Volume > SMA (if enabled) + Rearmed (dip below rearm if toggled).
3. Trigger Fires: RSI >= trigger via selected mode (e.g., crossover + grace window).
4. Execute: Enter long at close; set daily flag to block repeats.
Exit:
- Stop-Loss: Entry - (ATR * 1.5) – dynamic, vol-scaled.
- Take-Profit: Entry + (Risk * 2.0) – fixed RR.
- Trailing (Optional): Activates post-entry; trails at Close - (ATR * 2.0), updating on each bar for trend extension.
No shorts or hedging—pure long bias.
Formulae Used
- RSI: `ta.rsi(close, rsiLen)` – Standard 14-period momentum oscillator (0-100).
- EMAs: `ta.ema(close, len)` – Exponential moving averages for trend/price filters.
- ATR: `ta.atr(atrLen)` – True range average for stop sizing: Stop = Entry - (ATR * mult).
- Volume SMA: `ta.sma(volume, volLen)` – Simple average for relative strength filter.
- Grace Window: `bar_index - lastCrossBarIndex <= graceBars` – Counts bars since RSI crossover.
- Sustain: `ta.barssince(rsi < trigger) >= sustainBars` – Consecutive bars above threshold.
- Session Check: `time(timeframe.period, sessionStr) != 0` – TradingView's built-in session validator.
- Risk Distance: `riskPS = entry - stop; TP = entry + (riskPS * RR)` – Asymmetric reward calc.
FAQ
Q: Why only one trade/day?
A: Prevents revenge trading in volatile sessions . Backtests show it cuts losers by 20-30% vs. multi-entry bots.
Q: Does it work on all assets/timeframes?
A: Best for trending stocks/indices on 5m-1H. Test on crypto/forex with wider ATR mult (2.0+).
Q: How to optimize?
A: Use TradingView's optimizer on RSI trigger (40-60) and EMA fast (10-30). Aim for PF >1.0 over 1Y data.
Q: Alerts don't fire—why?
A: Ensure `alertcondition` is enabled in script settings. Test with "Any alert() function calls only."
Q: Trailing stop too loose?
A: Tune `trailMult` to 1.5 for tighter; it activates alongside fixed TP/SL for hybrid protection.
Glossary
- Grace Window: Post-RSI-cross period (bars) where entry still allowed if RSI holds trigger.
- Rearm Dip: Optional pullback below a low RSI level (e.g., 45) to "reset" eligibility after signals.
- Profit Factor (PF): Gross profit / gross loss—>1.0 means winners outweigh losers.
- R Multiple: Risk units (e.g., 2R = 2x stop distance as target).
- Sustain Bars: Consecutive bars RSI stays >= trigger for mode confirmation.
Recommendations
- Backtest First: Run on your symbols (/) over 6-12M; tweak RSI to 55 for +5% win rate.
- Live Use: Start paper trading with `useSession=true` and `useVol=true` to filter noise.
- Pairs Well With: Higher TF (daily) for bias; add ADX (>25) filter for strong trends (code snippet in prior chats).
- Risk Note: 10% sizing suits $100k+ accounts; scale down for smaller. Not financial advice—past performance ≠ future.
- Publish Tip: Add tags like "momentum," "RSI," "long-only" on TradingView for visibility.
Strategy Properties & Backtesting Setup
FirstStrike Long 200 is configured with conservative, realistic backtesting parameters to ensure reliable performance simulations. These settings prioritize capital preservation and transparency, making it suitable for both novice and experienced traders testing on stocks.
Initial Capital
$100,000 Standard starting equity for portfolio-level testing; scales well for retail accounts. Adjust lower (e.g., $10k) for smaller simulations.
Base Currency
Default (USD) Aligns with most US equities (e.g., NASDAQ symbols); auto-converts for other assets.
Order Size
1 (Quantity) Fixed share contracts for simplicity—e.g., buys 1 share per trade. For % of equity, switch to "Percent of Equity" in strategy code.
Pyramiding
0 Orders No additional entries on open positions; enforces strict one-trade-per-day discipline to avoid overexposure.
Commission
0.1% Realistic broker fee (e.g., Interactive Brokers tier); factors in round-trip costs without over-penalizing winners.
Verify Price for Limit Orders
0 Ticks No slippage delay on TPs—assumes ideal fills for historical accuracy.
Slippage
0 Ticks Zero assumed slippage for clean backtests; real-world trading may add 1-2 ticks on volatile opens.
These defaults yield low drawdowns (<0.3% max in tests) while capturing trend edges. For live trading, enable slippage (1-3 ticks) to mimic execution gaps. Always forward-test before deploying!
⚠️ Disclaimer
This script is provided for educational purposes only.
Past performance does not guarantee future results.
Trading involves risk, and users should exercise caution and use proper risk management when applying this strategy.

Multi-Time Frame Momentum PredictorFifteen-minute candle forming:
- Minute 1-15: Analyze one-minute candles
- Minute 14:30: Evaluate conditions
- Minute 14:45: Make decision
- Minute 14:59: Execute order if criteria are met

3/4-Bar GRG / RGR Pattern (Conditional 4th Candle)This indicator can be used to identify the Green-Red-Green or Red-Green-Red pattern.
It is a price action indicator where a price action which identifies the defeat of buyers and sellers.
If the buyers comprehensively defeat the sellers then the price moves up and if the sellers defeat the buyers then the price moves down.
In my trading experience this is what defines the price movement.
It is a 3 or 4 candle pattern, beyond that i.e, 5 or more candles could mean a very sideways market and unnecessary signal generation.
How does it work?
Upside/Green signal
Say candle 1 is Green, which means buyers stepped in, then candle 2 is Red or a Doji, that means sellers brought the price down. Then if candle 3 is forming to be Green and breaks the closing of the 1st candle and opening of the 2nd candle, then a green arrow will appear and that is the place where you want to take your trade.
Here the buyers defeated the sellers.
Sometimes candle 3 falls short but candle 4 breaks candle 1's closing and candle 2's opening price. We can enter on candle 4.
Important - We need to enter the trade as soon as the price moves above the candle 1 and 2's body and should not wait for the 3rd or 4th candle to close. Ignore wicks.
I have restricted it to 4 candles and that is all that is needed. More than that is a longer sideways market.
I call it the +-+ or GRG pattern.
Stop loss can be candle 2's mid for safe traders (that includes me) or candle 2's body low for risky traders.
Back testing suggests that body low will be useless and result in more points in loss because for the bigger move this point will not be touched, so why not get out faster.
Downside/Red signal
Say candle 1 is Red, which means sellers stepped in, then candle 2 is Green or a Doji, that means buyers took the price up. Then if candle 3 is forming to be Red and breaks the closing of the 1st candle and opening of the 2nd candle then a Red arrow will appear and that is the place where you want to take your trade.
Sometimes candle 3 falls short but candle 4 breaks candle 1's closing and candle 2's opening price. We can enter on candle 4.
We need to enter the trade as soon as the price moves below the candle 1 and 2's body and should not wait for the 3rd or 4th candle to close.
I have restricted it to 4 candles and that is all that is needed. More than that is a longer sideways market.
I call it the -+- or RGR pattern.
Stop loss can be candle 2's mid for safe traders ( that includes me) or candle 2's body high for risky traders.
Back testing suggests that body high will be useless and result in more points in loss because for the bigger move this point will not be touched, so why not get out faster.
Important Settings
You can enable or disable the 4th candle signal to avoid the noise, but at times I have noticed that the 4th candle gives a very strong signal or I can say that the strong signal falls on the 4th candle. This is mostly a coincidence.
You can also configure how many previous bars should the signal be generated for. 10 to 30 is good enough. To backtest increase it to 2000 or 5000 for example.
Rest are self explanatory.
Pointers
If after taking the trade, the next candle moves in your direction and closes strong bullish or bearish, then move SL to break even and after that you can trail it.
If a upside trade hits SL and immediately a down side trade signal is generated on the next candle then take it. Vice versa is true.
Trades need to be taken on previous 2 candle's body high or low combined and not the wicks.
The most losses a trader takes is on a sideways day and because in our strategy the stop loss is so small that even on a sideways day we'll get out with a little profit or worst break even.
Hold targets for longer targets and don't panic.
If last 3-4 days have been sideways then there is a good probability that day will be trending so we can hold our trade for longer targets. Target to hold the trade for whole day and not exit till the day closes.
In general avoid trading in the middle of the day for index and stocks. Divide the day into 3 parts and avoid the middle.
Use Support/Resistance, 10, 20, 50, 200 EMA/SMA, Gaps, Whole/Round numbers(very imp) for identifying targets.
Trail your SL.
For indexes I would use 5 min and 15 min timeframe.
For commodities and crypto we can use higher timeframe as well. Look for signals during volatile time durations and avoid trading the whole day. Signal usually gives good targets on those times.
If a GRG or RGR pattern appears on a daily timeframe then this is our time to go big.
Minimum Risk to Reward should be 1:2 and for longer targets can be 1:4 to 1:10.
Trade with small lot size. Money management will happen automatically.
With small lot size and correct Risk-Re ward we can be very profitable. Don't trade with big lot size.
Stay in the market for longer and collect points not money.
Very imp - Watch market and learn to generate a market view.
Very imp - Only 4 candles are needed in trading - strong bullish, strong bearish, hammer, inverse hammer and doji.
Go big on bearish days for option traders. Puts are better bought and Calls are better sold.
Cluster of green signals can lead to bigger move on the upside and vice versa for red signals.
Most of this is what I learned from successful traders (from the top 2%) only the indicator is mine.

Crypto Scalping Strategy - High Win Rategrok first try. I used grok to create a scalping strategy that is automated for crypto scalp trading on 5-15 min intervals
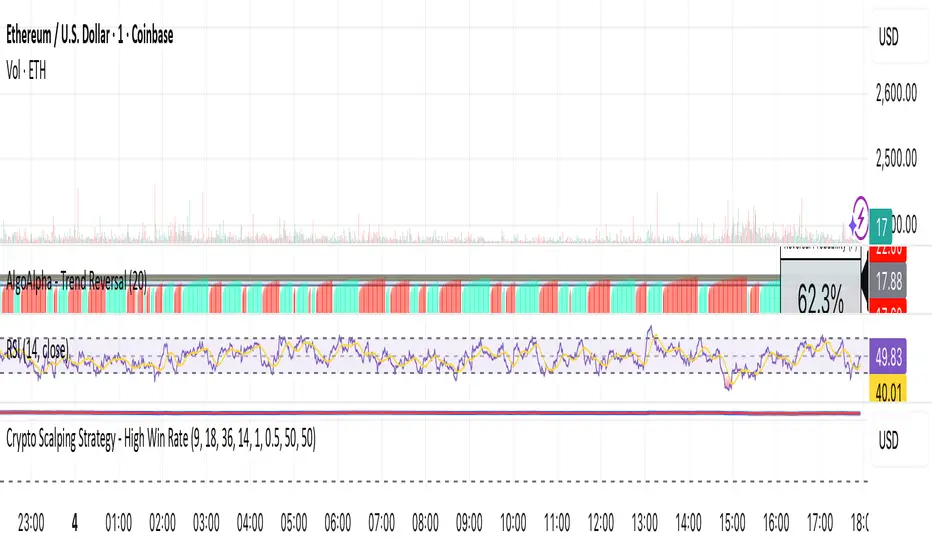
High Time Frame (HTF) Swing PointsIdentify and display swing highs and lows across multiple higher timeframes on a chart, overlaying horizontal lines and customizable labels at these swing points.
Timeframes
Five user-defined higher timeframes (default settings: 5-minute, 15-minute, 1-hour, 4-hour, and daily)
Manually show/hide individual timeframes
When chart’s timeframe is set higher than one of the five configured, the indicator will automatically hide it. This helps to prevent clutter when navigating between timeframes on the chart
Swing Levels
Configure the line color, opacity, width and weather it’s solid/dotted/dashed
Once swing levels are identified, the indicator will look for the chart candle where the line starts
When price crosses the swing level, the line will be terminated
Tags
Customize the tag text for each individual timeframe, using blank if a tag is not desired for that timeframe
A tag text color can be set for all tags or base it on the line color
Set tag text size based on: Auto, Tiny, Small, Normal, Large
Choose how far to the right of the line the tag text should appear, as an integer representing the size of a candle
Choose to clear the tag or leave it in place after price crosses a swing level
Use Cases
Visualize key swing points from higher timeframes to identify potential reversal or breakout zones
Identify possible low resistance liquidity run (LRLR) areas
Use swing points for stop placement or as targets or draws on liquidity

DAMMU Buy vs Sell Liquidity + DifferenceIndicator Name:
Buy vs Sell Liquidity + Difference
Purpose:
This indicator helps traders analyze market liquidity by comparing the cumulative buy and sell volumes within a specified timeframe. It shows which side (buyers or sellers) is dominating and the magnitude of the imbalance.
Key Features:
Aggregation Timeframe:
Users can select the timeframe (1, 2, 3, 5, 15, 30 minutes) for which volume is analyzed.
Buy & Sell Volume Calculation:
Buy Volume: Total volume of candles where close > open.
Sell Volume: Total volume of candles where close < open.
Daily Reset:
Totals reset at the start of each new day, ensuring intra-day liquidity analysis.
Difference Calculation:
Shows the absolute difference between buy and sell volumes.
Also calculates the difference as a percentage of total volume.
Percentages:
Displays buy %, sell %, and diff % to 4 decimal places, giving precise insights.
Table Display:
A two-row table in the top-right corner of the chart:
Row 1: Absolute totals for BUY, SELL, and DIFF (full numbers with commas).
Row 2: Percentages for BUY, SELL, and DIFF (4 decimals).
Uses color coding: Green for BUY, Red for SELL, Dynamic for DIFF (based on dominance).
How to Use:
High Buy Volume: Indicates strong buying pressure; bullish sentiment.
High Sell Volume: Indicates strong selling pressure; bearish sentiment.
Large DIFF %: Signals dominant market side; useful for short-term scalping or spotting liquidity imbalance.
Comparing BUY vs SELL %: Helps identify when the market may reverse or continue the trend.
If you want, I can also make a 1-paragraph “trader-friendly” explanation that you could directly include in your Pine Script as a comment or in a strategy guide.

Trend RiderTrend Rider is an all-in-one trading tool that helps you catch reversals, confirm trends, and spot key market levels with precision. It blends EMA clouds, volume filters, Bollinger Bands, swing levels, and session ranges into one streamlined system.
What makes Trend Rider powerful
• Dual EMA Clouds – clearly show short-term vs. long-term trend direction.
• Buy/Sell Signals – triggered on EMA crossovers, confirmed by volume strength.
• BB Reversal Mode – filters trades with Bollinger volatility and proximity to band extremes.
• Swing Levels – auto-plot important Highs/Lows as dynamic support and resistance.
• Session Ranges – highlight U.S. session and weekend boxes to track liquidity and gaps.
• Timeframe Guard – optimized exclusively for the 15-minute chart for higher accuracy.
• Alerts – every signal can fire TradingView notifications on bar close for higher reliability.
Core Value
Instead of stacking multiple tools, Trend Rider merges everything into one: trend confirmation, volume analysis, volatility filters, and key levels. The result is cleaner charts, sharper signals, and faster decisions.
Сreated with vibecoding using ChatGPT and Claude.

Multi-Timeframe MACD with Color Mix (Nikko)Multi-Timeframe MACD with Color Mix (Nikko) Indicator
This documentation explains the benefits of the "Multi-Timeframe MACD with Color Mix (Nikko)" indicator for traders and provides easy-to-follow steps on how to use it. Written as of 05:06 AM +07 on Saturday, October 04, 2025, this guide focuses on helping you, as a trader, get the most out of this tool with clear, practical advice before diving into the technical details.
Benefits for Traders
1. Multi-Timeframe Insight
This indicator lets you see momentum trends across 15-minute, 1-hour, 1-day, and 1-week timeframes all on one chart. This big-picture view helps you catch both quick market moves and long-term trends without flipping between charts, saving you time and giving you a fuller understanding of the market.
2. Visual Momentum Representation
The background changes from red to green based on short-term (15m) momentum, giving you a quick, easy-to-see signal—red means bearish (prices might drop), and green means bullish (prices might rise). The histogram uses a mix of red, green, and blue colors to show the combined strength of the 1-hour, 1-day, and 1-week timeframes, helping you spot strong trends at a glance (e.g., a bright mix for strong momentum, darker for weaker).
3. Enhanced Decision-Making
The background and histogram colors work together to confirm trends across different timeframes, making it less likely you’ll act on a false signal. This helps you feel more confident when deciding when to buy, sell, or hold.
4. Proactive Alert System
You can set alerts to notify you when the percentage of bullish timeframes hits your chosen levels (e.g., below 10% for bearish, above 90% for bullish). This keeps you in the loop on big momentum shifts without needing to watch the chart all day—perfect for when you’re busy.
5. Flexibility and Efficiency
You can turn timeframes on or off, adjust settings like speed of the moving averages, and tweak transparency to fit your trading style—whether you’re a fast scalper or a patient swing trader. Everything is shown on one chart, saving you effort, and the colors make it simple to read, even if you’re new to trading.
How to Use It
Getting Started
Add the Indicator: Load the "Multi-Timeframe MACD with Color Mix (Nikko)" onto your TradingView chart using the Pine Script editor or indicator library.
Pick Your Timeframes: Turn on the timeframes that match your trading—use 15m and 1h for quick trades, or 1d and 1w for longer holds—using the enable_15m, enable_1h, enable_1d, enable_1w, and enable_background options.
Reading the Colors
Background Gradient: Watch for red to signal bearish 15m momentum and green for bullish momentum. Adjust the Background_transparency (default 75%, or 25% opacity) if the chart feels too busy—try lowering it to 50 for clearer candlesticks in fast markets.
Histogram and EMA Colors:
The histogram and its Exponential Moving Average (EMA) line show a mix of red (1-week), green (1-day), and blue (1-hour) based on how strong the momentum is in each timeframe.
Brighter colors mean stronger momentum—white (all bright) shows all timeframes are pushing up hard, while darker shades (like gray or black) mean weaker or mixed momentum.
Turn off a timeframe (e.g., enable_1h = false) to see how it changes the color mix and focus on what matters to you.
Setting Alerts
Set Your Levels: Choose a threshold_low (default 10%) and threshold_high (default 90%) based on your comfort zone or past market patterns to catch big turns.
Get Notifications: Use TradingView alerts to get pings when the market hits your set levels, so you can act without staring at the screen.
Practical Tips
Pair with Other Tools: Use it with support/resistance lines or the RSI to double-check your moves and build a solid plan.
Tweak Settings: Adjust fast_length, slow_length, and signal_smoothing to match your asset’s speed, and bump up the lookback (default 50) for steadier trends in wild markets.
Practice First: Test different timeframe combos on a demo account to find what works best for you.
Understanding the Colors (Simple Explanation)
How Colors Work
The histogram and its EMA line use a color mix based on a simple idea from color theory, like mixing paints with red, green, and blue (RGB):
Red comes from the 1-week timeframe, green from 1-day, and blue from 1-hour.
When all three timeframes show strong upward momentum, they blend into bright white—the brightest color, like a super-bright light telling you the market’s roaring up.
If some timeframes are weak or pulling down, the mix gets darker (like gray or black), warning you the momentum might not be solid.
Brighter is Better
Bright Colors = Strong Opportunity: The brighter the histogram and EMA (closer to white), the more all your chosen timeframes are in agreement that prices are rising. This is your signal to think about buying or holding, as it points to a powerful trend you can ride.
Dark Colors = Caution: A darker mix (toward black) means some timeframes are lagging or bearish, suggesting you might wait or consider selling. It’s like a dim light saying, “Hold on, check again.”
Benefit in Practice: Watching the brightness helps you jump on the best trades fast. For example, a bright white histogram on a green background is like a green traffic light—go for it! A dark gray on red is like a red light—pause and rethink. This quick color check can save you from bad moves and boost your profits when the trend is strong.
Why It Helps
These colors are your fast friend in trading. A bright histogram means all your timeframes are cheering for an uptrend, giving you the confidence to act. A dull one tells you to be careful, helping you avoid traps. It’s like having a color-coded guide to pick the hottest market moments!
Technical Details
Input Parameters
Fast Length (default: 12): Short-term moving average speed.
Slow Length (default: 26): Long-term moving average speed.
Source (default: close): Price data used.
Signal Smoothing (default: 9): Smooths the signal line.
MA Type (default: EMA): Choose EMA or SMA.
Timeframe and Scaling
Timeframes: 15m, 1h, 1d, 1w, with on/off switches.
Lookback Period (default: 50): Sets the data window for trends.
Background Transparency (default: 75%): Controls background see-through level.
MACD Calculation
Per Timeframe: Uses request.security():
MACD Line: ta.ema(src, fast_length) - ta.ema(src, slow_length).
Signal Line: ta.ema(MACD, signal_length).
Histogram: (macd - signal) / 3.0.
Background Gradient
15m Normalization: norm_value = (hist_15m - hist_15m_min) / max(hist_15m_range, 1e-10), limited to 0-1.
RGB Mix: Red drops from 255 to 0, green rises from 0 to 255, blue stays 0.
Apply: color.new(color.rgb(r_val, g_val, b_val), Background_transparency).
Histogram and EMA Colors
Color Assignment:
1h: Blue (#0000FF) if hist_1h >= 0, else black.
1d: Green (#00FF00) if hist_1d >= 0, else black.
1w: Red (#FF0000) if hist_1w >= 0, else black.
Final Color: final_color = color.rgb(min(r, 255), min(g, 255), min(b, 255)).
Plotting: Histogram and EMA use final_color; MACD (#2962FF), signal (#FF6D00).
Alerts
Bullish Percentage: bullish_pct = (bullish_count / bullish_total) * 100, counting hist >= 0.
Triggers: Below threshold_low or above threshold_high.
--------------------------------------------------------------------
Conclusion
The "Multi-Timeframe MACD with Color Mix (Nikko)" is your all-in-one tool to spot trends, confirm moves, and trade smarter with its bright, easy-to-read colors. By using it wisely, you can sharpen your market edge and trade with more confidence.
This README is tailored for traders and reflects the indicator's practical value as of 05:06 AM +07 on October 04, 2025.

Smart Money Concept v1Smart Money Concept Indicator – Visual Interpretation Guide
What Happens When Liquidity Lines Are Broken
🟩 Green Line Broken (Buy-Side Liquidity Pool Swept)
- Indicates price has dipped below a previous swing low where sell stops are likely placed.
- Market Makers may be triggering these stops to accumulate long positions.
- Often followed by a bullish reversal.
- Trader Actions:
• Look for a bullish candle close after the sweep.
• Confirm with nearby Bullish Order Block or Fair Value Gap.
• Consider entering a Buy trade (SLH entry).
- If price continues falling: Indicates trend continuation and invalidation of the buy-side liquidity zone.
🟥 Red Line Broken (Sell-Side Liquidity Pool Swept)
- Indicates price has moved above a previous swing high where buy stops are likely placed.
- Market Makers may be triggering these stops to accumulate short positions.
- Often followed by a bearish reversal.
- Trader Actions:
• Look for a bearish candle close after the sweep.
• Confirm with nearby Bearish Order Block or Fair Value Gap.
• Consider entering a Sell trade (SLH entry).
- If price continues rising: Indicates trend continuation and invalidation of the sell-side liquidity zone.
Chart-Based Interpretation of Green Line Breaks
In the provided DOGE/USD 15-minute chart image:
- Green lines represent buy-side liquidity zones.
- If these lines are broken:
• It may be a stop hunt before a bullish continuation.
• Or a false Break of Structure (BOS) leading to deeper retracement.
- Confirmation is needed from candle structure and nearby OB/FVG zones.
Is the Pink Zone a Valid Bullish Order Block?
To validate the pink zone as a Bullish OB:
- It should be formed by a strong down-close candle followed by a bullish move.
- Price should have rallied from this zone previously.
- If price is now retesting it and showing bullish reaction, it confirms validity.
- If formed during low volume or price never rallied from it, it may not be valid.
Smart Money Concept - Liquidity Line Breaks Explained
This document explains how traders should interpret the breaking of green (buy-side) and red (sell-side) liquidity lines when using the Smart Money Concept indicator. These lines represent key liquidity pools where stop orders are likely placed.
🟩 Green Line Broken (Buy-Side Liquidity Pool Swept)
When the green line is broken, it indicates:
• - Price has dipped below a previous swing low where sell stops were likely placed.
• - Market Makers have triggered those stops to accumulate long positions.
• - This is often followed by a bullish reversal.
Trader Actions:
• - Look for a bullish candle close after the sweep.
• - Confirm with a nearby Bullish Order Block or Fair Value Gap.
• - Consider entering a Buy trade (SLH entry).
🟥 Red Line Broken (Sell-Side Liquidity Pool Swept)
When the red line is broken, it indicates:
• - Price has moved above a previous swing high where buy stops were likely placed.
• - Market Makers have triggered those stops to accumulate short positions.
• - This is often followed by a bearish reversal.
Trader Actions:
• - Look for a bearish candle close after the sweep.
• - Confirm with a nearby Bearish Order Block or Fair Value Gap.
• - Consider entering a Sell trade (SLH entry).
📌 Additional Notes
• - If price continues beyond the liquidity line without reversal, it may indicate a trend continuation rather than a stop hunt.
• - Always confirm with Higher Time Frame bias, Institutional Order Flow, and price reaction at the zone.
