Lazy Long Term SignalsThis little indicator displays the ratio between the series close and the (default 45) exponential moving average.
The idea is to consider buying when the signal is above 1 and sell, or short if aggressive, when the signal crosses below 1. It strikes me as useful when used in conjunction with the MACD and UCSgears' Linear Regression Slope indicator.
Using such a simple strategy as I outlined above is probably only useful (if it even works) and beneficial in long term or tax deferred accounts like 401Ks, IRAs, ROTH IRAs, etc. Otherwise the taxation would probably destroy the appreciation. Who wants that?
在脚本中搜索"沪深主板45度上升的股票"

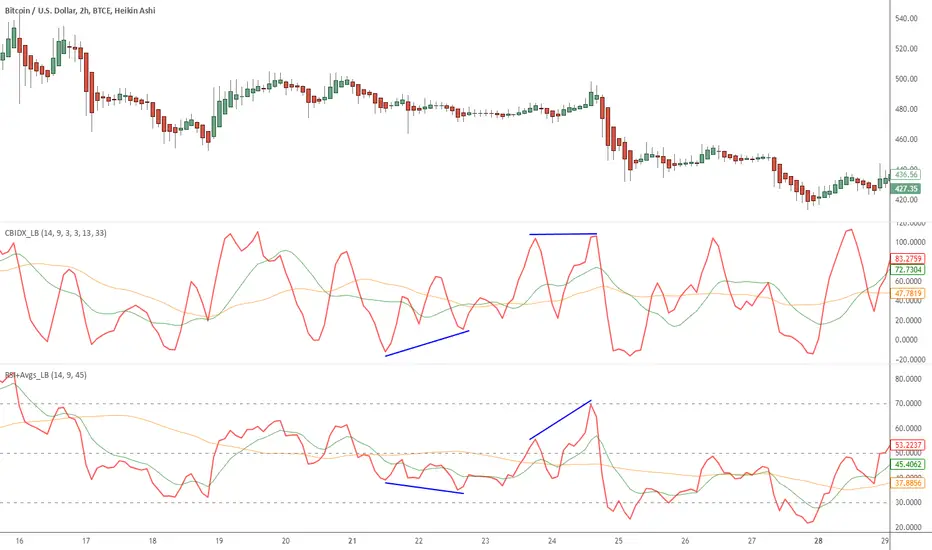
Indicators: Constance Brown Composite Index & RSI+AvgsI am a big fan of Constance Brown. Her book "Technical Analysis for Trading Professionals" is an absolute classic (get the 2nd edition).
I have included here 2 of the indicators she uses in all her charts.
Composite Index
----------------------------------------
This is a formula Ms Brown developed (Cardwell may not agree!) to identify divergence failures with in the RSI. This also highlights the horizontal support levels with in the indicator area.
This index removes the normalization range restrictions in RSI. This means it is not bound with in 0-100 range. Also, this has embedded momentum calculation in it.
The fine nuances of this indicator are not documented well enough, if you find some good documentation, do let me know. Always use this with RSI (like the next one).
RSI+Avgs
----------------------------------------
This is plain 14 period RSI with a 9-period EMA and 45-period SMA overlaid.