3 Linear Regression CurveFast 3LRC - 15/30/60 standard settings - 15/30 give a lot of noise, but give you a some time to prepare for the 60 to flip
在脚本中搜索"父亲把15万藏被子里被儿子误扔"
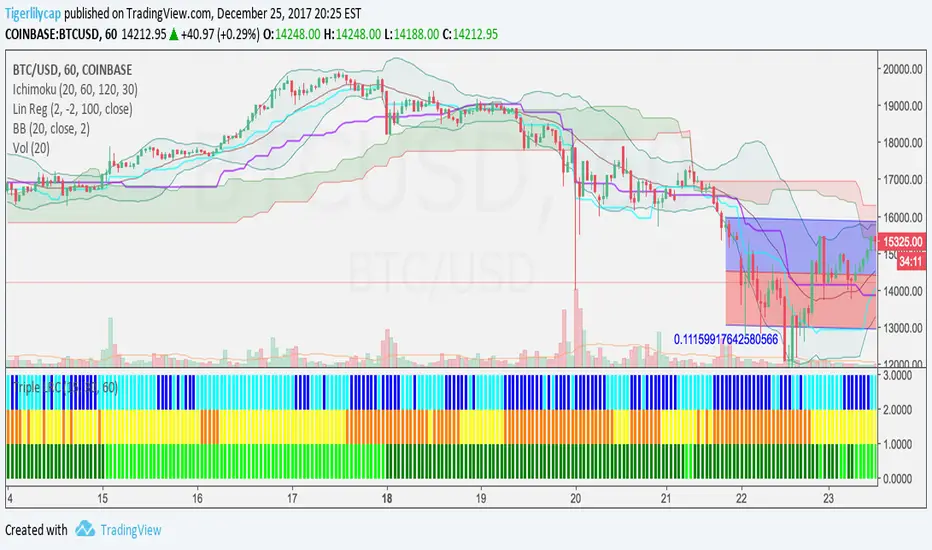
Noro's OverCloud v1.2 MTFAdded big timeframe
MN = 1 month
W = 1 week
D = 1 day
240 = 4 hours
180 = 3 hours
120 = 2 hours
60 = 1 hours
30 = 30 min
15 = 15 min
etc...

Fractal Resonance BarLazyBear's WaveTrend port has been praised for highlighting trend reversals with precision and punctuality (minimal lag). But strong "3rd Wave" trends can "embed" or saturate any oscillator flashing several premature crosses while stuck overbought/oversold. This happens when the trend stretches over a longer timescale than the oscillator's averaging window or filter time constant. Our solution: monitor many timescales. With Fractal Resonance Bar's rich color codings, strong wavefronts form across timescales and jump out like an approaching line of thunderclouds!
Fractal Resonance Bar color-codes the status of eight underlying stochastic oscillators, with each row averaging over twice the time of the row above.
Fractal Resonance Bar shifts its timescales along with your choice of main chart timescale:
1 minute chart: 1 minute through 128 minute (~2 hour) oscillators.
15 minute chart: 15 minute through 1920 minute (~32 hour) oscillators.
1 hour chart: 1 hour through 128 hour (~2 week) oscillators.
Daily chart: 1 day through 128 day (~4 month) oscillators.
The color map is configured as follows:
Hot Pink: Extreme Overbought (> 100%) rolled over to sell, but oscillators probably embedded with more upside (revert to Dark Green) possible after a pause.
Deep Red: Overbought (> 75%) crossover ripe for selling (validated when red spreads to timescales below).
Brown: Minor (< 75%) crossover sell from which could bounce back green or start a plunge toward gray/black.
Gray/Black: Mature (< -75%) sells turning full black in a plunge before the dawn.
Lime Green: Extreme Oversold (< -100%) and bouncing, though may yet bottom even lower.
Green: Oversold (< -75%) crossover ripe for buy. Green spreading to all timescales below will validate bottom is in.
Dark Green/Teal: Mature buy in overbought (> 75%) range, waiting for sell crossover to Hot Pink for a pause or correction.
White Stripes are Impulsive Trend Warning
Fractal Resonance Bar warns of oscillator embedding by showing white stripes when it detects strong, early surges in the timescale rows below.The white stripes usually accompany Hot Pink warning it's too early to go short, or Lime Green warning it's too early to go long.
Heeding these warnings will probably miss the exact top or bottom, but you're less likely to get overrun in a momentum move.
Usually the market gives us a second opportunity to short very close to the top or buy very close to the bottom after the warning white stripes have subsided.
NOTE: Recently rolled over Futures contracts may not have enough history for all oscillator calculations, in which case no bar colors will appear.
Tweakable Attributes
The default Channel Length, Stochastic Ratio Length and Lag Length work reasonably well on all timescales in our experience. Minor tweaks don't hurt but this may just overfit to a particular chart history.
We don't recommend changing the 75% Overbought and 100% Extreme Overbought default levels as these are ideal numbers relative to the underlying oscillator statistic calculations. But these settings can shift the color transition levels.
Embedded attribute controls the sensitivity/conservativeness of the white strip embedding detectors. Closer to 75 increases the warning sensitivity while closer to 100 decreases the aggressiveness of blocking white stripes.
Embed Separation also affects the white stripe sensitivity.
Row width increases each row's thickness to fill the available screen height you've afforded the bar.

Trend and Entry CCI ST15This is a T3 CCI with a fast and slow line as well as extreme lines, a -15,15 filter to make zero line rejections and crosses more mechanical and help weed out whipsaw. I will probably update description in the future and get into more detail about how the indicator is used but for now if you want more info look up woodie CCI patterns :) Good Luck!!
extended session - Regular Opening-Range- JayyOpening Range and some other scripts updated to plot correctly (see comments below.) There are three variations of the fibonacci expansion beyond the opening range and retracements within the opening range of the US Market session - I have not put in the script for the other markets yet.
The three scripts have different uses and strengths:
The extended session script (with the script here below) will plot the opening range whether you are using the extended session or the regular session. (that is to say whether "ext" in the lower right hand corner is highlighted or not.). While in the extended session the opening range has some plotting issues with periods like 13 minutes or any period that is not divisible into 330 mins with a round number outcome (eg 330/60 =5.5. Therefore an hour long opening range has problems in the extended session.
The pre session script is only for the premarket. You can select any opening range period you like. I have set the opening range to be the full premarket session. If you select a different session you will have to unselect "pre open to 9:30 EST for Opening Range?" in the format section. The script defaults to 15 minutes in the "period Of Pre Opening Range?". To go back to the 4 am to 9:30 pre opening range select "pre open to 9:30 EST for Opening Range?" there is no automatic 330 minute selection.
The past days offset script only works in 5 min or 15 minute period. It will show the opening range from up to 20 days past over the current days price action. Use this for the regular session only. 0 shows the current day's opening range. Use the positive integers for number of days back ie 1, 2, 3 etc not -1, -2, -3 etc. The script is preprogrammed to use the current day (0).
Scripts updated to plot correctly: One thing they all have in common is a way of they deal with a somewhat random problem that shifts the plots 4 hours in one direction or the other ie the plot started at 9:30 EST or 1:30PM EST. This issue started to occur approximately June 22, 2015 and impacts any script that tried to use "session" times to manage a plot in my scripts. The issue now seems to have been resolved during this past week.
Just in case the problem reoccurs I have added a "Switch session plot?" to each script. If the plot looks funny check or uncheck the "Switch session plot?" and see the difference. Of course if a new issue crops up it will likely require a different fix.
I have updated all of the scripts shown on this chart. If you are using a script of mine that suffers from the compiler issue then you will find an update on this chart. You can get any and all of the scripts by clicking on the small sideways wishbone on the left middle of the chart. You will see a dialogue box. Then click "make it mine". This will import all of the scripts to your computer and you can play around with them all to decide what you want and what you don't want. This is the easiest way to get all of the scripts in one fell swoop. It is also the easiest way for me to make all of the scripts available. I do not have all of the plots visible since it is too messy and one of the scripts (pre OR) is only for the regular session. To view the scripts click on the blue eye to the right of the script title to show it on this script. If you can only use the regular session. The scripts will all (with the exception of the pre OR) work fine.
If for any reason this script seems flakey refresh the page r try a slightly different period. I have noticed that sometimes randomly the script loves to return to the 5 min OR. This is a very new issue transient issue. As always if you see an issue please let me know.
Cheers Jayy

BB 100 with Barcolors6/19/15 I added confirmation highlight bars to the code. In other words, if a candle bounced off the lower Bollinger band, it needed one more close above the previous candle to confirm a higher probability that a change in investor sentiment has reversed. Same is true for upper Bollinger band bounces. I also added confirmation highlight bars to the 100 sma (the basis). The idea is that lower and upper bands are potential points of support and resistance. The same is true of the basis if a trend is to continue. 6/28/15 I added a plotshape to identify closes above/below TLine. One thing this system points out is it operates best in a trend reversal. Consolidations will whipsaw the indicator too much. I have found that when this happens, if using daily candles, switch to hourly, 30 min, etc., to catch a better signal. Nothing moves in a straight line. As with any indicator, it is a tool to be used in conjunction with the art AND science of trading. As always, try the indicator for a time so that you are comfortable enough to use real money. This is designed to be used with "BB 25 with Barcolors".

BB 25 with Barcolors6/19/15 I added confirmation highlight bars to the code. In other words, if a candle bounced off the lower Bollinger band, it needed one more close above the previous candle to confirm a higher probability that a change in investor sentiment has reversed. Same is true for upper Bollinger band bounces. I also added confirmation highlight bars to the 100 sma (the basis). The idea is that lower and upper bands are potential points of support and resistance. The same is true of the basis if a trend is to continue. 6/28/15 I added a plotshape to identify closes above/below TLine. One thing this system points out is it operates best in a trend reversal. Consolidations will whipsaw the indicator too much. I have found that when this happens, if using daily candles, switch to hourly, 30 min, etc., to catch a better signal. Nothing moves in a straight line. As with any indicator, it is a tool to be used in conjunction with the art AND science of trading. As always, try the indicator for a time so that you are comfortable enough to use real money. This is designed to be used with "BB 100 with Barcolors".

KK_Intraday MAsHey guys,
today I was browsing through intraday Charts looking at some moving averages. Basically what I wanted to see was whether the currency pair was trading below or above the moving average of the day/week/month. For a better understanding: The daily MA on a 15 minute Forex Chart would be the 96 MA.
I encountered the problem that i always had to change the settings for my MAs when changing the Time Interval, so I coded this here up. It is pretty simple but maybe somebody else has the same problem and can put it to use.
The script has some settings as listed below:
Choice which MAs to plot, (Daily, Weekly, Monthly)
Choice which type of MA to use (Simple, Exponential, Weighted)
Neccesary Settings for the correct calculation (e.g. Number of trading hours per day). These settings depend on the instrument you are using and should always be checked before using this script.
There are a few things to Note when using this script:
This script works for intraday charts only.
The monthly MA doesn't work on any Time Interval smaller than 15 minutes. Can't do anything about it unfortunately.
This is my first published Script, use it with caution and let me know what you think about it!

Opening Range Breakout with 2 Profit Targets.Opening Range Breakout with 2 Profit Targets.
Updated Indicator now works on all Symbols with Many Different Session Options.
***Known PineScript Issue…While the Opening Range is being Formed the lines only adjust for that individual bar. Just reset Indicator after Opening Range Completes.
***All Times are Based on New York Time
Session Options Forex U.S. Banks Open (8:00), Gold U.S. Open (8:20), Oil U.S. Open (9:00), U.S. Cash Session - Stocks (9:30), NY Forex Open (17:00) , Europe Open (02:00), or if you choose Setting 0 the Session Runs from 00:00 to 00:00 (Midnight to Midnight).
***Ability to use 60 minute Opening Range, 30 minute, 15 minute, and many other options.
***However you can manually change the times in the Inputs Tab to adjust for any session you prefer. This is useful for Day Light Savings Adjustments. Also the default times work if your charts are set to EST Time. If you use A different time zone in your settings you need to Adjust the times in the inputs tab.
Initially Opening Range High and Low plot as Yellow Lines. If Price Goes Above Opening Range then Line Turns Green. If Price Goes Below Opening Range Line Turns Red.
By default the First Profit Target is 1/2 the Width of the Opening Range and the 2nd Profit Target is 1 Times the Opening Range. However these are Adjustable in the Inputs Tab.
By Default the Opening Range Length is 1 Hour. However, you can Change the Opening Range Length to 15 min, 30 min, 2 hours etc. in the Inputs Tab.
Plots a 1 Above or Below Candle when 1st Profit Target is Achieved, and a 2 when 2nd Profit Target is Achieved.

Indicator: Trend Trigger FactorIntroduced by M.H.Pee, Trend Trigger Factor is designed to keep the trader trading with the trend.
System rules according to the developer:
* If the 15-day TTF is above 100 (indicating an uptrend), you will want to be in long positions.
* If the 15-day TTF is below -100, you will want to be short.
* If it is between -100 and 100, you should remain with the current position.
More info:
Original Article by Mr.Pee: drive.google.com

NY Session Divisions⭐NY Session Divisions - Professional Trading Session Manager
NY Session Divisions is an advanced trading indicator that professionally segments the New York trading day into precise sessions, providing institutional-grade market structure analysis with smart breakout detection and comprehensive filtering systems.
✨ KEY FEATURES
🕒 8 Professional Trading Sessions
- US Overnight Range (03:30-11:50)
- NY Pre-Open (16:45-17:00)
- NY First Session ORB (17:00-17:15)
- Premarket Range - Recommended by Mahdi Salari*
- NY Midday Range
- NY 2nd Pre-Open
- 2nd Session ORB
- US After Hours ORB
🎯 Advanced Trading Strategies
- School Run Strategy (SRS) by Tom Hougaard - Breakout-focused approach
- Anti-SRS Strategy - Range-trading methodology
- Dual Strategy System - Combine breakout and range trading for maximum flexibility
🔔 Smart Alert System
- Multi-timeframe confirmation
- Heiken Ashi candle validation
- Customizable alert conditions
- Sound notifications with detailed messages
- Post-close confirmation to avoid false signals
🛡️ Professional Filter Stack
- Ichimoku Baseline
- Divergence Detection - Advanced market analysis
- EMA 200 Filter - Trend alignment
- Ichimoku Baseline - Market structure
- ATR Filter - Volatility validation
- RSI Filter - Momentum confirmation
🎨 Advanced Visualization
- Clean session range displays
- Professional Heiken Ashi candles
- Smart breakout markers (Small/Tiny for signal strength)
- Take Profit lines with ATR-based calculations
- Customizable colors and opacity
🏆 WHY TRADERS LOVE THIS INDICATOR
✅ For Breakout Traders
- Precise session boundary detection
- Clean breakout signals with confirmation
- Multiple filter validation
✅ For Range Traders
- Clear session range identification
- Anti-SRS strategy for range-bound markets
- Support/Resistance level tracking
✅ For Professional Traders
- Institutional-grade session management
- Comprehensive filtering system
- Multi-timeframe analysis
- Customizable risk management
⚡ QUICK START GUIDE
Basic Setup (2 Minutes)
1. Enable Sessions** - Choose 1-2 sessions to start
2. Set Alerts - Configure your preferred notification method
3. Apply Filters - Enable EMA 200 and Ichimoku for starters
Advanced Configuration
- Combine SRS + Anti-SRS for comprehensive strategy
- Use multiple divergence filters for confirmation
- Customize TP lines based on your risk profile
- Drawing 1st and 2nd Session Close lines
PROFESSIONAL TIPS
Session Selection Strategy
- Start with Session 1 (US Overnight) for overall market trend identification
- Add Session 3 (NY First ORB) for opening momentum
- Use Session 4 (Premarket) for the best perfomance of the breakout strategy
Filter Optimization
- Conservative : EMA 200 + Ichimoku Baseline
- Balanced : Add ATR filter for volatility check 0.8 is enough
- Aggressive : Enable all filters for maximum confirmation but the number of signal and performance will decrease
Risk Management
- Use TP lines for automatic profit targets
- Combine with proper position sizing
- Always use stop losses
🔧 TECHNICAL SPECIFICATIONS
- Platform : TradingView Pine Script v6
- Markets : All US trading instruments (ES, NQ, YM, CL, etc.)
- Timeframes : 1min to Daily
- Auto DST Handling : Yes
- Real-time Processing : Yes
📊 PERFORMANCE FEATURES
- Zero Repaint - All signals confirmed after candle close
- Multi-Timeframe - Works across all chart timeframes
- Resource Optimized - Efficient calculation methods
- User Customizable - Complete control over all parameters
- Consistent Performance - Reliable session-based signals
- Professional Grade - Institutional-level analysis tools
- Continuous Updates - Regular improvements and enhancements
- Community Supported - Active user community and support
🔄 KEEP UPDATED
Click the Favorite Star ⭐ to receive update notifications and stay current with new features and improvements!
Professional traders don't guess - they analyze. NY Session Divisions gives you the analytical edge.
Happy Trading! 📈
Created with precision for serious traders
DISCLAIMER
This indicator is for educational and informational purposes only. It should not be considered as financial advice. Always practice proper risk management and test strategies in demo accounts before live trading. Past performance does not guarantee future results.

LegendaryGoldTraderLegendaryGoldTrader Signals – TradingView Indicator
This script is a comprehensive multi-indicator signal tool for XAUUSD (Gold), optimized for short timeframes from 1 to 15 minutes. It combines trend, momentum, and entry indicators to help identify potential Long and Short trading opportunities.
Features:
EMA (Trend Filter): Two EMAs determine the short-term trend direction.
RSI: Highlights overbought and oversold conditions.
MACD: Detects momentum shifts and trend changes.
Stochastic: Provides precise entry timing.
ADX: Confirms trend strength and filters signals during weak trends.
3-Candle Pattern (optional): Identifies short-term reversal patterns for Long or Short entries.
BUY/SELL Labels: Clear signals displayed above or below the chart.
Info Window: Displays all indicator signals and trend strength at a glance.
Highlights:
Fully configurable indicators and signals.
3-Candle Pattern can be enabled or disabled.
Suitable for fast intraday trading on minute charts, but flexible for other timeframes.
Supports trend confirmation and false-signal filtering for controlled entries.

Aurum DCX AVE Gold and Silver StrategySummary in one paragraph
Aurum DCX AVE is a volatility break strategy for gold and silver on intraday and swing timeframes. It aligns a new Directional Convexity Index with an Adaptive Volatility Envelope and an optional USD/DXY bias so trades appear only when direction quality and expansion agree. It is original because it fuses three pieces rarely combined in one model for metals: a convexity aware trend strength score, a percentile based envelope that widens with regime heat, and an intermarket DXY filter.
Scope and intent
• Markets. Gold and silver futures or spot, other liquid commodities, major indices
• Timeframes. Five minutes to one day. Defaults to 30min for swing pace
• Default demo used in this publication. TVC:GOLD on 30m
• Purpose. Enter confirmed volatility breaks while muting chop using regime heat and USD bias
• Limits. This is a strategy. Orders are simulated on standard candles only
Originality and usefulness
• Unique fusion. DCX combines DI strength with path efficiency and curvature. AVE blends ATR with a high TR percentile and widens with DCX heat. DXY adds an intermarket bias
• Failure mode addressed. False starts inside compression and unconfirmed breakouts during USD swings
• Testability. Each component has a named input. Entry names L and S are visible in the list of trades
• Portable yardstick. Weekly ATR for stops and R multiples for targets
• Open source. Method and implementation are disclosed for community review
Method overview in plain language
You score direction quality with DCX, size an adaptive envelope with a blend of ATR and a high TR percentile, and only allow breaks that clear the band while DCX is above a heat threshold in the same direction. An optional DXY filter favors long when USD weakens and short when USD strengthens. Orders are bracketed with a Weekly ATR stop and an R multiple target, with optional trailing to the envelope.
Base measures
• Range basis. True Range and ATR over user windows. A high TR percentile captures expansion tails used by AVE
• Return basis. Not required
Components
• Directional Convexity Index DCX. Measures directional strength with DX, multiplies by path efficiency, blends a curvature term from acceleration, scales to 0 to 100, and uses a rise window
• Adaptive Volatility Envelope AVE. Midline ALMA or HMA or EMA plus bands sized by a blend of ATR and a high TR percentile. The blend weight follows volatility of volatility. Band width widens with DCX heat
• DXY Bias optional. Daily EMA trend of DXY. Long bias when USD weakens. Short bias when USD strengthens
• Risk block. Initial stop equals Weekly ATR times a multiplier. Target equals an R multiple of the initial risk. Optional trailing to AVE band
Fusion rule
• All gates must pass. DCX above threshold and rising. Directional lead agrees. Price breaks the AVE band in the same direction. DXY bias agrees when enabled
Signal rule
• Long. Close above AVE upper and DCX above threshold and DCX rising and plus DI leads and DXY bias is bearish
• Short. Close below AVE lower and DCX above threshold and DCX falling and minus DI leads and DXY bias is bullish
• Exit and flip. Bracket exit at stop or target. Optional trailing to AVE band
Inputs with guidance
Setup
• Symbol. Default TVC:GOLD (Correlation Asset for internal logic)
• Signal timeframe. Blank follows the chart
• Confirm timeframe. Default 1 day used by the bias block
Directional Convexity Index
• DCX window. Typical 10 to 21. Higher filters more. Lower reacts earlier
• DCX rise bars. Typical 3 to 6. Higher demands continuation
• DCX entry threshold. Typical 15 to 35. Higher avoids soft moves
• Efficiency floor. Typical 0.02 to 0.06. Stability in quiet tape
• Convexity weight 0..1. Typical 0.25 to 0.50. Higher gives curvature more influence
Adaptive Volatility Envelope
• AVE window. Typical 24 to 48. Higher smooths more
• Midline type. ALMA or HMA or EMA per preference
• TR percentile 0..100. Typical 75 to 90. Higher favors only strong expansions
• Vol of vol reference. Typical 0.05 to 0.30. Controls how much the percentile term weighs against ATR
• Base envelope mult. Typical 1.4 to 2.2. Width of bands
• Regime adapt 0..1. Typical 0.6 to 0.95. How much DCX heat widens or narrows the bands
Intermarket Bias
• Use DXY bias. Default ON
• DXY timeframe. Default 1 day
• DXY trend window. Typical 10 to 50
Risk
• Risk percent per trade. Reporting field. Keep live risk near one to two percent
• Weekly ATR. Default 14. Basis for stops
• Stop ATR weekly mult. Typical 1.5 to 3.0
• Take profit R multiple. Typical 1.5 to 3.0
• Trail with AVE band. Optional. OFF by default
Properties visible in this publication
• Initial capital. 20000
• Base currency. USD
• request.security lookahead off everywhere
• Commission. 0.03 percent
• Slippage. 5 ticks
• Default order size method percent of equity with value 3% of the total capital available
• Pyramiding 0
• Process orders on close ON
• Bar magnifier ON
• Recalculate after order is filled OFF
• Calc on every tick OFF
Realism and responsible publication
• No performance claims. Past results never guarantee future outcomes
• Shapes can move while a bar forms and settle on close
• Strategies use standard candles for signals and orders only
Honest limitations and failure modes
• Economic releases and thin liquidity can break assumptions behind the expansion logic
• Gap heavy symbols may prefer a longer ATR window
• Very quiet regimes can reduce signal contrast. Consider higher DCX thresholds or wider bands
• Session time follows the exchange of the chart and can change symbol to symbol
• Symbol sensitivity is expected. Use the gates and length inputs to find stable settings
Open source reuse and credits
• None
Mode
Public open source. Source is visible and free to reuse within TradingView House Rules
Legal
Education and research only. Not investment advice. You are responsible for your decisions. Test on historical data and in simulation before any live use. Use realistic costs.

Trend Telescope v4 Basic Configuration
pine
// Enable only the components you need
Order Flow: ON
Delta Volume: ON
Volume Profile: ON
Cumulative Delta: ON
Volatility Indicator: ON
Momentum Direction: ON
Volatility Compression: ON
📊 Component Breakdown
1. Order Flow Analysis
Purpose: Identifies buying vs selling pressure
Visual: Histogram (Green=Buying, Red=Selling)
Calculation: Volume weighted by price position
Usage: Spot institutional order blocks
2. Delta Volume Values
Purpose: Shows volume imbalance
Bull Volume (Green): Volume on up bars
Bear Volume (Red): Volume on down bars
Usage: Identify volume divergences
3. Anchored Volume Profile
Purpose: Finds high-volume price levels
POC (Point of Control): Price with highest volume
Profile Length: Adjustable (default: 50 bars)
Usage: Identify support/resistance zones
4. Cumulative Volume Delta
Purpose: Tracks net buying/selling pressure over time
Trend Analysis: Rising=Buying pressure, Falling=Selling pressure
Divergence Detection: Price vs Delta divergences
Usage: Confirm trend strength
5. Volatility Indicator
Purpose: Measures market volatility with cycle detection
Volatility Ratio: ATR as percentage of price
Volatility Cycle: SMA of volatility (identifies periods)
Histogram: Difference between current and average volatility
Usage: Adjust position sizing, identify breakout setups
6. Real-time Momentum Direction
Purpose: Multi-factor momentum assessment
Components: Price momentum (50%), RSI momentum (30%), Volume momentum (20%)
Visual: Line plot with color coding
Labels: Clear BULLISH/BEARISH/NEUTRAL signals
Usage: Trend confirmation, reversal detection
7. Volatility Compression Analysis
Purpose: Identifies low-volatility consolidation periods
Compression Detection: True Range below threshold
Strength Meter: How compressed the market is
Histogram: Red when compressed, Gray when normal
Usage: Predict explosive moves, prepare for breakouts
⚙️ Advanced Configuration
Optimal Settings for Different Timeframes
pine
// Scalping (1-15 min)
Profile Length: 20
ATR Period: 10
Momentum Length: 8
Compression Threshold: 0.3
// Day Trading (1H-4H)
Profile Length: 50
ATR Period: 14
Momentum Length: 14
Compression Threshold: 0.5
// Swing Trading (Daily)
Profile Length: 100
ATR Period: 20
Momentum Length: 21
Compression Threshold: 0.7
Alert Setup Guide
Enable "Enable Alerts" in settings
Choose alert types:
Momentum Alerts: When momentum changes direction
Compression Alerts: When volatility compression begins
Set alert frequency to "Once Per Bar"
Configure notification preferences
🎯 Trading Strategies
Strategy 1: Compression Breakout
pine
Entry Conditions:
1. Volatility Compression shows RED histogram
2. Cumulative Delta trending upward
3. Momentum turns BULLISH
4. Price breaks above POC level
Exit: When Momentum turns BEARISH or Compression ends
Strategy 2: Momentum Reversal
pine
Entry Conditions:
1. Strong Order Flow in opposite direction
2. Momentum divergence (price makes new high/low but momentum doesn't)
3. Volume confirms the reversal
Exit: When Order Flow returns to trend direction
Strategy 3: Institutional Accumulation
pine
Identification:
1. High Cumulative Delta but flat/sideways price
2. Consistent Order Flow in one direction
3. Volume Profile shows accumulation at specific levels
Trade: Enter in direction of Order Flow when price breaks level
📈 Interpretation Guide
Bullish Signals
✅ Order Flow consistently green
✅ Cumulative Delta making higher highs
✅ Momentum above zero and rising
✅ Bull Volume > Bear Volume
✅ Price above POC level
Bearish Signals
✅ Order Flow consistently red
✅ Cumulative Delta making lower lows
✅ Momentum below zero and falling
✅ Bear Volume > Bull Volume
✅ Price below POC level
Caution Signals
⚠️ Momentum divergence (price vs indicator)
⚠️ Volatility compression (potential big move coming)
⚠️ Mixed signals across components
🔧 Troubleshooting
Common Issues & Solutions
Problem: Indicators not showing
Solution: Check "Show on Chart" is enabled
Problem: Alerts not triggering
Solution: Verify alert is enabled in both script and TradingView alert panel
Problem: Performance issues
Solution: Reduce number of enabled components or increase timeframe
Problem: Volume Profile not updating
Solution: Adjust Profile Length setting, ensure sufficient historical data
Performance Optimization
Disable unused components
Increase chart timeframe
Reduce historical bar count
Use on lower timeframes with fewer indicators enabled
💡 Pro Tips
Risk Management
Use Volatility Indicator for position sizing
Monitor Cumulative Delta for trend confirmation
Use POC levels for stop-loss placement
Multi-Timeframe Analysis
Use higher timeframe for trend direction
Use current timeframe for entry timing
Correlate signals across timeframes
Market Condition Adaptation
Trending Markets: Focus on Momentum + Order Flow
Ranging Markets: Focus on Volume Profile + Compression
High Volatility: Use smaller position sizes
Low Volatility: Prepare for compression breakouts
📚 Educational Resources
Key Concepts to Master
Volume-price relationships
Market microstructure
Institutional order flow
Volatility regimes
Momentum vs mean reversion
Recommended Learning Path
Start with Order Flow + Momentum only
Add Volume Profile once comfortable
Incorporate Volatility analysis
Master multi-component correlation
🆘 Support
Getting Help
Check component toggles are enabled
Verify sufficient historical data is loaded
Test on major pairs/indices first
Adjust settings for your trading style
Continuous Improvement
Backtest strategies thoroughly
Keep a trading journal
Adjust parameters based on market conditions
Combine with price action analysis
Remember: No indicator is perfect. Use this tool as part of a comprehensive trading plan with proper risk management. Always test strategies in demo accounts before live trading.
Happy Trading! 📈

EMA Oscillator (21, 50, 100, 200) — Separated + OB/OS//@version=5
indicator("EMA Oscillator (21, 50, 100, 200) — Separated + OB/OS", overlay=false)
// === INPUTS ===
lookback = input.int(500, "Lookback for normalization", minval=100)
// === EMAs ===
ema21 = ta.ema(close, 21)
ema50 = ta.ema(close, 50)
ema100 = ta.ema(close, 100)
ema200 = ta.ema(close, 200)
// === Normalization Function (per EMA) ===
normalize(src) =>
minVal = ta.lowest(src, lookback)
maxVal = ta.highest(src, lookback)
100 * (src - minVal) / (maxVal - minVal)
// === Normalize Each Separately ===
n21 = normalize(ema21)
n50 = normalize(ema50)
n100 = normalize(ema100)
n200 = normalize(ema200)
// === Plot EMAs (Separated Offsets for Clarity) ===
plot(n21, color=color.yellow, title="EMA 21", linewidth=2)
plot(n50 - 5, color=color.orange, title="EMA 50", linewidth=2)
plot(n100 - 10, color=color.blue, title="EMA 100", linewidth=2)
plot(n200 - 15, color=color.red, title="EMA 200", linewidth=2)
// === Overbought/Oversold Lines ===
hline(80, "Overbought", color=color.new(color.red, 60), linestyle=hline.style_dotted)
hline(20, "Oversold", color=color.new(color.green, 60), linestyle=hline.style_dotted)
hline(50, "Midline", color=color.new(color.gray, 80))

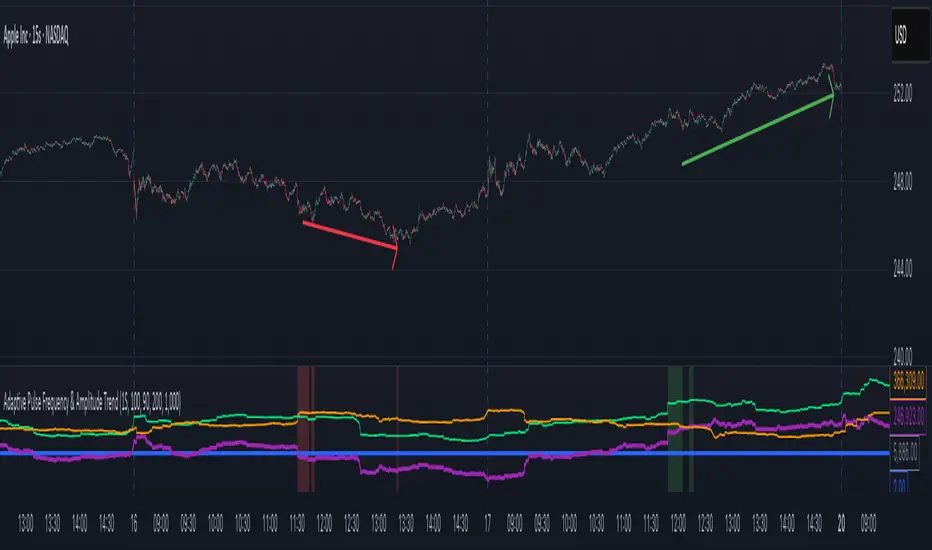
Adaptive Pulse Frequency & Amplitude TrendAdaptive Pulse Frequency & Amplitude Trend Indicator
This Pine Script indicator is designed to identify strong bullish or bearish trends by analyzing volume dynamics on a lower timeframe than the one currently displayed on the chart. It operates on the principle of detecting significant spikes in buying or selling pressure, referred to as "pulses," and then evaluating their frequency, strength, and dominance over the opposing market forces.
Core Concepts
Lower Timeframe Volume Analysis: The script requests up-volume and down-volume data from a more granular, lower timeframe (e.g., 1-minute data when on a 15-minute chart). This provides a higher-resolution view of the flow of buy and sell orders.
Adaptive Pulse Detection: A "pulse" is defined as a bar with an unusually high net volume (up volume minus down volume). Instead of using a fixed value, the indicator calculates an adaptive threshold based on the 90th percentile of net volume over a 100-bar lookback period. Any bar with a net volume exceeding this dynamic threshold is flagged as a pulse, categorized as either bullish (positive net volume) or bearish (negative net volume).
Frequency and Amplitude: The indicator measures two key aspects of these pulses over user-defined lookback periods:
Net Frequency: The number of bullish pulses minus the number of bearish pulses. A positive value indicates more buying pulses, while a negative value indicates more selling pulses.
Net Amplitude : The cumulative volume of bullish pulses minus the cumulative volume of bearish pulses. This measures the overall strength and conviction behind the pulses.
Primary Trend Signal
The indicator's primary signal comes from a strict dominance condition. It doesn't just look for more buying or selling pulses; it checks if these pulses are powerful enough to overwhelm the total opposite pressure in the market.
Bullish Dominance (Green Background): A strong bullish signal is generated when the total volume of all bullish pulses within a lookback period is greater than the total down-volume from all bars (not just pulses) in that same period.
Bearish Dominance (Red Background): A strong bearish signal is generated when the total volume of all bearish pulses is greater than the total up-volume from all bars in that period.
The chart background is colored green for bullish dominance and red for bearish dominance, providing a clear visual cue for when one side has taken decisive control.
Plotted Data
In addition to the background coloring, the indicator plots several lines in its own pane for more detailed analysis:
Net Frequency: Shows the trend in the number of bull vs. bear pulses.
Net Amplitude: Shows the trend in the strength of bull vs. bear pulses.
Bullish/Bearish Amplitude: The individual cumulative volumes for bull and bear pulses.
Dynamic Threshold: The adaptive value used to identify pulses.
By combining an adaptive detection method with a strict dominance condition, this tool aims to filter out market noise and highlight periods of genuinely strong, volume-backed trends.
Realtime RenkoI've been working on real-time renko for a while as a coding challenge. The interesting problem here is building renko bricks that form based on incoming tick data rather than waiting for bar closes. Every tick that comes through gets processed immediately, and when price moves enough to complete a brick, that brick closes and a new one opens right then. It's just neat because you can run it and it updates as you'd expect with renko, forming bricks based purely on price movement happening in real time rather than waiting for arbitrary time intervals to pass.
The three brick sizing methods give you flexibility in how you define "enough movement" to form a new brick. Traditional renko uses a fixed price range, so if you set it to 10 ticks, every brick represents exactly 10 ticks of movement. This works well for instruments with stable tick sizes and predictable volatility. ATR-based sizing calculates the average true range once at startup using a weighted average across all historical bars, then divides that by your brick value input. If you want bricks that are one full ATR in size, you'd use a brick value of 1. If you want half-ATR bricks, use 2. This inverted relationship exists because the calculation is ATR divided by your input, which lets you work with multiples and fractions intuitively. Percentage-based sizing makes each brick a fixed percentage move from the previous brick's close, which automatically scales with price level and works well for instruments that move proportionally rather than in absolute tick increments.
The best part about this implementation is how it uses varip for state management. When you first load the indicator, there's no history at all. Everything starts fresh from the moment you add it to your chart because varip variables only exist in real-time. This means you're watching actual renko bricks form from real tick data as it arrives. The indicator builds its own internal history as it runs, storing up to 250 completed bricks in memory, but that history only exists for the current session. Refresh the page or reload the indicator and it starts over from scratch.
The visual implementation uses boxes for brick bodies and lines for wicks, drawn at offset bar indices to create the appearance of a continuous renko chart in the indicator pane. Each brick occupies two bar index positions horizontally, which spaces them out and makes the chart readable. The current brick updates in real time as new ticks arrive, with its high, low, and close values adjusting continuously until it reaches the threshold to close and become finalized. Once a brick closes, it gets pushed into the history array and a new brick opens at the closing level of the previous one.
What makes this especially useful for debugging and analysis are the hover tooltips on each brick. Clicking on any brick brings up information showing when it opened with millisecond precision, how long it took to form from open to close, its internal bar index within the renko sequence, and the brick size being used. That time delta measurement is particularly valuable because it reveals the pace of price movement. A brick that forms in five seconds indicates very different market conditions than one that takes three minutes, even though both bricks represent the same amount of price movement. You can spot acceleration and deceleration in trend development by watching how quickly consecutive bricks form.
The pine logs that generate when bricks close serve as breadcrumbs back to the main chart. Every time a brick finalizes, the indicator writes a log entry with the same information shown in the tooltip. You can click that log entry and TradingView jumps your main chart to the exact timestamp when that brick closed. This lets you correlate renko brick formation with what was happening on the time-based chart, which is critical for understanding context. A brick that closed during a major news announcement or at a key support level tells a different story than one that closed during quiet drift, and the logs make it trivial to investigate those situations.
The internal bar indexing system maintains a separate count from the chart's bar_index, giving each renko brick its own sequential number starting from when the indicator begins running. This makes it easy to reference specific bricks in your analysis or when discussing patterns with others. The internal index increments only when a brick closes, so it's a pure measure of how many bricks have formed regardless of how much chart time has passed. You can match these indices between the visual bricks and the log entries, which helps when you're trying to track down the details of a specific brick that caught your attention.
Brick overshoot handling ensures that when price blows through the threshold level instead of just barely touching it, the brick closes at the threshold and the excess movement carries over to the next brick. This prevents gaps in the renko sequence and maintains the integrity of the brick sizing. If price shoots up through your bullish threshold and keeps going, the current brick closes at exactly the threshold level and the new brick opens there with the overshoot already baked into its initial high. Without this logic, you'd get renko bricks with irregular sizes whenever price moved aggressively, which would undermine the whole point of using fixed-range bricks.
The timezone setting lets you adjust timestamps to your local time or whatever reference you prefer, which matters when you're analyzing logs or comparing brick formation times across different sessions. The time delta formatter converts raw milliseconds into human-readable strings showing days, hours, minutes, and seconds with fractional precision. This makes it immediately clear whether a brick took 12.3 seconds or 2 minutes and 15 seconds to form, without having to parse millisecond values mentally.
This is the script version that will eventually be integrated into my real-time candles library. The library version had an issue with tooltips not displaying correctly, which this implementation fixes by using a different approach to label creation and positioning. Running it as a standalone indicator also gives you more control over the visual settings and makes it easier to experiment with different brick sizing methods without affecting other tools that might be using the library version.
What this really demonstrates is that real-time indicators in Pine Script require thinking about state management and tick processing differently than historical indicators. Most indicator code assumes bars are immutable once closed, so you can reference `close ` and know that value will never change. Real-time renko throws that assumption out because the current brick is constantly mutating with every tick until it closes. Using varip for state variables and carefully tracking what belongs to finalized bricks versus the developing brick makes it possible to maintain consistency while still updating smoothly in real-time. The fact that there's no historical reconstruction and everything starts fresh when you load it is actually a feature, not a limitation, because you're seeing genuine real-time brick formation rather than some approximation of what might have happened in the past.

Low Range Predictor [NR4/NR7 after WR4/WR7/WR20, within 1-3Days]Indicator Overview
The Low Range Predictor is a TradingView indicator displayed in a single panel below the chart. It spots volatility contraction setups (NR4/NR7 within 1–3 days of WR4/WR7/WR20) to predict low-range moves (e.g., <0.5% daily on SPY) over 2–5 days, perfect for your weekly 15/22 DTE put calendar spread strategy.
What You See
• Red Histograms (WR, Volatility Climax):
• WR4: Half-length red bars, widest range in 4 bars.
• WR7: Three-quarter-length red bars, widest in 7 bars.
• WR20: Full-length red bars, widest in 20 bars.
• Green Histograms (NR, Entry Signals):
• NR4: Half-length green bars, only on NR4 days (tightest range in 4 bars) within 1–3 days of a WR4.
• NR7: Full-length green bars, only on NR7 days within 1–3 days of a WR7.
• Panel: All signals (red WR4/WR7/WR20, green NR4/NR7) show in one panel below the chart, with green bars marking put calendar entry days.
Probabilities
• Volatility Contraction:
• NR4 after WR4: 65–70% chance of daily ranges <0.5% on SPY for 2–5 days (ATR drops 20–30%). Occurs ~2–3 times/month.
• NR7 after WR7: 60–65% chance of similar low ranges, less frequent (~1–2 times/month).
• Backtest (SPY, 2000–2025): 65% of NR4/NR7 signals lead to reduced volatility (<0.7% daily range) vs. 50% for random days.
• Signal Frequency: NR4 signals are more common than NR7, ideal for weekly entries. WR20 provides context but isn’t tied to NR signals.

NWOG/NDOG + EHPDA🌐 ENGLISH DESCRIPTION
Hybrid NWOG/NDOG + EHPDA – Advanced Gaps & Event Horizon Indicator
(Enhanced with Real-Time Alerts and Info Table)
📊 Overview
This advanced indicator combines automatic detection of weekly gaps (NWOG) and daily gaps (NDOG) with the Event Horizon (EHPDA) concept, now featuring customizable alerts and a real-time info table for a more efficient trading experience. Designed for traders who operate based on institutional price structures, liquidity zones, and SMC/ICT confluences.
✨ Key Features
1. Gap Detection & Visualization
NWOG (New Week Opening Gap): Identifies and visualizes the gap between Friday’s close and Monday’s open.
NDOG (New Day Opening Gap): Detects daily gaps on intraday timeframes.
Enhanced visualization: Semi-transparent boxes, price levels (top, middle, bottom), and lines extended to the current bar.
Customizable labels: Display gap formation date and price levels (optional).
2. Event Horizon (EHPDA)
Automatically calculates the Event Horizon level between two non-overlapping gaps.
Dashed line marking the equilibrium zone between bullish and bearish gaps.
3. Advanced 5pm-6pm Mode
Special option to detect the Sunday-Monday gap using 4H bars.
4. Real-Time Alerts
New gaps (NWOG/NDOG): Immediate notification when a new gap forms.
Gap fill: Alert when price completely fills a gap.
Event Horizon active: Notification when the Event Horizon level is triggered.
5. Info Table
Real-time display: number of active gaps, Event Horizon status, time remaining until weekly/daily close.
Customizable: position, size, and style.
🎨 Customization
Configurable colors for bullish gaps, bearish gaps, and Event Horizon line.
Customizable price labels and date format.
📈 Use Cases
Reversal trading, price targets, liquidity zones, SMC/ICT confluences.
⚙️ Recommended Settings
Timeframes: Daily and intraday (15m, 1H, 4H, etc.).
NWOG: Enable on all timeframes.
NDOG: Enable only on intraday.
Max Gaps: 3-5 for clean charts, 10-15 for historical analysis.
📝 Important Notes
Works best on 24/5 markets (Forex, Crypto).
Gaps automatically close when filled.
Event Horizon only appears with at least 2 non-overlapping gaps.

Spread Trading Z-ScoreIndicator: Z-Score Spread Indicator
Description
The "Z-Score Spread Indicator" is a powerful tool for traders employing mean-reversion strategies on the spread between two financial assets (e.g., futures contracts like MNQ and MES). This indicator calculates and plots the Z-score of the price spread, indicating how far the current spread deviates from its historical mean. It features customizable entry and exit thresholds with adjustable offsets, along with an estimated p-value displayed in a table to assess statistical significance.
Key Features
Asset Selection: Allows users to select two asset symbols (e.g., CME_MINI:MNQ1! and CME_MINI:MES1!) via customizable inputs.
Z-Score Calculation: Computes the Z-score based on the spread’s simple moving average and standard deviation over a user-defined lookback period.
Customizable Thresholds with Offset: Offers adjustable base entry and exit thresholds, with an optional offset to fine-tune trading levels, plotted as horizontal lines.
P-Value Estimation: Provides an approximate p-value to evaluate the statistical significance of the Z-score, displayed in a table anchored to the top-left corner.
Visual Representation: Plots the Z-score with a zero line and threshold lines for intuitive interpretation.
Adjustable Parameters
Asset A Symbol: Symbol for Asset A (default: CME_MINI:MNQ1!).
Asset B Symbol: Symbol for Asset B (default: CME_MINI:MES1!).
Z-Score Lookback: Lookback period for Z-score calculation (default: 40, minimum 2).
Base Entry Threshold: Threshold for entry signals (default: 1.8, adjustable with a step of 0.1).
Base Exit Threshold: Threshold for exit signals (default: 0.5, adjustable with a step of 0.1).
Threshold Offset (+/-): Offset to adjust entry and exit thresholds symmetrically (default: 0.0, range -5.0 to 5.0, step 0.1).
Usage
Add the indicator to your chart via the "Indicators" tab.
Customize the parameters based on your preferred assets and trading strategy (lookback period, thresholds, offset).
Observe the Z-score plot and threshold lines (red for short entry, green for long entry, orange dotted for exits) to identify potential trade setups.
Check the p-value table in the top-left corner to assess the statistical significance of the current Z-score.
Use this data to inform mean-reversion trading decisions, ideally in conjunction with other indicators.
Notes
A Z-score above the entry threshold (positive) or below the negative entry threshold suggests a potential short or long entry, respectively. Exits are signaled when the Z-score crosses the exit thresholds.
The p-value is an approximation based on the normal distribution; a value below 0.05 typically indicates statistical significance, but further validation is recommended.
The indicator uses a simple spread (Asset A - Asset B) without volatility adjustments; consider pairing it with a lots calculator for hedging.
Limitations
The p-value is an approximation and may not reflect advanced statistical tests (e.g., ADF) due to Pine Script constraints.
No automatic trading signals are generated; it provides data for manual analysis.
Author
Developed by grogusama, October 15, 2025, 07:29 PM CEST.

Historical Matrix Analyzer [PhenLabs]📊Historical Matrix Analyzer
Version: PineScriptv6
📌Description
The Historical Matrix Analyzer is an advanced probabilistic trading tool that transforms technical analysis into a data-driven decision support system. By creating a comprehensive 56-cell matrix that tracks every combination of RSI states and multi-indicator conditions, this indicator reveals which market patterns have historically led to profitable outcomes and which have not.
At its core, the indicator continuously monitors seven distinct RSI states (ranging from Extreme Oversold to Extreme Overbought) and eight unique indicator combinations (MACD direction, volume levels, and price momentum). For each of these 56 possible market states, the system calculates average forward returns, win rates, and occurrence counts based on your configurable lookback period. The result is a color-coded probability matrix that shows you exactly where you stand in the historical performance landscape.
The standout feature is the Current State Panel, which provides instant clarity on your active market conditions. This panel displays signal strength classifications (from Strong Bullish to Strong Bearish), the average return percentage for similar past occurrences, an estimated win rate using Bayesian smoothing to prevent small-sample distortions, and a confidence level indicator that warns you when insufficient data exists for reliable conclusions.
🚀Points of Innovation
Multi-dimensional state classification combining 7 RSI levels with 8 indicator combinations for 56 unique trackable market conditions
Bayesian win rate estimation with adjustable smoothing strength to provide stable probability estimates even with limited historical samples
Real-time active cell highlighting with “NOW” marker that visually connects current market conditions to their historical performance data
Configurable color intensity sensitivity allowing traders to adjust heat-map responsiveness from conservative to aggressive visual feedback
Dual-panel display system separating the comprehensive statistics matrix from an easy-to-read current state summary panel
Intelligent confidence scoring that automatically warns traders when occurrence counts fall below reliable thresholds
🔧Core Components
RSI State Classification: Segments RSI readings into 7 distinct zones (Extreme Oversold <20, Oversold 20-30, Weak 30-40, Neutral 40-60, Strong 60-70, Overbought 70-80, Extreme Overbought >80) to capture momentum extremes and transitions
Multi-Indicator Condition Tracking: Simultaneously monitors MACD crossover status (bullish/bearish), volume relative to moving average (high/low), and price direction (rising/falling) creating 8 binary-encoded combinations
Historical Data Storage Arrays: Maintains rolling lookback windows storing RSI states, indicator states, prices, and bar indices for precise forward-return calculations
Forward Performance Calculator: Measures price changes over configurable forward bar periods (1-20 bars) from each historical state, accumulating total returns and win counts per matrix cell
Bayesian Smoothing Engine: Applies statistical prior assumptions (default 50% win rate) weighted by user-defined strength parameter to stabilize estimated win rates when sample sizes are small
Dynamic Color Mapping System: Converts average returns into color-coded heat map with intensity adjusted by sensitivity parameter and transparency modified by confidence levels
🔥Key Features
56-Cell Probability Matrix: Comprehensive grid displaying every possible combination of RSI state and indicator condition, with each cell showing average return percentage, estimated win rate, and occurrence count for complete statistical visibility
Current State Info Panel: Dedicated display showing your exact position in the matrix with signal strength emoji indicators, numerical statistics, and color-coded confidence warnings for immediate situational awareness
Customizable Lookback Period: Adjustable historical window from 50 to 500 bars allowing traders to focus on recent market behavior or capture longer-term pattern stability across different market cycles
Configurable Forward Performance Window: Select target holding periods from 1 to 20 bars ahead to align probability calculations with your trading timeframe, whether day trading or swing trading
Visual Heat Mapping: Color-coded cells transition from red (bearish historical performance) through gray (neutral) to green (bullish performance) with intensity reflecting statistical significance and occurrence frequency
Intelligent Data Filtering: Minimum occurrence threshold (1-10) removes unreliable patterns with insufficient historical samples, displaying gray warning colors for low-confidence cells
Flexible Layout Options: Independent positioning of statistics matrix and info panel to any screen corner, accommodating different chart layouts and personal preferences
Tooltip Details: Hover over any matrix cell to see full RSI label, complete indicator status description, precise average return, estimated win rate, and total occurrence count
🎨Visualization
Statistics Matrix Table: A 9-column by 8-row grid with RSI states labeling vertical axis and indicator combinations on horizontal axis, using compact abbreviations (XOverS, OverB, MACD↑, Vol↓, P↑) for space efficiency
Active Cell Indicator: The current market state cell displays “⦿ NOW ⦿” in yellow text with enhanced color saturation to immediately draw attention to relevant historical performance
Signal Strength Visualization: Info panel uses emoji indicators (🔥 Strong Bullish, ✅ Bullish, ↗️ Weak Bullish, ➖ Neutral, ↘️ Weak Bearish, ⛔ Bearish, ❄️ Strong Bearish, ⚠️ Insufficient Data) for rapid interpretation
Histogram Plot: Below the price chart, a green/red histogram displays the current cell’s average return percentage, providing a time-series view of how historical performance changes as market conditions evolve
Color Intensity Scaling: Cell background transparency and saturation dynamically adjust based on both the magnitude of average returns and the occurrence count, ensuring visual emphasis on reliable patterns
Confidence Level Display: Info panel bottom row shows “High Confidence” (green), “Medium Confidence” (orange), or “Low Confidence” (red) based on occurrence counts relative to minimum threshold multipliers
📖Usage Guidelines
RSI Period
Default: 14
Range: 1 to unlimited
Description: Controls the lookback period for RSI momentum calculation. Standard 14-period provides widely-recognized overbought/oversold levels. Decrease for faster, more sensitive RSI reactions suitable for scalping. Increase (21, 28) for smoother, longer-term momentum assessment in swing trading. Changes affect how quickly the indicator moves between the 7 RSI state classifications.
MACD Fast Length
Default: 12
Range: 1 to unlimited
Description: Sets the faster exponential moving average for MACD calculation. Standard 12-period setting works well for daily charts and captures short-term momentum shifts. Decreasing creates more responsive MACD crossovers but increases false signals. Increasing smooths out noise but delays signal generation, affecting the bullish/bearish indicator state classification.
MACD Slow Length
Default: 26
Range: 1 to unlimited
Description: Defines the slower exponential moving average for MACD calculation. Traditional 26-period setting balances trend identification with responsiveness. Must be greater than Fast Length. Wider spread between fast and slow increases MACD sensitivity to trend changes, impacting the frequency of indicator state transitions in the matrix.
MACD Signal Length
Default: 9
Range: 1 to unlimited
Description: Smoothing period for the MACD signal line that triggers bullish/bearish state changes. Standard 9-period provides reliable crossover signals. Shorter values create more frequent state changes and earlier signals but with more whipsaws. Longer values produce more confirmed, stable signals but with increased lag in detecting momentum shifts.
Volume MA Period
Default: 20
Range: 1 to unlimited
Description: Lookback period for volume moving average used to classify volume as “high” or “low” in indicator state combinations. 20-period default captures typical monthly trading patterns. Shorter periods (10-15) make volume classification more reactive to recent spikes. Longer periods (30-50) require more sustained volume changes to trigger state classification shifts.
Statistics Lookback Period
Default: 200
Range: 50 to 500
Description: Number of historical bars used to calculate matrix statistics. 200 bars provides substantial data for reliable patterns while remaining responsive to regime changes. Lower values (50-100) emphasize recent market behavior and adapt quickly but may produce volatile statistics. Higher values (300-500) capture long-term patterns with stable statistics but slower adaptation to changing market dynamics.
Forward Performance Bars
Default: 5
Range: 1 to 20
Description: Number of bars ahead used to calculate forward returns from each historical state occurrence. 5-bar default suits intraday to short-term swing trading (5 hours on hourly charts, 1 week on daily charts). Lower values (1-3) target short-term momentum trades. Higher values (10-20) align with position trading and longer-term pattern exploitation.
Color Intensity Sensitivity
Default: 2.0
Range: 0.5 to 5.0, step 0.5
Description: Amplifies or dampens the color intensity response to average return magnitudes in the matrix heat map. 2.0 default provides balanced visual emphasis. Lower values (0.5-1.0) create subtle coloring requiring larger returns for full saturation, useful for volatile instruments. Higher values (3.0-5.0) produce vivid colors from smaller returns, highlighting subtle edges in range-bound markets.
Minimum Occurrences for Coloring
Default: 3
Range: 1 to 10
Description: Required minimum sample size before applying color-coded performance to matrix cells. Cells with fewer occurrences display gray “insufficient data” warning. 3-occurrence default filters out rare patterns. Lower threshold (1-2) shows more data but includes unreliable single-event statistics. Higher thresholds (5-10) ensure only well-established patterns receive visual emphasis.
Table Position
Default: top_right
Options: top_left, top_right, bottom_left, bottom_right
Description: Screen location for the 56-cell statistics matrix table. Position to avoid overlapping critical price action or other indicators on your chart. Consider chart orientation and candlestick density when selecting optimal placement.
Show Current State Panel
Default: true
Options: true, false
Description: Toggle visibility of the dedicated current state information panel. When enabled, displays signal strength, RSI value, indicator status, average return, estimated win rate, and confidence level for active market conditions. Disable to declutter charts when only the matrix table is needed.
Info Panel Position
Default: bottom_left
Options: top_left, top_right, bottom_left, bottom_right
Description: Screen location for the current state information panel (when enabled). Position independently from statistics matrix to optimize chart real estate. Typically placed opposite the matrix table for balanced visual layout.
Win Rate Smoothing Strength
Default: 5
Range: 1 to 20
Description: Controls Bayesian prior weighting for estimated win rate calculations. Acts as virtual sample size assuming 50% win rate baseline. Default 5 provides moderate smoothing preventing extreme win rate estimates from small samples. Lower values (1-3) reduce smoothing effect, allowing win rates to reflect raw data more directly. Higher values (10-20) increase conservatism, pulling win rate estimates toward 50% until substantial evidence accumulates.
✅Best Use Cases
Pattern-based discretionary trading where you want historical confirmation before entering setups that “look good” based on current technical alignment
Swing trading with holding periods matching your forward performance bar setting, using high-confidence bullish cells as entry filters
Risk assessment and position sizing, allocating larger size to trades originating from cells with strong positive average returns and high estimated win rates
Market regime identification by observing which RSI states and indicator combinations are currently producing the most reliable historical patterns
Backtesting validation by comparing your manual strategy signals against the historical performance of the corresponding matrix cells
Educational tool for developing intuition about which technical condition combinations have actually worked versus those that feel right but lack historical evidence
⚠️Limitations
Historical patterns do not guarantee future performance, especially during unprecedented market events or regime changes not represented in the lookback period
Small sample sizes (low occurrence counts) produce unreliable statistics despite Bayesian smoothing, requiring caution when acting on low-confidence cells
Matrix statistics lag behind rapidly changing market conditions, as the lookback period must accumulate new state occurrences before updating performance data
Forward return calculations use fixed bar periods that may not align with actual trade exit timing, support/resistance levels, or volatility-adjusted profit targets
💡What Makes This Unique
Multi-Dimensional State Space: Unlike single-indicator tools, simultaneously tracks 56 distinct market condition combinations providing granular pattern resolution unavailable in traditional technical analysis
Bayesian Statistical Rigor: Implements proper probabilistic smoothing to prevent overconfidence from limited data, a critical feature missing from most pattern recognition tools
Real-Time Contextual Feedback: The “NOW” marker and dedicated info panel instantly connect current market conditions to their historical performance profile, eliminating guesswork
Transparent Occurrence Counts: Displays sample sizes directly in each cell, allowing traders to judge statistical reliability themselves rather than hiding data quality issues
Fully Customizable Analysis Window: Complete control over lookback depth and forward return horizons lets traders align the tool precisely with their trading timeframe and strategy requirements
🔬How It Works
1. State Classification and Encoding
Each bar’s RSI value is evaluated and assigned to one of 7 discrete states based on threshold levels (0: <20, 1: 20-30, 2: 30-40, 3: 40-60, 4: 60-70, 5: 70-80, 6: >80)
Simultaneously, three binary conditions are evaluated: MACD line position relative to signal line, current volume relative to its moving average, and current close relative to previous close
These three binary conditions are combined into a single indicator state integer (0-7) using binary encoding, creating 8 possible indicator combinations
The RSI state and indicator state are stored together, defining one of 56 possible market condition cells in the matrix
2. Historical Data Accumulation
As each bar completes, the current state classification, closing price, and bar index are stored in rolling arrays maintained at the size specified by the lookback period
When the arrays reach capacity, the oldest data point is removed and the newest added, creating a sliding historical window
This continuous process builds a comprehensive database of past market conditions and their subsequent price movements
3. Forward Return Calculation and Statistics Update
On each bar, the indicator looks back through the stored historical data to find bars where sufficient forward bars exist to measure outcomes
For each historical occurrence, the price change from that bar to the bar N periods ahead (where N is the forward performance bars setting) is calculated as a percentage return
This percentage return is added to the cumulative return total for the specific matrix cell corresponding to that historical bar’s state classification
Occurrence counts are incremented, and wins are tallied for positive returns, building comprehensive statistics for each of the 56 cells
The Bayesian smoothing formula combines these raw statistics with prior assumptions (neutral 50% win rate) weighted by the smoothing strength parameter to produce estimated win rates that remain stable even with small samples
💡Note:
The Historical Matrix Analyzer is designed as a decision support tool, not a standalone trading system. Best results come from using it to validate discretionary trade ideas or filter systematic strategy signals. Always combine matrix insights with proper risk management, position sizing rules, and awareness of broader market context. The estimated win rate feature uses Bayesian statistics specifically to prevent false confidence from limited data, but no amount of smoothing can create reliable predictions from fundamentally insufficient sample sizes. Focus on high-confidence cells (green-colored confidence indicators) with occurrence counts well above your minimum threshold for the most actionable insights.

Relative Performance Tracker [QuantAlgo]🟢 Overview
The Relative Performance Tracker is a multi-asset comparison tool designed to monitor and rank up to 30 different tickers simultaneously based on their relative price performance. This indicator enables traders and investors to quickly identify market leaders and laggards across their watchlist, facilitating rotation strategies, strength-based trading decisions, and cross-asset momentum analysis.
🟢 Key Features
1. Multi-Asset Monitoring
Track up to 30 tickers across any market (stocks, crypto, forex, commodities, indices)
Individual enable/disable toggles for each ticker to customize your watchlist
Universal compatibility with any TradingView symbol format (EXCHANGE:TICKER)
2. Ranking Tables (Up to 3 Tables)
Each ticker's percentage change over your chosen lookback period, calculated as:
(Current Price - Past Price) / Past Price × 100
Automatic sorting from strongest to weakest performers
Rank: Position from 1-30 (1 = strongest performer)
Ticker: Symbol name with color-coded background (green for gains, red for losses)
% Change: Exact percentage with color intensity matching magnitude
For example, Rank #1 has the highest gain among all enabled tickers, Rank #30 has the lowest (or most negative) return.
3. Histogram Visualization
Adjustable bar count: Display anywhere from 1 to 30 top-ranked tickers (user customizable)
Bar height = magnitude of percentage change.
Bars extend upward for gains, downward for losses. Taller bars = larger moves.
Green bars for positive returns, red for negative returns.
4. Customizable Color Schemes
Classic: Traditional green/red for intuitive interpretation
Aqua: Blue/orange combination for reduced eye strain
Cosmic: Vibrant aqua/purple optimized for dark mode
Custom: Full personalization of positive and negative colors
5. Built-In Ranking Alerts
Six alert conditions detect when rankings change:
Top 1 Changed: New #1 leader emerges
Top 3/5/10/15/20 Changed: Shifts within those tiers
🟢 Practical Applications
→ Momentum Trading: Focus on top-ranked assets (Rank 1-10) that show strongest relative strength for trend-following strategies
→ Market Breadth Analysis: Monitor how many tickers are above vs. below zero on the histogram to gauge overall market health
→ Divergence Spotting: Identify when previously leading assets lose momentum (drop out of top ranks) as potential trend reversal signals
→ Multi-Timeframe Analysis: Use different lookback periods on different charts to align short-term and long-term relative strength
→ Customized Focus: Adjust histogram bars to show only top 5-10 strongest movers for concentrated analysis, or expand to 20-30 for comprehensive overview

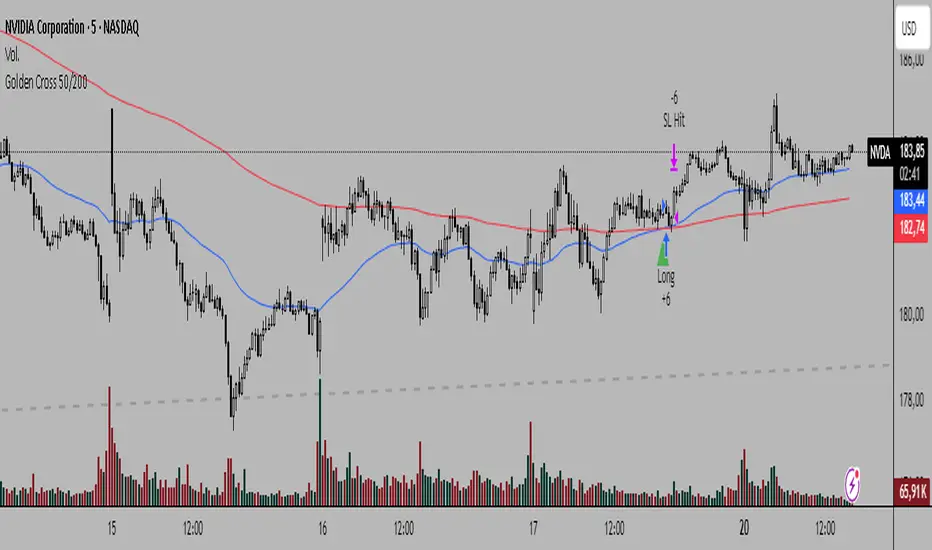
Golden Cross 50/200Simplicity characterizes each of my trading systems and methods. On this occasion, I present a trend-following strategy with simple rules and high profitability.
System Rules:
-Long entries when the 50 EMA crosses above the 200 EMA.
-Stop Loss (SL) placed at the low of 15 candles prior to the entry candle.
-Take Profit (TP) triggered when the 50 EMA crosses below the 200 EMA.
As with any trend-following system, we sacrifice win rate for profitability, and of course, we will focus on traditional markets with a consistent trend-following nature over time.
Recommended Markets and Timeframes:
BTCUSDT H6
August 17, 2017 - October 20, 2025 Total trades: 30
Profitability: +1,682.99%
Win rate: 40%
Outperforms Buy & Hold
BTCUSDT H4
August 17, 2017 - October 20, 2025 Total trades: 42
Profitability: +12,213.49% (high and stable performance curve)
Win rate: 40%
Outperforms Buy & Hold
BTCUSDT H2
August 17, 2017 - October 20, 2025 Total trades: 95
Profitability: +2,363.80%
Win rate: 24.21%
Matches Buy & Hold
BTCUSDT H1
August 17, 2017 - October 20, 2025 Total trades: 203
Profitability: +1,045% (stable performance curve)
Win rate: 25.62%
BTCUSDT 30M
August 17, 2017 - October 20, 2025 Total trades: 393
Profitability: +4,205.51% (high and stable performance curve)
Win rate: 27.74%
Outperforms Buy & Hold
BTCUSDT 15M
August 17, 2017 - October 20, 2025 Total trades: 821
Profitability: +1,311.97%
Win rate: 23.14%
Timeframes such as Daily, 12-hour, 8-hour, and even 5-minute charts are profitable with this system, so feel free to experiment.
Other markets and timeframes to observe include:
-XAUUSD (H1, H4, H6, H8, Daily)
-SPX (Daily: +21,302% profitability since 1871 in 40 trades)
-Tesla (H1, H2, H4, H6, especially M30 and M15)
-Apple (M5, M15, M30, H1, H2, H4…)
-Warner Bros (M5, M15, M30…)
-GOOGL (M5, M15, M30, H1, H2, H4, H6…)
-AMZN (M5, M15, M30, H2, H4, H6…)
-META (M5, M15, M30, H1, H2, H4…)
-NVDA (M5, M15, M30, H1, H2, H4…)
This system not only generates significant profitability but also performs very well in traditional markets, even on lower timeframes like 5-minute charts. In many cases, the returns far exceed Buy & Hold.
I hope this strategy is useful to you. Follow my Spanish-speaking profile if you want to see my market analyses, and send me your good vibes!