在脚本中搜索"科创50和科创100区别"


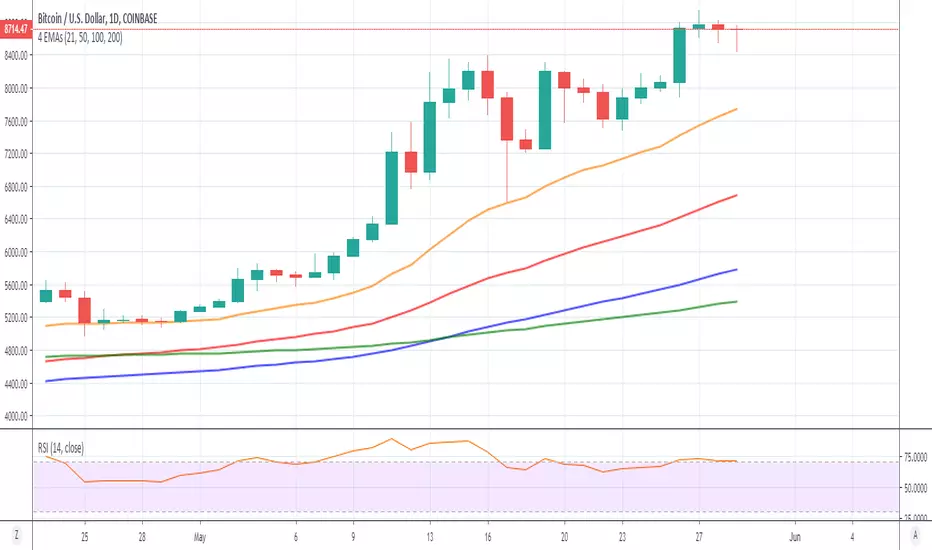
7/20 EMAs 50/100/200 SMAs as One Script.This is one of the scripts I use daily as a full time daytrader. It works well for me to predict MA resistance and support levels and has been very reliable.
Multiple MAs - 1ema, 4smaSimple script that allows you to customize the MA's length & color
(1) EMA - exponential moving average
(4) SMA - slow moving averages
Common SMA's are: 10, 50, 100, 200


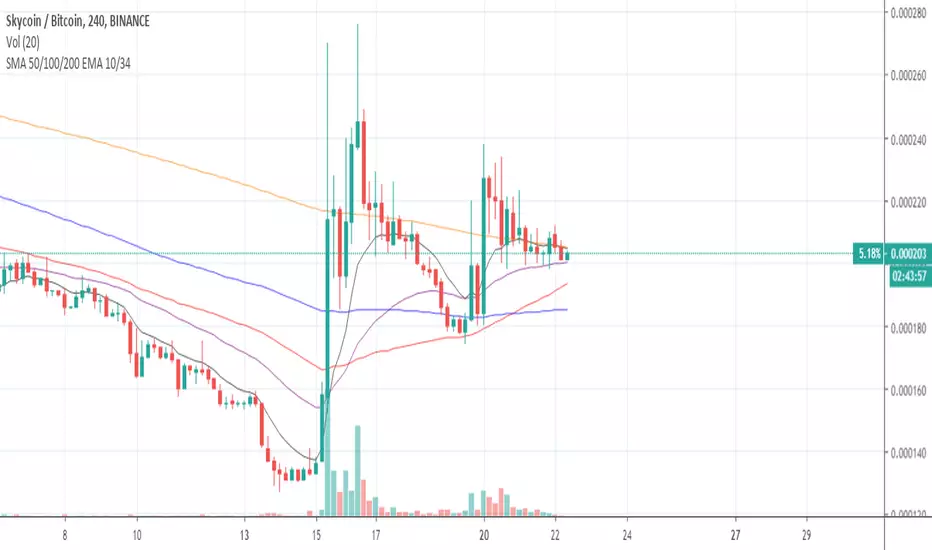
Triple Moving Averages & BBTriple SMAs (default 50 100 200) that turn green when trending up and red when trending down.
Includes standard bollinger bands which can be turned off.
Combines these 4 indicators into just 1.

Moving Averages & Bollinger Bands with ForecastsMoving Averages & Bollinger Bands with Forecasts
11 Moving Averages
SMA, EMA, WMA
Highly Customizable
Linear Regression Forecast
Bollonger Bands
Personal Setup: Add indicator twice
1st indicator = SMA using #4, 7, 10, 11 (20, 50, 100, 200 SMAs) with bollonger bands on 20.
2nd indicator = EMA using #1, 2, 3, 5, 6, 8, 9 (5, 8, 13, 21 ,34, 55, 89 EMAs).
This allows easy toggling between SMAs/Bolls and Fib EMAs
Thank you to yatrader2 for the forecast code

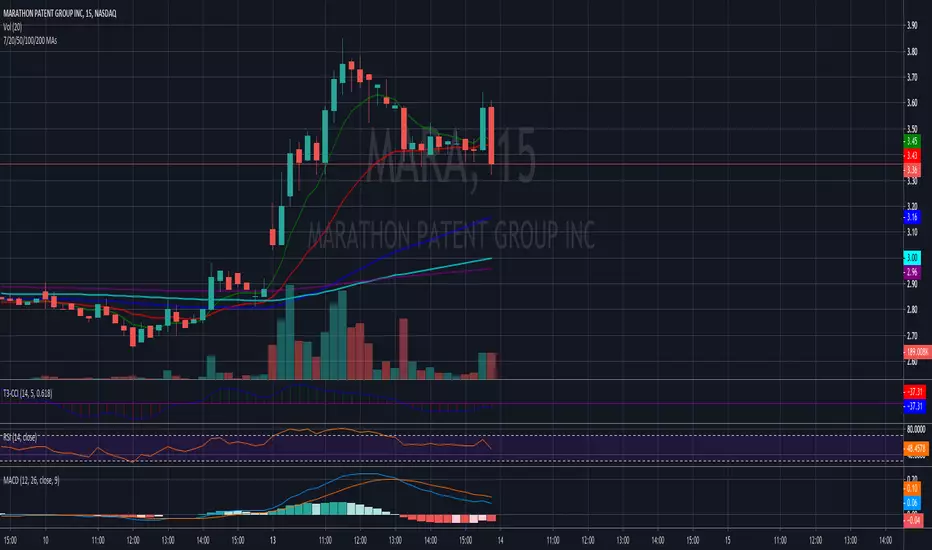
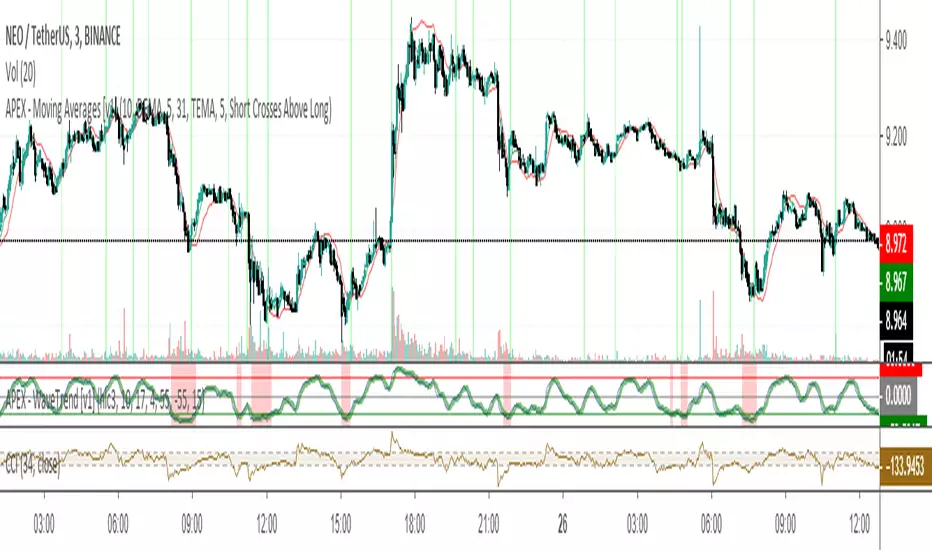
APEX - Moving Averages [v1]A moving average is the most known indicator that takes into consideration price from the last several periods of the price and calculates a smoothed line also known as a Moving average. This way you will cut out a lot of the noise and have a different view.
The most common usage is the moving average crossover system when you buy and sell when a crossover happens. This system is in general not very profitable but can be used effectively in trending markets.
There is really no general rule to what length should be used. The most well-known and respected lengths are 20 / 50 / 100 / 200 for almost all average. These values are respected as strong resistance and support levels. but if you plan to use a crossover Systems the most profitable settings tend to be when the averages are close together 14 and 28 etc. But this is an area I would appeal to for you to really try out what works and what does not.
Other uses of moving averages are the following:
Crossover system
Moving averages are pointing up and price crosses below (Buy Pullback)
The slow-moving average is Below the fast moving average to help to identify possible bullishness
Can be used as support and resistance lines
If you are an advanced user you may want to try out the following techniques:
Create your own moving average by combining several of those together with the source function
Using the Average True Range to create Keltner Channels
Using Standard deviation to create Bollinger bands (Bollinger bands are also accessible on their own)
You can use Moving averages to smooth the noise on other indicators such as RSI / CCI / MFI

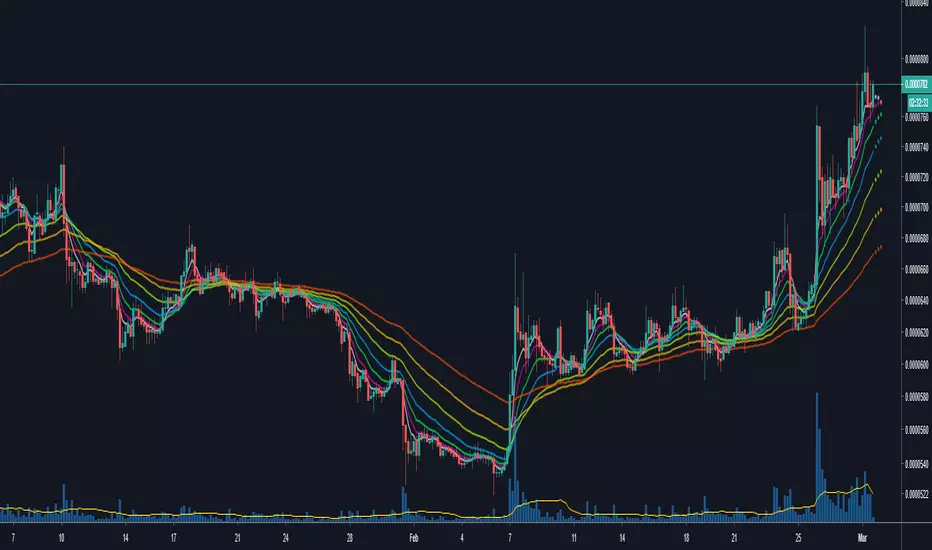
Multiple Simple Moving AveragesOne no-fuss indicator for SMA for 6 different time period (10, 20, 50, 100, 200, 250), styled with sharp and thin line for shorter time period to light-coloured and wide line for longer time period.


Relative Strength to MarketPlots the relative performance of a stock to a chosen market (default: SP500) as a sliding window average over three different time periods (50, 100 & 200 candles)

exponential Moving Averagesall in one ema for a select set i use 12/26 then the longer ones 50,100,200
