Daily Levels Percentual [TOLK] Settings Crypto and ForexPercentage zones refer to specific areas or bands on the price chart of a financial asset that are bounded by percentages of change relative to a reference point, such as the opening price or a reference value from a previous move.
These zones are useful for identifying support and resistance levels, predicting possible price reversals, or setting price targets. For example, on a price chart, you can create percentage zones to observe how the price behaves when it reaches 1%, 2%, 5%, 10%, etc., above or below a certain point.
These zones can be used in conjunction with other technical analysis tools, such as Fibonacci, moving averages, or volume analysis, to improve decision-making in trading strategies.
The default indicator levels are as follows:
SETTINGS Crypto:
Crypto Level 1 > 1.0%
Crypto Level 2 > 1.618%
Crypto Level 3 > 2.0%
Crypto Level 4 > 2.618%
Crypto Level 5 > 3.618%
Crypto Level 6 > 4.618%
Crypto Level 7 > 5.0%
Crypto Level 8 > 7.618%
Crypto Level 9 > 10.0%
Crypto Level 10 > 12.618%
Crypto Level 11 > 13.618%
Crypto Level 12 > 15%
Crypto Level 13 > 17.618%
Crypto Level 14 > 20%
SETTINGS Forex:
Forex Level 1 > 0.10%
Forex Level 2 > 0.1618%
Forex Level 3 > 0.20%
Forex Level 4 > 0.2618%
Forex Level 5 > 0.3618%
Forex Level 6 > 0.4618%
Forex Level 7 > 0.50%
Forex Level 8 > 0.7618%
Forex Level 9 > 1.0%
Forex Level 10 > 1.2618%
Forex Level 11 > 1.3618%
Forex Level 12 > 1.50%
Forex Level 13 > 1.7618%
Forex Level 14 > 2.0%
Percentage Levels This approach helps identify critical price levels where the asset may encounter support or resistance, making it easier to make trading decisions based on price movement patterns.
在脚本中搜索"细算江西救护车家长倒赚了四万三+-医疗花费13万(家长视频)++医保报"

Macro Times [Blu_Ju]About ICT Macro Times:
The Inner Circle Trader (ICT) has taught that there are certain time sessions when the Interbank Price Delivery Algorithm (IPDA) is running a macro. The macro itself could be a repricing macro, a consolidation macro, etc. - this depends on where price currently is in relation to its draw. The times the macro is active do not change however, and are always the following (in New York local time):
8:50-9:10 (premarket macro)
9:50-10:10 (AM macro 1)
10:50-11:10 (AM macro 2)
11:50-12:10 (lunch macro)
13:10-13:40 (PM macro)
15:15-15:45 (final hour macro)
Because these times are fixed, traders can anticipate a setup is likely to form in or around these sessions. Setups may involve sweeps of liquidity (highs/lows), repricing to inefficiencies (e.g., fair value gaps), breaker setups, etc. (The specific setup involved is beyond the scope of this script; this script is concerned with visually marking the time sessions only.)
About this Script:
The scope of this script is to visually identify the macro active time sessions. This script draws vertical lines to mark the start and end of the macro time sessions. Optionally, the user can use a background color for the macro session with or without the vertical lines. The user can also toggle on or off any of the macro sessions, if he or she is only interested in certain ones. The user also has the freedom to change the times of the macro sessions if he or she is interested in a different time.
What makes this script unique is that it plots the macro time sessions after midnight for each day, before the real-time bar reaches the macro times. This is advantageous to the trader, as it gives the trader a visual cue that the macro times are approaching. When watching price it is easy to lose track of time, and the purpose of this script is to help the trader maintain where price is in relation to the macro time sessions in a simple, visual way.

FiboSequFiboSequ: Fibonacci Sequence Marking
Leonardo Fibonacci was an Italian mathematician who lived in the 12th century. His real name was Leonardo of Pisa, but he is commonly known as "Fibonacci." Fibonacci is famous for introducing the Hindu-Arabic numeral system to the Western world. This system is the basis of the modern decimal number system we use today.
Fibonacci Sequence
The Fibonacci sequence is a series of numbers that frequently appears in mathematics and nature. The first two numbers in the sequence are 0 and 1, and each subsequent number is the sum of the two preceding numbers.
The sequence is as follows:
0, 1, 1, 2, 3, 5, 8, 13, 21, 34, 55, 89, 144, 233, 377, 610, 987, 1597, 2584, ...
Fibonacci Time Zones:
Fibonacci time zones are used to identify potential turning points in the market at specific time intervals. These time zones correspond to the Fibonacci sequence in terms of consecutive days or weeks.
The Fibonacci sequence has a wide range of applications in both mathematics and nature. Leonardo Fibonacci's work has had a significant impact on the development of modern mathematics and numeral systems. In financial markets, the Fibonacci sequence and ratios are frequently used by technical analysts to predict and analyze market movements.
Description:
Overview:
The FiboSequ indicator marks significant days on a price chart based on the Fibonacci sequence. This can help traders identify potential turning points or areas of interest in the market. The Fibonacci sequence is a series of numbers where each number is the sum of the two preceding ones, often found in nature and financial markets.
Fibonacci Sequence:
The sequence used in this indicator includes: 1, 3, 5, 8, 13, 21, 34, 55, 89, 144, 233, 377, 610, 987, 1597, and 2584.
These numbers represent the days to be marked on the chart, highlighting possible significant market movements.
How It Works:
User Input:
Users can input the starting date (Year, Month, and Day) from which the Fibonacci sequence will begin to be calculated.
This allows flexibility and customization based on the trader's analysis needs.
Calculation:
The starting date is converted into a timestamp in seconds.
For each bar on the chart, the number of days since the starting date is calculated.
The indicator checks if the current day matches any of the Fibonacci sequence days, the previous day, or the next day.
In this indicator, Fibonacci numbers can be displayed on the chart as plus and minus 2 days. For example, for the 145th day, signals start to appear as 143,144 and 145. This is due to dates that sometimes coincide with weekends and public holidays.
Marking the Chart:
When a match is found, a label is placed above the bar indicating the day number from the Fibonacci sequence.
These labels are colored blue with white text for easy visibility.
Usage:
This indicator can be used on any timeframe and market to help identify potential areas where price might react.
It is especially useful for those who employ Fibonacci analysis in their trading strategy.
Example:
If the starting date is January 1, 2020, the indicator will mark significant Fibonacci days (e.g., 1, 3, 5, 8 days, etc.) on the chart from this date onward.
Community Guidelines Compliance:
This indicator adheres to TradingView's Pine Script community guidelines.
It provides customizable user inputs and does not violate any terms of use.
By using the FiboSequ indicator, traders can enhance their technical analysis by incorporating time-based Fibonacci levels, potentially leading to better market timing and decision-making.
Frequently Asked Questions (FAQ)
Q: What is the FiboSequ indicator?
A: The FiboSequ indicator is a technical analysis tool that marks significant days on a price chart based on the Fibonacci sequence. This indicator helps traders identify potential turning points or areas of interest in the market.
Q: What is the Fibonacci sequence and why is it important?
A: The Fibonacci sequence is a series of numbers where each number is the sum of the two preceding ones. The first two numbers are 0 and 1. This sequence frequently appears in nature and financial markets and is used in technical analysis to identify important support and resistance levels.
Q: How do the Fibonacci time zones in the indicator work?
A: Fibonacci time zones are used to identify potential market turning points at specific time intervals. The indicator calculates days based on the Fibonacci sequence (e.g., 1, 3, 5, 8 days, etc.) from the starting date and marks them on the chart.
Q: How can users set the starting date?
A: Users can input the starting date by specifying the year, month, and day. This sets the date from which the indicator begins its calculations, providing flexibility for user analysis.
Q: What do the labels in the indicator represent?
A: The labels mark specific days in the Fibonacci sequence. For example, 1st day, 3rd day, 5th day, etc. These labels are displayed in blue with white text for easy visibility.
Q: Which timeframes can I use the FiboSequ indicator on?
A: The FiboSequ indicator can be used on any timeframe. This includes daily, weekly, or monthly charts, as well as shorter timeframes.
Q: Which markets can the FiboSequ indicator be used in?
A: The FiboSequ indicator can be used in various financial markets, including stocks, forex, cryptocurrencies, commodities, and more.
Q: How can I achieve better market timing with the FiboSequ indicator?
A: The FiboSequ indicator helps identify potential market turning points using time-based Fibonacci levels. This can lead to better market timing and more informed trading decisions for traders.
-Please feel free to write your valuable comments and opinions. I attach importance to your valuable opinions so that I can improve myself.

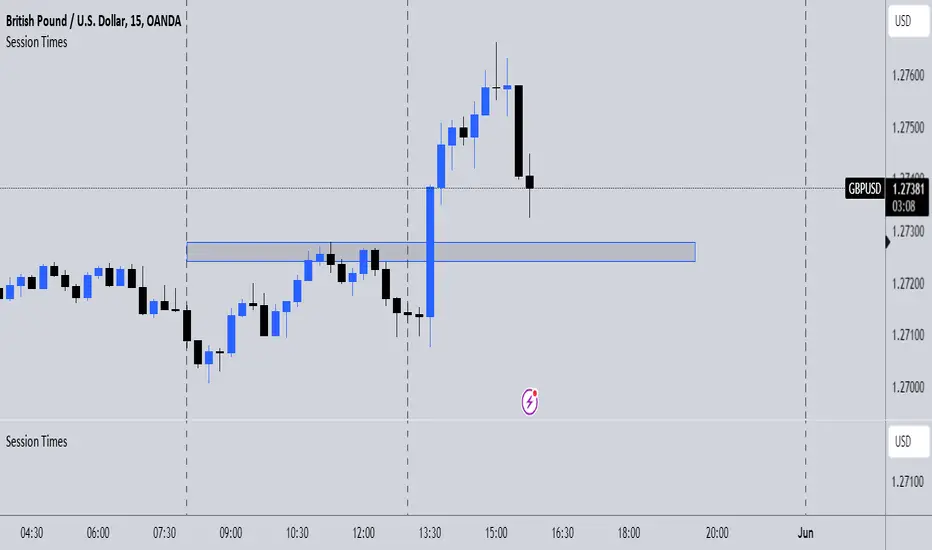
Session TimesDescription:
This indicator simply when enabled will draw dashed lines at each of the session openings. This is based on UTC+1 Time. There will be lines at 00:00 & 08:00 (Asian Session), lines at 08:00 & 13:00 (London Session) and finally lines at 13:00 & 00:00 (New York Session).
Potential Use:
There are many ways you could use this indicator to benefit your trading, but the best way I find is that it makes it clear where the previous highs and lows are of a session, which are potential areas you could trade off. Obviously, there are many other ways you can use this to help you.
How The Script Works:
The way the script works isn't too complicated as it is only a short script. Simply it firstly calculates what are the weekdays (Whenever it isn't Saturday or Sunday). Then from there simply finds the times which I mentioned above, and adds a vertical dashed line there.
Future Updates:
In the future I will mainly be looking to make the indicator more customisable. Firstly, I will look to make it so that the user can adjust the times that the lines are drawn at so it still works wherever you are in the world. I would also like to make it so the user can choose the colour of the lines. If you have any other additions you would like added to this, then feel free to message me.
Qu_Trend+
composition
- Consists of a thick trend line and a thin yellow line.
- The largest (green/red) lines indicate rising and falling markets.
- This line represents the 13-candle moving average of Tilson T3.
- The reason for 13 candles is because it best matches the recent market price based on Bitcoin.
- This value cannot be changed, so if you need it, please modify the public code and use it.
- The yellow line is the MA20 line, the ‘Bollinger Band center line’
(UI will show whether this line has been breakout)
- The same algorithm as 20 of the basic moving average (close standard) is applied.
- The algorithm for breakthrough is calculated based on real-time prices, not based on closing prices.
An additional short-term SMA is created, and whether it crosses the SMA is classified as a breakout/resistance.
How to use it
- If the trend line becomes gentle, it may indicate a change in trend when + MA20 is broken.
- While the slope of the trend line is steep, it indicates that the trend is difficult to change.
(If the trend changes at this time, it is likely to move sideways)
- If the trend changes continuously, it is a sideways market.
At this time, watch out for the movement of the end point where the sideways trend ends.

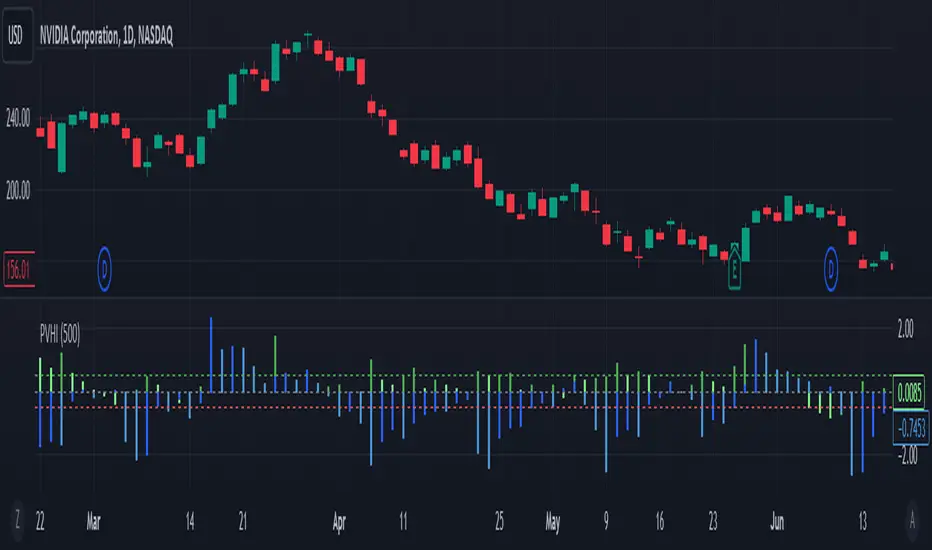
Price Volume Harmony Indicator [Nasan]The indicator "Price Volume Harmony Indicator " (abbreviated as PVHI) combines relative volume intensity (RVI) and relative price change (PC) to identify potential synergy or divergence between price and volume movements. Let's break down the key components and discuss how to interpret the output:
Relative Volume Intensity (RVI):
It calculates the mean volume intensity using simple moving averages (SMA) of different periods (5, 8, 13, and 144).
It then computes point volume intensity based on the current volume compared to the previous bar's volume.
The final RVI is a combination of mean and point volume intensities.
Relative Price Change (PC):
It calculates the median absolute deviation (MAD) and the price change relative to MAD for three different lengths (5, 8, and 13).
The average relative PC is a weighted combination of the three PC values.
Normalization:
RVI and PC are normalized using Z-scores (standard scores) to bring them to the same scale. This enables easier comparison.
Histogram Plotting:
The RVI and PC are plotted as histograms below the main price chart. Green color bars represent RVI, and blue color bars indicate PC. The RVI bars are light green when the RVI values are decreasing compared to previous bar. Similarly, when PC bars are light blue it indicates that the PC values are decreasing compared to previous bars.
There is a zero line +/- 0.5 SD lines movements above and below the SD lines are practically
significant.
Interpretation :
(1) Strong Bullish Movement :
This is when both the green bars (RVI) and blue bars (PC) increases and are on the same side above zero .
(2) Strong Bearish Movement :
This is when the green bars (RVI) increases and blue bars (PC) decreases. The green bars above zero but blue bars below zero.
(3) Weak Bullish Movement :
This is when the green bars (RVI) decreases and are below zero but the blue bars (PC) increases and are above zero .
(2) Weak Bearish Movement :
This is when both the green bars (RVI) and blue bars (PC) decreases. The green bars and blue bars are below zero.
This output is slightly hard to read but with practice can be read easily.
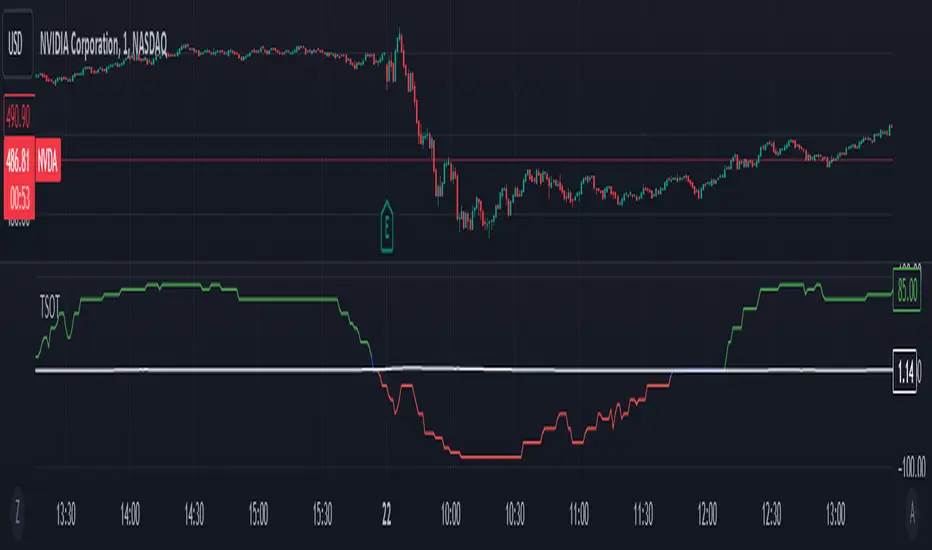
Trend Strength Over TimeThe script serves as an indicator designed to assess and visualize trend strength and Volume strength over time. It employs a variety of calculations and conditions to offer insights into both bullish and bearish market trends. Let's explore the key conceptual elements of the code.
Trend Strength Conditions:
The script defines conditions to assess trend strength based on a comparison between each calculated percentile value and the highest high (bullish) or lowest low (bearish). Separate conditions are established for each percentile length, allowing for a nuanced understanding of trend dynamics across different timeframes.
Counting Bull and Bear Trends:
To quantify the strength of bullish and bearish trends, the script maintains counts for the number of conditions that are true for each. This count-based approach provides a quantitative measure of trend strength.
Weak Bull and Bear Counts:
Recognizing that trends are not always clear-cut, the script introduces the concept of weak trends. It counts instances where the percentiles fall between the highest high and lowest low, indicating a potential weakening of the prevailing trend.
Bull and Bear Strength:
Bull and bear strengths are calculated based on the counts, with adjustments made for weak trends. This step provides a more nuanced and comprehensive assessment of trend strength by considering both strong and weak signals.
Current Trend Value:
The culmination of these calculations is the determination of the current trend value. This value represents the balance between bullish and bearish forces, offering a dynamic indicator of the market's prevailing sentiment.
Volume Strength Calculation:
In addition to price-based indicators, the script incorporates volume strength as a crucial element. This is calculated using the simple moving averages (SMAs) of volume over different lengths, normalized relative to the SMA over a length of 144. Volume strength adds a layer of confirmation or divergence to the price-based trend analysis.
Color Change:
To facilitate quick and intuitive interpretation, the script dynamically changes the color of the plotted line on the chart based on the current trend value. Green indicates a bullish trend, red indicates a bearish trend, and blue suggests a neutral or indecisive market.
Plotting:
The script uses the plot function to visually present the calculated trend strength and volume strength on the chart. This visual representation aids traders in making informed decisions based on the identified trends and their strengths.
Volume Strength: A Detailed Explanation
In the context of the provided script, volume strength is a critical component used to assess the strength of a market trend. It provides insights into the level of participation and commitment of market participants, offering a complementary perspective to traditional price-based indicators. Let's delve into the concept and practical applications of volume strength.
Calculation of Volume Strength:
The script calculates volume strength by considering the simple moving averages (SMAs) of volume over different time periods (13, 21, 34, 55, 89). These individual SMAs are then normalized relative to the SMA over a more extended period of 144. The weights assigned to each SMA in the calculation are defined in the variable VCF (Volume Correction Factor).
Calculation of Volume Strength with Weights: The weights assigned to each SMA in this calculation are crucial for emphasizing the significance of shorter-term volume movements relative to a longer-term baseline.
Interpretation of Weights:
The choice of weights reflects the relative importance of shorter-term volume movements compared to longer-term trends. In this script, shorter-term SMAs (13, 21, 34, 55, 89) are assigned decreasing weights, while the longer-term SMA (144) serves as the baseline.
Shorter-term SMAs with higher weights may have a more immediate impact on the volume strength calculation. This implies that recent changes in volume carry more weight in assessing the current market conditions.
The decreasing weights for shorter-term SMAs might indicate that, as the timeframe lengthens, the significance of recent volume movements diminishes in relation to the longer-term trend. This approach allows for a focus on both short-term volatility and longer-term stability in volume patterns.
The purpose of normalization is to emphasize the current volume's significance in comparison to its historical context. This can help identify abnormal volume spikes or sustained increases in trading activity, which may indicate the strength or weakness of a trend.
Interpretation and Practical Use:
Confirmation of Trend:
Rising volume during an uptrend can validate the strength of the upward movement, suggesting that a significant number of market participants are actively buying. Conversely, decreasing volume during an uptrend might indicate weakening interest and a potential reversal.
In a downtrend, increasing volume on downward price movements reinforces the strength of the trend. A decrease in volume during a downtrend may suggest a potential weakening or exhaustion of the downward momentum.
Divergence Analysis:
Divergence occurs when there is a disagreement between the price movement and the corresponding volume. For example, if prices are rising but volume is declining, it could signal a lack of conviction in the upward movement, and a reversal might be imminent.
Conversely, if prices are falling, but volume is decreasing as well, it might suggest that the downward momentum is losing steam, and a potential reversal or consolidation could be on the horizon.
In conclusion, volume strength analysis provides traders with a powerful tool to gauge the conviction behind price movements. By incorporating volume data into the technical analysis, one can make more informed decisions, enhance trend identification, and improve risk management strategies.
Scoopy StacksWaffle Around Multiple
(Open, High, Low, Close) Stacks On
Pre/Post Market & (Daily, Weekly,
Monthly, Yearly) Sessions With
Meticulous Columns, Rows, Tooltips,
Colors, Custom Ideas, and Alerts.
Sessions Use Two Step Incremental Values
Default Value: (1) Shows Two Previous
(O, H, L, C); Increasing Value Swaps
Sessions With Next Two Stacks.
⬛️ KEY WORDS:
🟢 Crossover | 🔴 Crossunder
📗 High | 📕 Low
📔 Open | 📓 Close
🥇 First Idea | 🥈 Second Idea
🥉 Third Idea | 🎖️ Fourth Idea
🟥 ALERTS:
Default Option: (Per Bar)
Alerts Once Conditions Are Met
(Bar Close) Alerts When Bar Closes
Default Option: (Reg)
Alerts During Regular Market
Trading Hours, (0930-1600)
(Ext) Alerts During Extended
Market Hours, (1600-0930)
(24/7) Alerts All Day
Optional Preferences:
Regular Alerts - Stocks
Extended Alerts - Futures
24/7 Alerts - Crypto
🟧 STACKS:
Default Value: (1)
Incremental Stack Value, Increasing Value
Swaps Sessions With the Next Two Stacks
(✓) Swap Stacks?
Pre/Post Market High/Lows,
1-2 Day High/Lows, 1-2 Week High/Lows,
1-2 Month High/Lows, 1-2 Year High/Lows
( ) Swap Stacks?
Pre/Post Market Open/Close,
1-2 Day Open/Close, 1-2 Week Open/Close,
1-2 Month Open/Close, 1-2 Year Open/Close
🟨 EXAMPLES:
Default Stack:
🟢 | 📗 Pre Market High (PRE) | 4600.00
🔴 | 📕 Post Market Low (POST) | 420.00
Optional: (Open)
🟢 | 📔 Post Market Open (POST) | 4400.00
Optional: (Close)
🔴 | 📓 Pre Market Close (PRE) | 430.00
Default Stack Value: (1)
🔴 | 📗 1 Day High (1DH) | 460.00
Next Stack Value: (3)
🟢 | 📕 4 Day Low (4DL) | 420.00
Optional: (Open)
🔴 | 📔 2 Day Open (2DO) | 440.00
Optional: (Close)
🟢 | 📓 3 Day Close (3DC) | 430.00
Default Stack Value: (5)
🟢 | 📗 5 Week High (5WH) | 460.00
Next Stack Value: (7)
🔴 | 📕 8 Week Low (8WL) | 420.00
Optional: (Open)
🔴 | 📔 7 Week Open (7WO) | 4400.00
Optional: (Close)
🟢 | 📓 6 Week Close (6WC) | 430.00
Default Stack Value: (9)
🔴 | 📗 9 Month High (9MH) | 460.00
Next Stack Value: (11)
🟢 | 📕 12 Month Low (12ML) | 420.00
Optional: (Open)
🟢 | 📔 11 Month Open (11MO) | 4400.00
Optional: (Close)
🔴 | 📓 10 Month Close (10MC) | 430.00
Default Stack Value: (13)
🟢 | 📗 13 Year High (13YH) | 460.00
Next Stack Value: (15)
🟢 | 📕 16 Year Low (16YL) | 420.00
Optional: (Open)
🔴 | 📔 15 Year Open (15YO) | 4400.00
Optional: (Close)
🔴 | 📓 14 Year Close (14YC) | 430.00
🟩 TABLES:
Default Value: (1)
Moves Table Up, Down, Left, or Right
Based on Second Default Value
First Default Value: (Top Right)
Sets Table Placement, Middle Center
Allows Table To Move In All Directions
Second Default Value: (Default)
Fixed Table Position, Switching Values
Moves Direction of the Table
🟦 IDEAS:
(✓) Show Ideas?
Shows Four Ideas With Custom Texts
and Values; Ideas Are Based Around
Post-It Note Reminders with Alerts
Suggestions For Text Ideas:
Take Profit, Stop Loss, Trim, Hold,
Long, Short, Bounce Spot, Retest,
Chop, Support, Resistance, Buy, Sell
🟪 EXAMPLES:
Default Value: (5)
Shows the Custom Table Value For
Sorted Table Positions and Alerts
Default Text: (🥇)
Shown On First Table Cell and
Message Appearing On Alerts
Alert Shows: 🟢 | 🥇 | 5.00
Default Value: (10)
Shows the Custom Table Value For
Sorted Table Positions and Alerts
Default Text: (🥈)
Shown On Second Table Cell and
Message Appearing On Alerts
Alert Shows: 🔴 | 🥈 | 10.00
Default Value: (50)
Shows the Custom Table Value For
Sorted Table Positions and Alerts
Default Text: (🥉)
Shown On Third Table Cell and
Message Appearing On Alerts
Alert Shows: 🟢 | 🥉 | 50.00
Default Value: (100)
Shows the Custom Table Value For
Sorted Table Positions and Alerts
Default Text: (🎖️)
Shown On Fourth Table Cell and
Message Appearing On Alerts
Alert Shows: 🔴 | 🎖️ | 100.00
⬛️ REFERENCES:
Pre-market Highs & Lows on regular
trading hours (RTH) chart
By Twingall
Previous Day Week Highs & Lows
By Sbtnc
Screener for 40+ instruments
By QuantNomad
Daily Weekly Monthly Yearly Opens
By Meliksah55

Ribbit RangesBounce Around Multiple
(Open, High, Low, Close) Ranges
On Pre/Post Market & (Daily, Weekly,
Monthly, Yearly) Sessions With
Meticulous Lines, Labels, Tooltips,
Colors, Custom Ideas, and Alerts.
Sessions Use Two Step Incremental Values
Default Value: (1) Shows Two Previous
(O, H, L, C); Increasing Value Swaps
Sessions With Next Two Ranges.
⬛️ KEY WORDS:
🟢 Crossover | 🔴 Crossunder
📗 High | 📕 Low
📔 Open | 📓 Close
🥇 First Idea | 🥈 Second Idea
🥉 Third Idea | 🎖️ Fourth Idea
🟥 ALERTS:
Default Option: (Per Bar)
Alerts Once Conditions Are Met
(Bar Close) Alerts When Bar Closes
Default Option: (Reg)
Alerts During Regular Market
Trading Hours, (0930-1600)
(Ext) Alerts During Extended
Market Hours, (1600-0930)
(24/7) Alerts All Day
Optional Preferences:
Regular Alerts - Stocks
Extended Alerts - Futures
24/7 Alerts - Crypto
🟧 RANGES:
Default Value: (1)
Incremental Range Value, Increasing Value
Swaps Sessions With the Next Two Ranges
(✓) Swap Ranges?
Pre/Post Market High/Lows,
1-2 Day High/Lows, 1-2 Week High/Lows,
1-2 Month High/Lows, 1-2 Year High/Lows
( ) Swap Ranges?
Pre/Post Market Open/Close,
1-2 Day Open/Close, 1-2 Week Open/Close,
1-2 Month Open/Close, 1-2 Year Open/Close
🟨 EXAMPLES:
Default Range:
🟢 | 📗 Pre Market High (PRE) | 4600.00
🔴 | 📕 Post Market Low (POST) | 420.00
Optional: (Open)
🟢 | 📔 Post Market Open (POST) | 4400.00
Optional: (Close)
🔴 | 📓 Pre Market Close (PRE) | 430.00
Default Range Value: (1)
🔴 | 📗 1 Day High (1DH) | 460.00
Next Range Value: (3)
🟢 | 📕 4 Day Low (4DL) | 420.00
Optional: (Open)
🔴 | 📔 2 Day Open (2DO) | 440.00
Optional: (Close)
🟢 | 📓 3 Day Close (3DC) | 430.00
Default Range Value: (5)
🟢 | 📗 5 Week High (5WH) | 460.00
Next Range Value: (7)
🔴 | 📕 8 Week Low (8WL) | 420.00
Optional: (Open)
🔴 | 📔 7 Week Open (7WO) | 4400.00
Optional: (Close)
🟢 | 📓 6 Week Close (6WC) | 430.00
Default Range Value: (9)
🔴 | 📗 9 Month High (9MH) | 460.00
Next Range Value: (11)
🟢 | 📕 12 Month Low (12ML) | 420.00
Optional: (Open)
🟢 | 📔 11 Month Open (11MO) | 4400.00
Optional: (Close)
🔴 | 📓 10 Month Close (10MC) | 430.00
Default Range Value: (13)
🟢 | 📗 13 Year High (13YH) | 460.00
Next Range Value: (15)
🟢 | 📕 16 Year Low (16YL) | 420.00
Optional: (Open)
🔴 | 📔 15 Year Open (15YO) | 4400.00
Optional: (Close)
🔴 | 📓 14 Year Close (14YC) | 430.00
🟩 COLORS:
(✓) Swap Colors?
Text Color Is Shown Using
Background Color
( ) Swap Colors?
Background Color Is Shown
Using Text Color
🟦 IDEAS:
(✓) Show Ideas?
Plots Four Ideas With Custom Lines
and Labels; Ideas Are Based Around
Post-It Note Reminders with Alerts
Suggestions For Text Ideas:
Take Profit, Stop Loss, Trim, Hold,
Long, Short, Bounce Spot, Retest,
Chop, Support, Resistance, Buy, Sell
🟪 EXAMPLES:
Default Value: (5)
Shows the Custom Value For
Lines, Labels, and Alerts
Default Text: (🥇)
Shown On First Label and
Message Appearing On Alerts
Alert Shows: 🟢 | 🥇 | 5.00
Default Value: (10)
Shows the Custom Value For
Lines, Labels, and Alerts
Default Text: (🥈)
Shown On Second Label and
Message Appearing On Alerts
Alert Shows: 🔴 | 🥈 | 10.00
Default Value: (50)
Shows the Custom Value For
Lines, Labels, and Alerts
Default Text: (🥉)
Shown On Third Label and
Message Appearing On Alerts
Alert Shows: 🟢 | 🥉 | 50.00
Default Value: (100)
Shows the Custom Value For
Lines, Labels, and Alerts
Default Text: (🎖️)
Shown On Fourth Label and
Message Appearing On Alerts
Alert Shows: 🔴 | 🎖️ | 100.00
⬛️ REFERENCES:
Pre-market Highs & Lows on regular
trading hours (RTH) chart
By Twingall
Previous Day Week Highs & Lows
By Sbtnc
Screener for 40+ instruments
By QuantNomad
Daily Weekly Monthly Yearly Opens
By Meliksah55

Fiboborsa+BistTitle: "Fiboborsa+Bist Indicator for TradingView"
Description: The "Fiboborsa+Bist" indicator is a powerful tool designed for TradingView users. This indicator offers a comprehensive set of technical indicators to assist you in your technical analysis and trading decisions.
Features:
Simple Moving Averages (SMA): You can enable or disable SMA with different periods (20, 50, 100, 200) to observe different timeframes and trends.
SMA Strategy: Use SMA crossovers to determine trends. Watch for the 20-period SMA crossing above the 50-period SMA for a bullish signal. For a bearish signal, observe the 50-period SMA crossing below the 100-period SMA.
Exponential Moving Averages (EMA): Similar to SMA, you can enable or disable EMA with different periods (5, 8, 14, 21, 34, 55, 89, 144, 233) for more precise trend analysis.
EMA Strategy: Use EMA crossovers and crossunders for short-term trend changes. A buy signal may occur when the 5-period EMA crosses above the 14-period EMA, while a crossunder suggests a selling opportunity.
Weighted Moving Averages (WMA): Customize WMA settings with various periods (5, 13, 21, 34, 89, 144, 233, 377, 610, 987) to suit your trading style.
WMA Strategy: Use WMA crossovers to verify trends. When the 13-period WMA crosses above the 34-period WMA, it may indicate an uptrend.
Buy and Sell Signals: The indicator provides buy and sell signals based on EMA crossovers and crossunders. Strong signals are also highlighted.
EMA Buy and Sell Strategy: Make informed trading decisions using buy and sell signals generated by EMA crossovers and crossunders.
Ichimoku Cloud: You can enable the Ichimoku Cloud for a clear visual representation of support and resistance levels.
Ichimoku Strategy: Use the Ichimoku Cloud to determine trend direction. Entering long positions is common when the price is above the cloud and considering short positions when it's below the cloud. Verify the trend with the Chikou Span.
Bollinger Bands: Easily visualize price volatility by enabling the Bollinger Bands feature.
Bollinger Bands Strategy: Bollinger Bands help you visualize price volatility. Look for potential reversal points when the price touches or crosses the upper or lower bands.
Use the "Fiboborsa+Bist" indicator to enhance your trading strategies and make informed decisions in the dynamic world of financial markets.
Additional Information:
Bollinger Bands: Bollinger Bands are a technical analysis tool used to monitor price volatility and determine overbought or oversold conditions. This indicator consists of three components:
Middle Moving Average (SMA): Typically, a 20-day SMA is used.
Upper Band: Calculated by adding two times the standard deviation to the SMA.
Lower Band: Calculated by subtracting two times the standard deviation from the SMA.
As the price moves between these two bands, it becomes possible to identify potential buying or selling points by comparing its height or low with these bands.
Ichimoku Cloud: The Ichimoku Cloud is a comprehensive indicator used for trend identification, defining support and resistance levels, and measuring trend strength. The Ichimoku Cloud comprises five key components:
Tenkan Sen (Conversion Line): Used to identify short-term trends.
Kijun Sen (Base Line): Used to identify medium-term trends.
Senkou Span A (Leading Span A): Calculated as (Tenkan Sen + Kijun Sen) / 2 and shows future support and resistance levels.
Senkou Span B (Leading Span B): Calculated as (highest high + lowest low) / 2 and indicates future support and resistance levels.
Chikou Span (Lagging Line): Enables tracking the price backward.
The Ichimoku Cloud interprets a price above the cloud as an uptrend and below the cloud as a downtrend. The Chikou Span assists in verifying the current trend.
ADDITIONAL STRATEGY WITH RSI AND MACD INDICATORS
**Strategy: Two-Stage Trading Strategy Using RSI, MACD, and Fiboborsa+Bist Indicators**
**Stage 1: Determining the Trend and Selecting the Trading Direction**
1. **Trend Identification with Fiboborsa+Bist Indicator:**
- Analyze the simple moving averages (SMA), exponential moving averages (EMA), and weighted moving averages (WMA) used with the Fiboborsa+Bist indicator. These indicators will provide information about the direction of the market trend.
2. **Identifying Overbought and Oversold Conditions with RSI:**
- Use the RSI indicator to identify overbought (70 and above) and oversold (30 and below) conditions. This helps in measuring the strength of the trend. If RSI enters the overbought zone, a downward correction is likely. If RSI enters the oversold zone, an upward correction is probable.
3. **Evaluating Momentum with MACD:**
- Examine price momentum using the MACD indicator. When the MACD line crosses above the signal line, it may indicate an increasing upward momentum. Conversely, a downward cross can suggest an increasing downward momentum.
**Stage 2: Generating Buy and Sell Signals**
4. **Combining RSI, MACD, and Fiboborsa+Bist Indicators:**
- To generate a buy signal, wait for RSI to move out of the oversold region into an uptrend and for the MACD line to cross above the signal line.
- To generate a sell signal, wait for RSI to move out of the overbought region into a downtrend and for the MACD line to cross below the signal line.
5. **Confirmation with Fiboborsa+Bist Indicator:**
- When you receive a buy or sell signal, use the Fiboborsa+Bist indicator to confirm the market trend. Confirming the trend can strengthen your trade signals.
6. **Setting Stop-Loss and Take-Profit Levels:**
- Remember to manage risk when opening buy or sell positions. Set stop-loss and take-profit levels to limit your risk.
7. **Monitor and Adjust Your Trades:**
- Continuously monitor your trade positions and adjust your strategy as per market conditions.
This two-stage trading strategy offers the ability to determine trends and generate trade signals using different indicators. However, every trading strategy involves risks, so risk management and practical application are essential. Also, it's recommended to test this strategy in a demo account before using it in a real trading account.

YinYang Bar ForecastOverview:
YinYang Bar Forecast is a prediction indicator. It predicts the movement for High, Low, Open and Close for up to 13 bars into the future. We created this Indicator as we felt the TradingView community could benefit from a bar forecast as there wasn’t any currently available.
Our YinYang Bar Forecast is something we plan on continuously working on to better improve it, but at its current state it is still very useful and decently accurate. It features many calculations to derive what it thinks the future bars will hold. Let’s discuss some of the logic behind it:
Each bar has its High, Low, Open and Close calculated individually for highest accuracy. Within these calculations we first check which bar it is we are calculating and base our span back length that we are getting our data from based on the bar index we are generating. This helps us get a Moving Average for this bar index.
We take this MA and we apply our Custom Volume Filter calculation on it, which is essentially us dividing the current bars volume over the average volume in the last ‘Filtered Length’ (Setting) length. We take this decimal and multiply it on our MA and smooth it out with a VWMA.
We take the new Volume Filtered MA and apply a RSI Filter calculation on it. RSI Filter is where we take the difference between the high and low of this bar and we multiply it with an RSI calculation using our Volume Filtered MA. We take the result of that multiplication and either add or subtract it from the Volume Filtered MA based on if close > open. This makes our RSI Filtered MA.
Next, we do an EMA Strength Calculation which is where we check if close > ema(close, ‘EMA Averaged Length’) (Setting). Based on this condition we assign a multiplier that is applied to our RSI Filtered MA. We divide by how many bars we are predicting and add a bit to each predictive bar so that the further we go into the future the stronger the strength is.
Next we check RSI and RSI MA levels and apply multiplications based on its RSI levels and if it is greater than or less than the MA. Also it is affected by if the RSI is <= 30 and >= 70.
Finally we check the MFI and MFI MA levels and like RSI we apply multiplications based on its MFI levels and if it is greater than or less than the MA. It is also affected by if the MFI is <= 30 and >= 70.
Please note the way we calculate this may change in the future, this is just currently what we deemed works best for forecasting the future bars. Also note this script uses MA calculations out of scope for efficiency but there is potential for inconsistencies.
Innately it’s main use is the projection it provides. It only draws the bars for realtime bars and not historical ones, so the best way to backtest it is with TradingView’s Replay Tool.
Well, enough of the logic behind it, let's get to understanding how to use it:
Tutorial:
So unfortunately we aren’t able to plot legit bars/candles into the future so we’ve had to do a bit of a work around using lines and fills. As you can see here we have 4 Lines and 3 Zones:
Lines:
Green: Represents the High
Orange: Represents the Open
Teal: Represents the Close
Red: Represents the Low
Zones:
High Zone: This zone is from either Open or Close to the High and is ALWAYS filled with Green.
Open/Close Zone: This zone is from the Open to the Close and is filled with either Green or Red based on if it's greater than the previous bar (real or forecasted).
Low Zone: This zone is from either Open or Close to the Low and is ALWAYS filled with Red.
As you can see generally the Forecasted bars are generally within strong pivot locations and are a good estimation of what will likely go on. Please note, the WHOLE structure of the prediction can change based on the current bars movements and the way it affects the calculations.
Let's look 1 bar back from the current bar just so we can see what it used to Forecast:
As you can see it has changed quite a bit from the previous bar, but if you look close, we drew horizontal lines around where its projecting the next bar to be (our current realtime bar), if we go back to the live chart:
Its projections were pretty close for the high and low. Generally, right now at least, it does a much better job at predicting the high and low than it does the open and close, however we will do our best to fine tune that in future updates.
Remember, this indicator is not meant to base your trades on, but rather give you a Forecast towards the general direction of the next few bars. Somewhat like weather, the farther the bar (or day for weather), the harder it is to predict. For this reason we recommend you focusing on the first few bars as they are more accurate, but review the further ones as they may help show the trend and the way that pair will move.
We will conclude this tutorial here, hopefully this Predictive Indicator can be of some help and use to you. If you have any questions, comments, ideas or concerns please let us know.
Settings:
Forecast Length: How many bars should we predict into the Future? Max 13
Each Bar Length Multiplier: For each new Forecast bar, how many more bars are averaged? Min 2
VWMA Averaged Length: All Forecast bars are put into a VWMA, what length should we use?
EMA Averaged Length: All Forecast bars are put into a EMA, what length should we use?
Filtered Length: What length should we use for Filtered Volume and RSI?
EMA Strength Length: What length should we use for the EMA Strength
HAPPY TRADING!

Z-Score Based Momentum Zones with Advanced Volatility ChannelsThe indicator "Z-Score Based Momentum Zones with Advanced Volatility Channels" combines various technical analysis components, including volatility, price changes, and volume correction, to calculate Z-Scores and determine momentum zones and provide a visual representation of price movements and volatility based on multi timeframe highest high and lowest low values.
Note: THIS IS A IMPROVEMNT OF "Multi Time Frame Composite Bands" INDICATOR OF MINE WITH MORE EMPHASIS ON MOMENTUM ZONES CALULATED BASED ON Z-SCORES
Input Options
look_back_length: This input specifies the look-back period for calculating intraday volatility. correction It is set to a default value of 5.
lookback_period: This input sets the look-back period for calculating relative price change. The default value is 5.
zscore_period: This input determines the look-back period for calculating the Z-Score. The default value is 500.
avgZscore_length: This input defines the length of the momentum block used in calculations, with a default value of 14.
include_vc: This is a boolean input that, if set to true, enables volume correction in the calculations. By default, it is set to false.
1. Volatility Bands (Composite High and Low):
Composite High and Low: These are calculated by combining different moving averages of the high prices (high) and low prices (low). Specifically:
a_high and a_low are calculated as the average of the highest (ta.highest) and lowest (ta.lowest) high and low prices over various look-back periods (5, 8, 13, 21, 34) to capture short and long-term trends.
b_high and b_low are calculated as the simple moving average (SMA) of the high and low prices over different look-back periods (5, 8, 13) to smooth out the trends.
high_c and low_c are obtained by averaging a_high with b_high and a_low with b_low respectively.
IDV Correction Calulation : In this script the Intraday Volatility (IDV) is calculated as the simple moving average (SMA) of the daily high-low price range divided by the closing price. This measures how much the price fluctuates in a given period.
Composite High and Low with Volatility: The final c_high and c_low values are obtained by adjusting high_c and low_c with the calculated intraday volatility (IDV). These values are used to create the "Composite High" and "Composite Low" plots.
Composite High and Low with Volatility Correction: The final c_high and c_low values are obtained by adjusting high_c and low_c with the calculated intraday volatility (IDV). These values are used to create the "Composite High" and "Composite Low" plots.
2. Momentum Blocks Based on Z-Score:
Relative Price Change (RPC):
The Relative Price Change (rpdev) is calculated as the difference between the current high-low-close average (hlc3) and the previous simple moving average (psma_hlc3) of the same quantity. This measures the change in price over time.
Additionally, std_hlc3 is calculated as the standard deviation of the hlc3 values over a specified look-back period. The standard deviation quantifies the dispersion or volatility in the price data.
The rpdev is then divided by the std_hlc3 to normalize the price change by the volatility. This normalization ensures that the price change is expressed in terms of standard deviations, which is a common practice in quantitative analysis.
Essentially, the rpdev represents how many standard deviations the current price is away from the previous moving average.
Volume Correction (VC): If the include_vc input is set to true, volume correction is applied by dividing the trading volume by the previous simple moving average of the volume (psma_volume). This accounts for changes in trading activity.
Volume Corrected Relative Price Change (VCRPD): The vcrpd is calculated by multiplying the rpdev by the volume correction factor (vc). This incorporates both price changes and volume data.
Z-Scores: The Z-scores are calculated by taking the difference between the vcrpd and the mean (mean_vcrpd) and then dividing it by the standard deviation (stddev_vcrpd). Z-scores measure how many standard deviations a value is away from the mean. They help identify whether a value is unusually high or low compared to its historical distribution.
Momentum Blocks: The "Momentum Blocks" are essentially derived from the Z-scores (avgZScore). The script assigns different colors to the "Fill Area" based on predefined Z-score ranges. These colored areas represent different momentum zones:
Positive Z-scores indicate bullish momentum, and different shades of green are used to fill the area.
Negative Z-scores indicate bearish momentum, and different shades of red are used.
Z-scores near zero (between -0.25 and 0.25) suggest neutrality, and a yellow color is used.

ICT Sessions_One Setup for Life [MK]The script plots the High/Low of the following trading sessions:
London - 02:00-05:00
NY AM - 09:30-12:00
New York Lunch - 12:00-13:30
New York PM - 13:30-16:00
Due to the high level of liquidity (resting orders), highs and lows of these sessions may be used as buy/sell areas and also as profit target areas. Typically, buy orders would be initiated below a session low and sell orders would be initiated above a
session high.
The script also plots 'RTH (Regular Trading Hours) Opening Gaps'. The RTH gaps are drawn from the closing price of regular trading at 16:15 (EST) to the open price of regular trading at 09:30 (EST). Gaps can be areas that traders might anticipate to be filled at some time in the future. A gap 'midline' is available if needed and yesterday RTH close line can be shown and extended to the current bar.
This script is simply a means to draw boxes around certain areas/periods on the charts. It is in no way a trading strategy and users should spend much time to study the concept and should also perform extensive back-testing before taking any trades.
By setting the lookback value to a much higher value then the default of 6, users can utilise the script to perform their own backtesting studies.
The above chart shows the default setup of the indicator. Note that the user has to choose how far (in days) to lookback and draw the sessions/gaps.
It is also possible to show the session high//low lines and extend them to the current bar time. If this is used it is advised to keep the lookback period as low as possible to ensure charts stay clean/uncluttered.
All boxes/lines styles/colors are fully customisable.

Spot Symbols for CryptoLibrary "CryptoSpotSymbols"
This Library has one purpose only. It generate Symbols for the Crypto Spot Market, like all the currencies pairs of most Crypto Exchanges available to TradingView.
Have a look at .find() , which is an all in one function.
Binance(basecurrency)
Generate 27 Symbols for the Spot Market of Binance.
Parameters:
basecurrency (simple string) : Its the Basecurrency to generate the Symbols with. Optional. Default value is `syminfo.basecurrency`.
Returns:
BinanceUS(basecurrency)
Generate seven Symbols for the Spot Market of BinanceUS.
Parameters:
basecurrency (simple string) : Its the Basecurrency to generate the Symbols with. Optional. Default value is `syminfo.basecurrency`.
Returns:
Bitfinex(basecurrency)
Generate 12 Symbols for the Spot Market of Bitfinex.
Parameters:
basecurrency (simple string) : Its the Basecurrency to generate the Symbols with. Optional. Default value is `syminfo.basecurrency`.
Returns:
bitFlyer(basecurrency)
Generate three Symbols for the Spot Market of bitFlyer.
Parameters:
basecurrency (simple string) : Its the Basecurrency to generate the Symbols with. Optional. Default value is `syminfo.basecurrency`.
Returns:
Bitget(basecurrency)
Generate seven Symbols for the Spot Market of Bitget.
Parameters:
basecurrency (simple string) : Its the Basecurrency to generate the Symbols with. Optional. Default value is `syminfo.basecurrency`.
Returns:
Bithumb(basecurrency)
Generate two Symbols for the Spot Market of Bithumb.
Parameters:
basecurrency (simple string) : Its the Basecurrency to generate the Symbols with. Optional. Default value is `syminfo.basecurrency`.
Returns:
bitkub(basecurrency)
Generate one Symbol for the Spot Market of bitkub.
Parameters:
basecurrency (simple string) : Its the Basecurrency to generate the Symbols with. Optional. Default value is `syminfo.basecurrency`.
Returns: THB
BitMEX(basecurrency)
Generate two Symbols for the Spot Market of BitMEX.
Parameters:
basecurrency (simple string) : Its the Basecurrency to generate the Symbols with. Optional. Default value is `syminfo.basecurrency`.
Returns:
bitpanda_pro(basecurrency)
Generate six Symbols for the Spot Market of bitpanda pro.
Parameters:
basecurrency (simple string) : Its the Basecurrency to generate the Symbols with. Optional. Default value is `syminfo.basecurrency`.
Returns:
bitrue(basecurrency)
Generate nine Symbols for the Spot Market of bitrue.
Parameters:
basecurrency (simple string) : Its the Basecurrency to generate the Symbols with. Optional. Default value is `syminfo.basecurrency`.
Returns:
Bitstamp(basecurrency)
Generate eight Symbols for the Spot Market of Bitstamp.
Parameters:
basecurrency (simple string) : Its the Basecurrency to generate the Symbols with. Optional. Default value is `syminfo.basecurrency`.
Returns:
BITTREX(basecurrency)
Generate six Symbols for the Spot Market of BITTREX.
Parameters:
basecurrency (simple string) : Its the Basecurrency to generate the Symbols with. Optional. Default value is `syminfo.basecurrency`.
Returns:
BTSE(basecurrency)
Generate 15 Symbols for the Spot Market of BTSE.
Parameters:
basecurrency (simple string) : Its the Basecurrency to generate the Symbols with. Optional. Default value is `syminfo.basecurrency`.
Returns:
BYBIT(basecurrency)
Generate five Symbols for the Spot Market of BYBIT.
Parameters:
basecurrency (simple string) : Its the Basecurrency to generate the Symbols with. Optional. Default value is `syminfo.basecurrency`.
Returns:
CapitalCom(basecurrency)
Generate five Symbols for the Spot Market of capital.com.
Parameters:
basecurrency (simple string) : Its the Basecurrency to generate the Symbols with. Optional. Default value is `syminfo.basecurrency`.
Returns:
coinbase(basecurrency)
Generate seven Symbols for the Spot Market of coinbase.
Parameters:
basecurrency (simple string) : Its the Basecurrency to generate the Symbols with. Optional. Default value is `syminfo.basecurrency`.
Returns:
CoinEx(basecurrency)
Generate three Symbols for the Spot Market of CoinEx.
Parameters:
basecurrency (simple string) : Its the Basecurrency to generate the Symbols with. Optional. Default value is `syminfo.basecurrency`.
Returns:
CurrencyCom(basecurrency)
Generate 30 Symbols for the Spot Market of currency.com.
Parameters:
basecurrency (simple string) : Its the Basecurrency to generate the Symbols with. Optional. Default value is `syminfo.basecurrency`.
Returns:
Delta(basecurrency)
Generate one Symbol for the Spot Market of Delta.
Parameters:
basecurrency (simple string) : Its the Basecurrency to generate the Symbols with. Optional. Default value is `syminfo.basecurrency`.
Returns: USDT
Deribit(basecurrency)
Generate two Symbols for the Spot Market of Deribit.
Parameters:
basecurrency (simple string) : Its the Basecurrency to generate the Symbols with. Optional. Default value is `syminfo.basecurrency`.
Returns:
easyMarkets(basecurrency)
Generate one Symbol for the Spot Market of easyMarkets.
Parameters:
basecurrency (simple string) : Its the Basecurrency to generate the Symbols with. Optional. Default value is `syminfo.basecurrency`.
Returns: USD
Eightcap(basecurrency)
Generate one Symbol for the Spot Market of Eightcap.
Parameters:
basecurrency (simple string) : Its the Basecurrency to generate the Symbols with. Optional. Default value is `syminfo.basecurrency`.
Returns: USD
ExMo(basecurrency)
Generate ten Symbols for the Spot Market of ExMo.
Parameters:
basecurrency (simple string) : Its the Basecurrency to generate the Symbols with. Optional. Default value is `syminfo.basecurrency`.
Returns:
FOREXcom(basecurrency)
Generate four Symbols for the Spot Market of FOREX.com.
Parameters:
basecurrency (simple string) : Its the Basecurrency to generate the Symbols with. Optional. Default value is `syminfo.basecurrency`.
Returns:
FXCM(basecurrency)
Generate three Symbols for the Spot Market of FXCM.
Parameters:
basecurrency (simple string) : Its the Basecurrency to generate the Symbols with. Optional. Default value is `syminfo.basecurrency`.
Returns:
GateIO(basecurrency)
Generate five Symbols for the Spot Market of Gate.io.
Parameters:
basecurrency (simple string) : Its the Basecurrency to generate the Symbols with. Optional. Default value is `syminfo.basecurrency`.
Returns:
Gemini(basecurrency)
Generate ten Symbols for the Spot Market of Gemini.
Parameters:
basecurrency (simple string) : Its the Basecurrency to generate the Symbols with. Optional. Default value is `syminfo.basecurrency`.
Returns:
Kraken(basecurrency)
Generate 14 Symbols for the Spot Market of Kraken.
Parameters:
basecurrency (simple string) : Its the Basecurrency to generate the Symbols with. Optional. Default value is `syminfo.basecurrency`.
Returns:
KuCoin(basecurrency)
Generate 13 Symbols for the Spot Market of KuCoin.
Parameters:
basecurrency (simple string) : Its the Basecurrency to generate the Symbols with. Optional. Default value is `syminfo.basecurrency`.
Returns:
MEXC(basecurrency)
Generate six Symbols for the Spot Market of MEXC.
Parameters:
basecurrency (simple string) : Its the Basecurrency to generate the Symbols with. Optional. Default value is `syminfo.basecurrency`.
Returns:
OANDA(basecurrency)
Generate one Symbol for the Spot Market of OANDA.
Parameters:
basecurrency (simple string) : Its the Basecurrency to generate the Symbols with. Optional. Default value is `syminfo.basecurrency`.
Returns: USD
OKX(basecurrency)
Generate six Symbols for the Spot Market of OKX.
Parameters:
basecurrency (simple string) : Its the Basecurrency to generate the Symbols with. Optional. Default value is `syminfo.basecurrency`.
Returns:
Pepperstone(basecurrency)
Generate one Symbol for the Spot Market of Pepperstone.
Parameters:
basecurrency (simple string) : Its the Basecurrency to generate the Symbols with. Optional. Default value is `syminfo.basecurrency`.
Returns: USD
phemex(basecurrency)
Generate four Symbols for the Spot Market of phemex.
Parameters:
basecurrency (simple string) : Its the Basecurrency to generate the Symbols with. Optional. Default value is `syminfo.basecurrency`.
Returns:
POLONIEX(basecurrency)
Generate nine Symbols for the Spot Market of POLONIEX.
Parameters:
basecurrency (simple string) : Its the Basecurrency to generate the Symbols with. Optional. Default value is `syminfo.basecurrency`.
Returns:
Pyth(basecurrency)
Generate three Symbols for the Spot Market of Pyth.
Parameters:
basecurrency (simple string) : Its the Basecurrency to generate the Symbols with. Optional. Default value is `syminfo.basecurrency`.
Returns:
Skilling(basecurrency)
Generate four Symbols for the Spot Market of Skilling.
Parameters:
basecurrency (simple string) : Its the Basecurrency to generate the Symbols with. Optional. Default value is `syminfo.basecurrency`.
Returns:
TimeX(basecurrency)
Generate six Symbols for the Spot Market of TimeX.
Parameters:
basecurrency (simple string) : Its the Basecurrency to generate the Symbols with. Optional. Default value is `syminfo.basecurrency`.
Returns:
TradeStation(basecurrency)
Generate four Symbols for the Spot Market of TradeStation.
Parameters:
basecurrency (simple string) : Its the Basecurrency to generate the Symbols with. Optional. Default value is `syminfo.basecurrency`.
Returns:
UpBit(basecurrency)
Generate four Symbols for the Spot Market of UpBit.
Parameters:
basecurrency (simple string) : Its the Basecurrency to generate the Symbols with. Optional. Default value is `syminfo.basecurrency`.
Returns:
whitebit(basecurrency)
Generate 13 Symbols for the Spot Market of whitebit.
Parameters:
basecurrency (simple string) : Its the Basecurrency to generate the Symbols with. Optional. Default value is `syminfo.basecurrency`.
Returns:
WOOX(basecurrency)
Generate two Symbols for the Spot Market of WOO.
Parameters:
basecurrency (simple string) : Its the Basecurrency to generate the Symbols with. Optional. Default value is `syminfo.basecurrency`.
Returns:
find(exchange, basecurrency)
Generate up to 30 Symbols for the Spot Market, depending on the market picked.
Parameters:
exchange (simple string) : The name of an Exchange. Case insensitivity. Optional. Default value is `syminfo.prefix`. If something else is put in here it will return `na` values.
basecurrency (simple string) : The Basecurrency to generate the Symbols with. Optional. Default value is `syminfo.basecurrency`
Returns: 30x string as tuple

Regularized-Moving-Average Oscillator SuiteThe Regularized-MA Oscillator Suite is a versatile indicator that transforms any moving average into an oscillator. It comprises up to 13 different moving average types, including KAMA, T3, and ALMA. This indicator serves as a valuable tool for both trend following and mean reversion strategies, providing traders and investors with enhanced insights into market dynamics.
Methodology:
The Regularized MA Oscillator Suite calculates the moving average (MA) based on user-defined parameters such as length, moving average type, and custom smoothing factors. It then derives the mean and standard deviation of the MA using a normalized period. Finally, it computes the Z-Score by subtracting the mean from the MA and dividing it by the standard deviation.
KAMA (Kaufman's Adaptive Moving Average):
KAMA is a unique moving average type that dynamically adjusts its smoothing period based on market volatility. It adapts to changing market conditions, providing a smoother response during periods of low volatility and a quicker response during periods of high volatility. This allows traders to capture trends effectively while reducing noise.
T3 (Tillson's Exponential Moving Average):
T3 is an exponential moving average that incorporates additional smoothing techniques to reduce lag and provide a more responsive indicator. It aims to maintain a balance between responsiveness and smoothness, allowing traders to identify trend reversals with greater accuracy.
ALMA (Arnaud Legoux Moving Average):
ALMA is a moving average type that utilizes a combination of linear regression and exponential moving average techniques. It offers a unique way of calculating the moving average by providing a smoother and more accurate representation of price trends. ALMA reduces lag and noise, enabling traders to identify trend changes and potential entry or exit points more effectively.
Z-Score:
The Z-Score calculation in the Regularized-MA Oscillator Suite standardizes the values of the moving average. It measures the deviation of each data point from the mean in terms of standard deviations. By normalizing the moving average through the Z-Score, the indicator enables traders to assess the relative position of price in relation to its mean and volatility. This information can be valuable for identifying overbought and oversold conditions, as well as potential trend reversals.
Utility:
The Regularized-MA Oscillator Suite with its unique moving average types and Z-Score calculation offers traders and investors powerful analytical tools. It can be used for trend following strategies by analyzing the oscillator's position relative to the midline. Traders can also employ it as a mean reversion tool by identifying peak values above user-defined deviations. These features assist in identifying potential entry and exit points, enhancing trading decisions and market analysis.
Key Features:
Variety of 13 MA types.
Potential reversal point bubbles.
Bar coloring methods - Trend (Midline cross), Extremities, Reversions, Slope
Example Charts:

DB Support Resistance LevelsDB Support Resistance Levels
This indicator plots historic lines for high, low and close prices. The settings allow up to 3 periods to be configured based on the current timeframe. Users can toggle the display of high, low or close values for each period along with customizing the period line color. The indicator does not use the security function. Instead, it's designed to use a period multiplier. Each period allows the user to configure a lookback length and multiplier.
For Example on Weekly
A period lookback of 12 with a multiplier value of 12 on weekly would produce historic high, low and close lines for the last 12 weeks.
A period lookback of 10 with a multiplier value of 4 on weekly would produce historic high, low and close lines for the last 4, 4-week months.
A period lookback of 8 with a multiplier value of 13 on weekly would produce historic high, low and close lines for the last 8, 13-week quarters.
Why not use security with higher timeframe?
The goal was to have the lines start at the precise high, low and close points for the current chart timeframe to allow the user to visually trace the start of the line.
What else does this do?
This indicator also plots the pivot points using TradingView's built-in "pivot_point_levels" feature.
How should I use this indicator?
Traders may use this indicator to gain a visual reference of support and resistance levels from higher periods of time. You can then compare these historic levels against the pivot point levels. In most cases, historic high, low and close levels act as support and resistance levels which can be helpful for judging future market pivot points.
Additional Notes
This indicator does increase the max total lines allowed which may impact performance depending on device specs. No alerts or signals for now. Perhaps coming soon...

ICT Macros [LuxAlgo]The ICT Macros indicator aims to highlight & classify ICT Macros, which are time intervals where algorithmic trading takes place to interact with existing liquidity or to create new liquidity.
🔶 SETTINGS
🔹 Macros
Macro Time options (such as '09:50 AM 10:10'): Enable specific macro display.
Top Line , Mid Line , Bottom Line and Extending Lines options: Controls the lines for the specific macro.
🔹 Macro Classification
Length : A length to detect Market Structure Brakes and classify macro type based on detection.
Swing Area : Swing or Liquidity Area selection, highest/lowest of the wick or the candle bodies.
Accumulation , Manipulation and Expansion color options for the classified macros.
🔹 Others
Macro Texts : Controls both the size and the visibility of the macro text.
Alert Macro Times in Advance (Minutes) : This option will plot a vertical line presenting the start of the next macro time. The line will not appear all the time, but it will be there based on remaining minutes specified in the option.
Daylight Saving Time (DST) : Adjust time appropriate to Daylight Saving Time of the specific region.
🔶 USAGE
A macro is a way to automate a task or procedure which you perform on a regular basis.
In the context of ICT's teachings, a macro is a small program or set of instructions that unfolds within an algorithm, which influences price movements in the market. These macros operate at specific times and can be related to price runs from one level to another or certain market behaviors during specific time intervals. They help traders anticipate market movements and potential setups during specific time intervals.
To trade these effectively, it is important to understand the time of day when certain macros come into play, and it is strongly advised to introduce the concept of liquidity in your analysis.
Macros can be classified into three categories where the Macro classification is calculated based on the Market Structure prior to macro and the Market Structure during the macro duration:
Manipulation Macro
Manipulation macros are characterized by liquidity being swept both on the buyside and sellside.
Expansion Macro
Expansion macros are characterized by liquidity being swept only on the buyside or sellside. Prices within these macros are highly correlated with the overall trend.
Accumulation Macro
Accumulation macros are characterized by an accumulation of liquidity. Prices within these macros tend to range.
The script returns the maximum/minimum price values reached during the macro interval alongside the average between the maximum/minimum and extends them until a new macro starts. These levels can act as supports and resistances.
🔶 DETAILS
All required data for the macro detection and classification is retrieved using 1 minute data sets, this includes candles as well as pivot/swing highs and lows. This approach guarantees the visually presented objects are same (same highs/lows) on higher timeframes as well as the macro classification remain same as it is in 1 min charts.
8 Macros can be displayed by the script (4 are enabled by default):
02:33 AM 03:00 London Macro
04:03 AM 04:30 London Macro
08:50 AM 09:10 New York Macro
09:50 AM 10:10 New York Macro
10:50 AM 11:10 New York Macro
11:50 AM 12:10 New York Launch Macro
13:10 PM 13:40 New York Macro
15:15 PM 15:45 New York Macro
🔶 ALERTS
When an alert is configured, the user will have the ability to be notified in advance of the next Macro time, where the value specified in 'Alert Macro Times in Advance (Minutes)' option indicates how early to be notified.
🔶 LIMITATIONS
The script is supported on 1 min, 3 mins and 5 mins charts.
🔶 RELATED SCRIPTS

SPY 4 Hour Swing TraderThe purpose of this script is to spot 4 hour pivots that indicate ~30 trading day swings. As VIX starts to drop options trading will get more boring and as we get back on the bull and can benefit from swing trading strategy. Swing trading doesn't make a whole lot of sense when VIX is above 28. Seems to get best results on 4 hour chart for this one. This indicator spots a go long opportunity when the 5 ema crosses the 13 ema on the 4 hour along with the RSI > 50 and the ADX > 20 and Stoichastic values (smoothed line < 80 or line < 90) and close > last candle close and the True Range < 6. It also spots uses a couple different means to determine when to exit the trade. Sell condition is primarily when the 13 ema crosses the 5 ema and the MACD line crosses below the signal line and the smoothed Stoichastic appears oversold (greater than 60) and slop of RSI < -.2. Stop Losses and Take Profits are configurable in Inputs along with ability to include short trades plus other MACD and Stoichastic settings. If a stop loss is encountered the trade will close. Also once twice the expected move is encountered partial profits will taken and stop losses and take profits will be re-established based on most recent close. Also a VIX above 28 will trigger any open positions to close. If trying to use this for something other than SPXL it is best to update stop losses and take profit percentages and check backtest results to ensure proper levels have been selected and the script gives satisfactory results.

SPY 1 Hour Swing TraderThe purpose of this script is to spot 1 hour pivots that indicate ~5 to 6 trading day swings. Results indicate that swings are held approximately 5 to 6 trading days on average, over the last 6 years. This indicator spots a go long opportunity when the 5 ema crosses the 13 ema on the 1 hour along with the RSI > 50. It also spots uses a couple different means to determine when to exit the trade. Sell condition is primarily when the 13 ema crosses the 5 ema and the MACD line crosses below the signal line and the smoothed Stoichastic appears oversold (greater than 60). Stop Losses and Take Profits are configurable in Inputs along with ability to include short trades plus other MACD and Stoichastic settings. If a stop loss is encountered the trade will close. Also once twice the expected move is encountered partial profits will taken and stop losses and take profits will be re-established based on most recent close. Once long trades are exited, short trades will be initiated if recent conditions appeared oversold and input option for short trading is enabled. If trying to use this for something other than SPXL it is best to update stop losses and take profit percentages and check backtest results to ensure proper levels have been selected and the script gives satisfactory results.

Trend Reversal System with SR levelsHello All,
This is the Trend Reversal System with Support/Resistance levels script. long time ago I published it as closed source but now I upgraded it and and published as open-source with a different name. I hope it would be useful for you all while trading/analyzing.
The script has some parts in it: Setup, Count, SR levels, Risk levels & Targets . Now lets check them:
Setup Part: it has two part, Buy or Sell Setup. one of them can be active only. Buy setup: if current close checks if current is lower/equal than the close of the 5. bar. if yes then the script increases number of buy setup. and if it reaches 9 then the script checks if current low is lower/equal than the lows of last 3. and 4. bars, or if the low of the last bar is lower/equal than the lows of last 3. and 4. bars. if yes then the script increases the buy setup by 1. if these conditions met then it puts the label 'S' , same for Sell setup. S labels on both setup are potential reversals.
Count Part: If buy or sell setup reaches the 9 then Count part starts from 1. lets see buy count: If current close is lower/equal than the low of the 3. bar and buy count is lower than 12 or low of the bar 13 is less than or equal to the close of bar 8 then buy count increase or it's completed. if it's completed then the script puts C label, and it's potential reversal. of course there are some conditions that can cancel the count buy/sell or recycle/restart.
By using Setup and Count levels the script can show Support/Resistance Levels, Risk levels & Targets. SR levels are potential reversal levels.
Lets see some example screenshots:
Support/Resistance levels:
Potential Reversal levels and how setup/counts are shown:
Count part can recycle and the script shows it as 'R' , ( you can see the conditions for Recycle in the script ):
Count can be cancelled and and it's shown as 'x'
If the scripts find 9 on Setup or 13 on Count then it checks if it's a good level to buy/sell and if it decides it's good level then it shows TRSSetup Buy/Sell or TRSCount Buy/Sell and also shows the target. in following example the script checks and decide it's a good level to take long position. it can be aggressive or conservative, Conservative is recommended.
Enjoy!

ICT Algorithmic Macro Tracker° (Open-Source) by toodegreesDescription:
The ICT Algorithmic Macro Tracker° Indicator is a powerful tool designed to enhance your trading experience by clearly and efficiently plotting the known ICT Macro Times on your chart.
Based on the teachings of the Inner Circle Trader , these Time windows correspond to periods when the Interbank Price Delivery Algorithm undergoes a series of checks ( Macros ) and is probable to move towards Liquidity.
The indicator allows traders to visualize and analyze these crucial moments in NY Time:
- 2:33-3:00
- 4:03-4:30
- 8:50-9:10
- 9:50-10:10
- 10:50-11:10
- 11:50-12:10
- 13:10-13:50
- 15:15-15:45
By providing a clean and clutter-free representation of ICT Macros, this indicator empowers traders to make more informed decisions, optimize and build their strategies based on Time.
Massive shoutout to @reastruth for his ICT Macros Indicator , and for allowing to create one of my own, go check him out!
Indicator Features:
– Track ongoing ICT Macros to aid your Live analysis.
- Gain valuable insights by hovering over the plotted ICT Macros to reveal tooltips with interval information.
– Plot the ICT Macros in one of two ways:
"On Chart": visualize ICT Macro timeframes directly on your chart, with automatic adjustments as Price moves.
Pro Tip: toggle Projections to see exactly where Macros begin and end without difficulty.
"New Pane": move the indicator two a New Pane to see both Live and Upcoming Macro events with ease in a dedicated section
Pro Tip: this section can be collapsed by double-clicking on the main chart, allowing for seamless trading preparation.
This indicator is available only on the TradingView platform.
⚠️ Open Source ⚠️
Coders and TV users are authorized to copy this code base, but a paid distribution is prohibited. A mention to the original author is expected, and appreciated.
⚠️ Terms and Conditions ⚠️
This financial tool is for educational purposes only and not financial advice. Users assume responsibility for decisions made based on the tool's information. Past performance doesn't guarantee future results. By using this tool, users agree to these terms.

ICT Macros by CryptoforICT Macros by Cryptofor
Time periods in which the price is most volatile. At this time, the algorithm is programmed to attack liquidity or fill a significant FVG from which the OF can continue.
Plots of macros:
1. London Macros:
02:33 - 03:00
04:03 - 04:30
2. New York AM Macros:
08:50 - 09:10
09:50 - 10:10
10:50 - 11:10
3. New York Lunch + PM Macros:
11:50 - 12:10
13:10 - 13:40
15:15 - 15:45
Features:
Flexible line settings
Flexible text settings
Display data for all time or for the last 24 hours
Switch for each type of macro
Macro background color settings

Rainbow Collection - VioletMoving averages come in all shapes and types. The most basic type is the simple moving average which is simply the sum divided by the quantity. Therefore, the simple moving average is the sum of the values divided by their number.
In technical analysis, you generally use moving averages to understand the underlying trend and to find trading signals. In the case of the Violet indicator, we are using a Hull moving average which is a special variation based on different weights to minimize lag.
The Violet indicator is therefore used as follows:
* A bullish signal is generated whenever the close price surpasses the 20-period Hull moving average while the previous close prices from periods were all below their respective Hull moving average of the period.
*A bearish signal is generated whenever the close price breaks the 20-period Hull moving average while the previous close prices from periods were all above their respective Hull moving average of the period.
The aim of the Violet indicator is to capture reversals as early as possible through a combination of lagged conditions based on the Fibonacci sequence.
