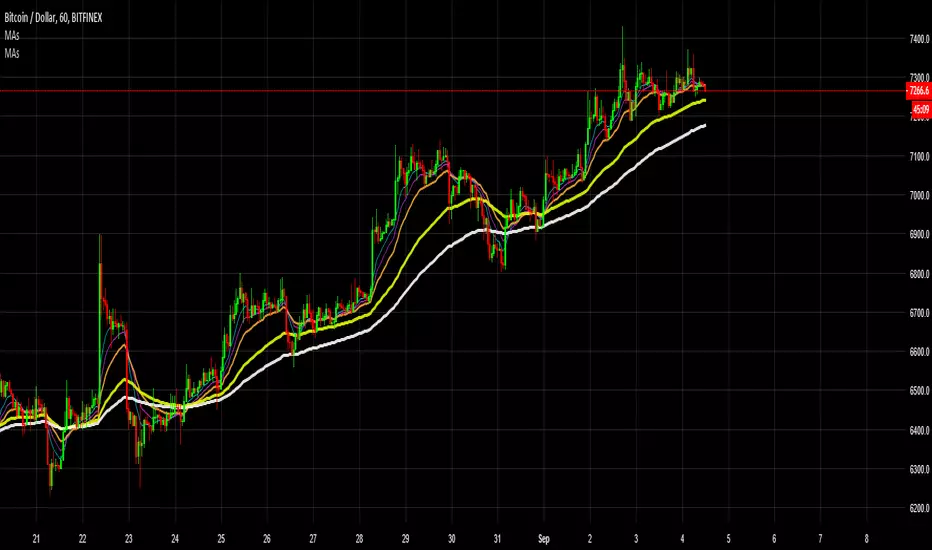
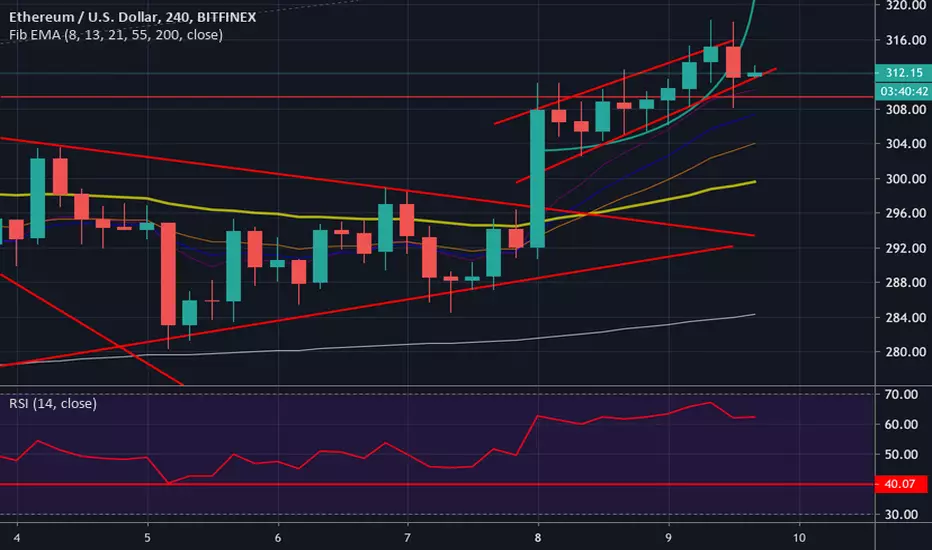
Fibonacci EMAs 8 13 21 55Plot 4 EMA based on fibonacci number
5+3 = 8
5 + 8 = 13
13 + 8 = 21
21 + 34 = 55
Quick Mafs :D
If you want to understand how to use them look at Philakone videos on youtube
在脚本中搜索"细算江西救护车家长倒赚了四万三+-医疗花费13万(家长视频)++医保报"

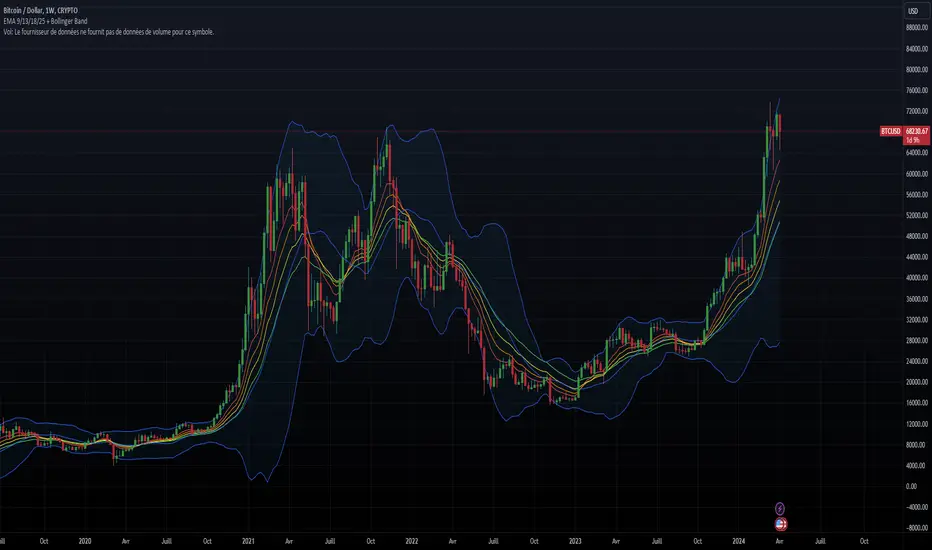
EMA 9/13/18/25 + Bollinger BandThe indicator combines two components: Exponential Moving Averages (EMAs) and Bollinger Bands.
Exponential Moving Averages (EMAs): The indicator calculates four EMAs with different periods: 9, 13, 18, and 25. An Exponential Moving Average is a type of moving average that places a greater weight and significance on the most recent data points. As the name suggests, it's an average of the asset's price over a certain period, with recent prices given more weight in the calculation, making it more responsive to recent price changes.
Bollinger Bands: Bollinger Bands consist of a simple moving average (the basis) and two standard deviations plotted away from it. The standard deviations are multiplied by a factor (usually 2) to determine the distance from the basis. These bands dynamically adjust themselves based on recent price movements. The upper band represents the highest price level reached in the given period, while the lower band represents the lowest price level.
Combining these components provides traders with insights into both trend direction and volatility. The EMAs help identify trends by smoothing out price data, while the Bollinger Bands offer insights into volatility and potential price reversal points. Traders often use the crossovers of EMAs and interactions with Bollinger Bands to make trading decisions. For example, when the price touches the upper Bollinger Band, it may indicate overbought conditions, while touching the lower band may suggest oversold conditions. Additionally, crossovers of EMAs (such as the shorter-term EMA crossing above or below the longer-term EMA) may signal changes in trend direction.
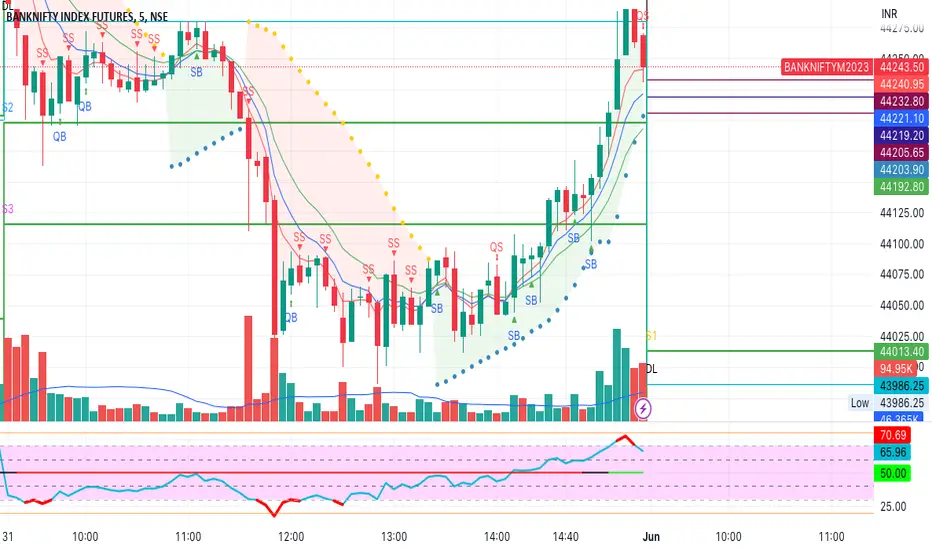
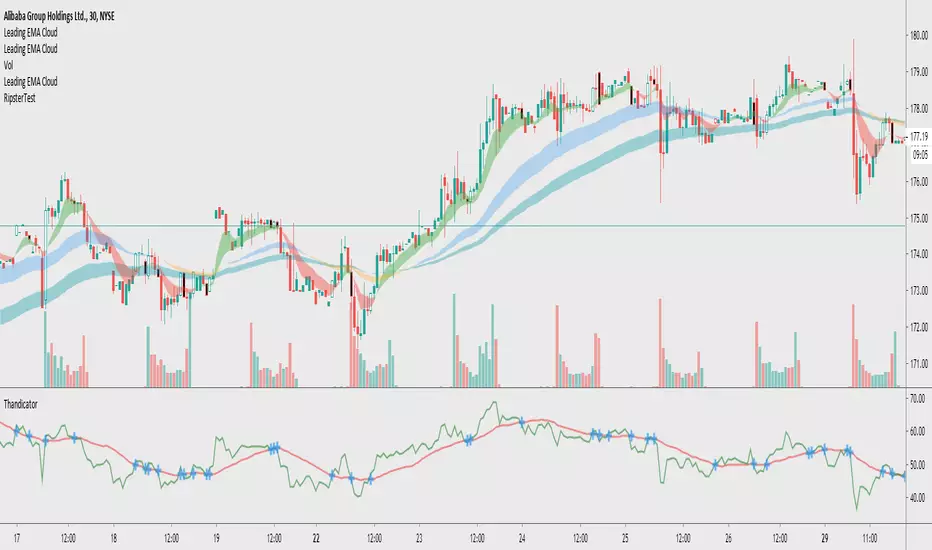
Buy Sell using 5-8-13 EMA, RSI, PSAR IndicatorThis indicator generates Scalping and Strong Buy/Sell Signals.
Quick Scalp signals are generated using 5 EMA and RSI.
Strong Buy/Sell Signals are generated using combination of 5-8-13 EMA and Parabolic SAR.
Signals generated:
QB: Quick Buy
QS: Quick Sell
SB: Strong Buy
SS: Strong Sell
LankouSpreads ema 13 FTXThis script is calculating spreads automatically between an asset and it PERP counterpart
Giving a crypto asset it substract it price from the PERP pair and disaply the result
usually
if the difference is a positive it's a top signal
and if it's negatvie it's a bottom signal
/!\ it only works with asset which have a PERP pair (FTX only)
Due to TradingView limitations I made this one specially for FTX (I'm unable to use a variable for the asset name)
There is an ema 13 for smoothing the indicator
hellow hellow power !

LankouSpreads ema 13This script is calculating spreads automatically between an asset and it PERP counterpart
Giving a crypto asset it substract it price from the PERP pair and disaply the result
usually
if the difference is a positive it's a top signal
and if it's negatvie it's a bottom signal
/!\ it only works with asset which have a PERP pair (use it on binance and it will work ok)
There is an ema 13 for smoothing the indicator
hellow hellow power !

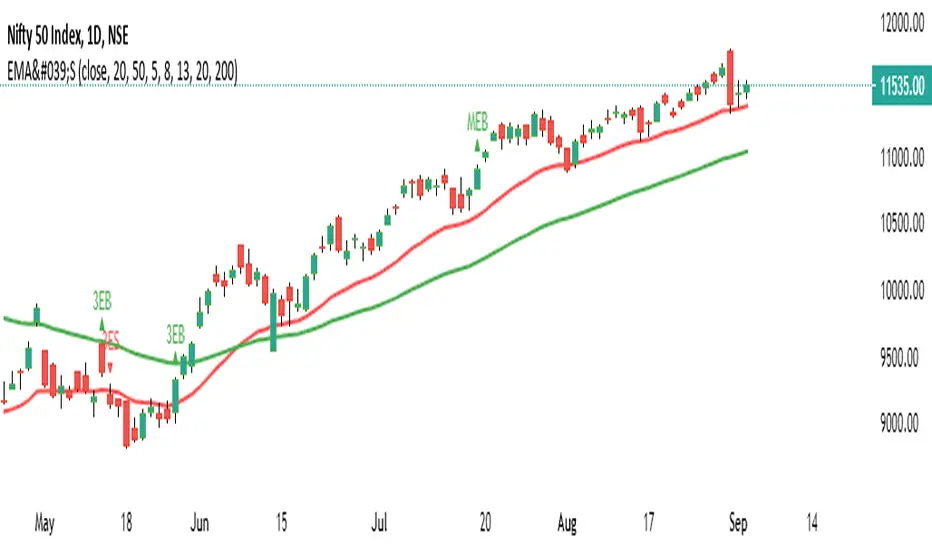
5-8-13 & 20-200 EMA Cross Over1) Popular EMA cross over combined as on indicator daily time frame
2) 5-8-13 for Swing 3EB- Bullish 3ES - Bearish
3) 20-200 EMA Cross over called as multi-bagger cross over with an inverted triangle in a smaller period of time
MEB - Bullish 20 ema crossed 200 ema, MES - Bearish vice versa
4) Simultaneously 20 50 are plotted in the graph as user input can be changed to according to user specific
EMA 5/8/13/40It contains 4 EMA lines, EMA -5/8/13/40
First 3 can be used for intraday as well as for twin trading.
EMA 40 can use used a reference to trend

FXN - Buy Sell Signals, EMA 5 / 13 CrossThis is a simple script to display buy and sell signals when the 5 and 13 Exponential moving averages cross. These signals are designed to only appear when they occur during the London and New York Trading Sessions, although this aspect of the indicator can be changed.
These signals should not be considered as trade signals in isolation and must only be used in confirmation with other confluences and factors outlined in their strategy.


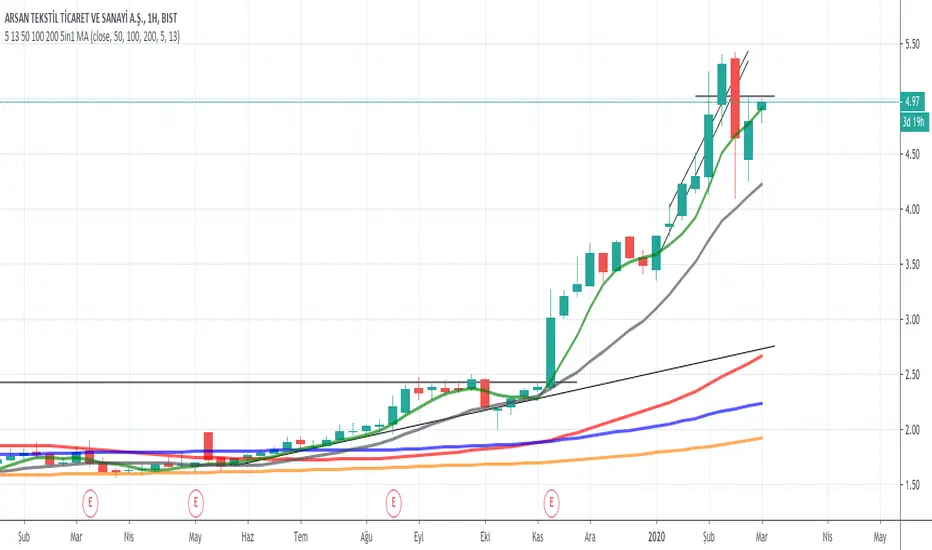
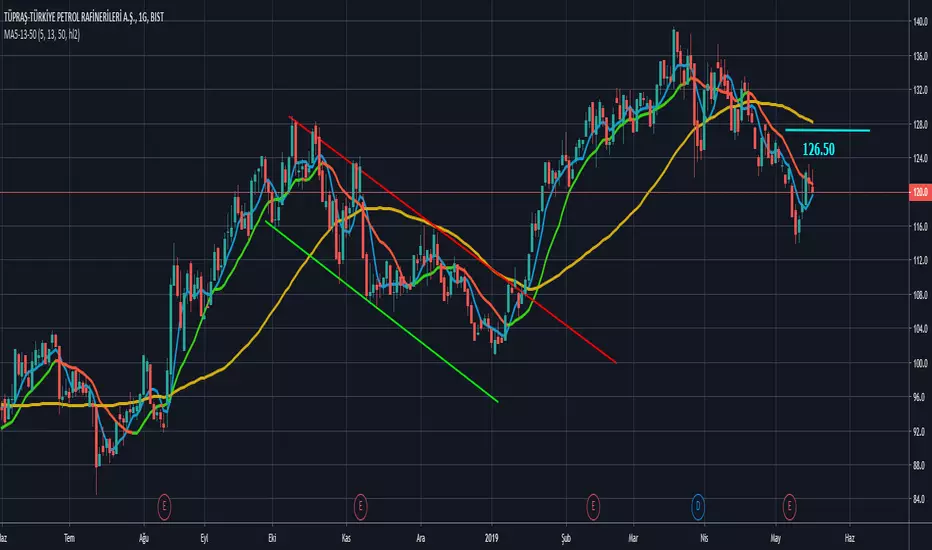
MA5-13-50 by biruvyatirimciUmit Uslucan'ın MA5-13-50 stratejisine göre hareketli ortalamaları çiziyor, MA13 değeri yükselişte ise yeşil inişte ise pembe çiziyor.
* biruvyatirimci


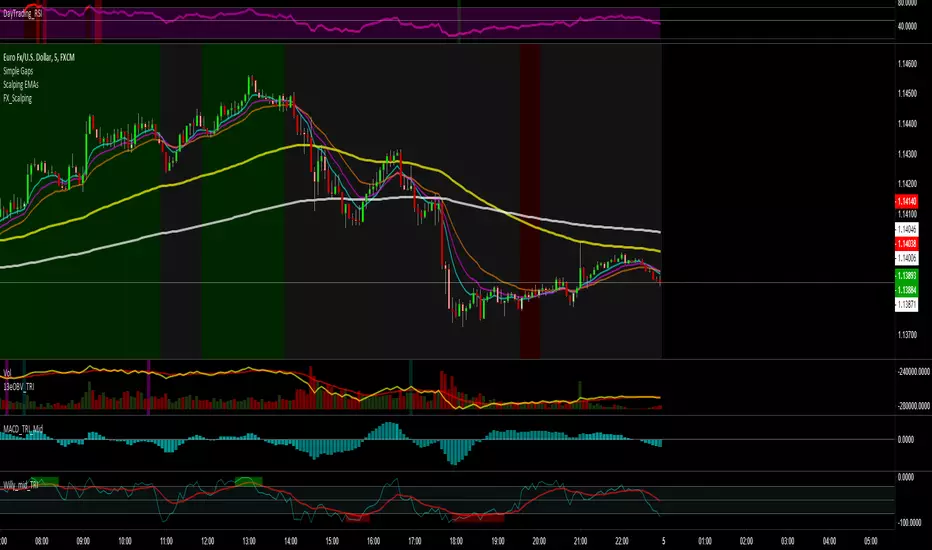
OBV with 13 EMA - TRIOn Balance Volume with 13 Exponential Moving Average.
Taught in school Level 1 program.