PScolorLibrary "PScolor"
TODO: add library description here
////variable/////////////////////////////
//COLOR brightness
Each color has 0–9 / A1–A4
(5th standard: Bright if small, dark if big)
(Fluorescence based on A2)
//Color Name
1 = RED
2 = DEEP_ORANGE
3 = ORANGE
4 = AMBER
5 = YELLOW
6 = LIME
7 = LIGHT_GREEN
8 = GREEN
9 = TEAL
10= CYAN
11= LIGHT_BLUE
12= BLUE
13= INDIGO
14= DEEP_PURPLE
15= PURPLE
16= PINK
0= GRAY
// Transparency
///////////////////////////////////////
lvcol(colormode, Number, trans)
Parameters:
colormode (int)
Number (simple int)
trans (float)
lvcolA(colormode, Number, trans)
Parameters:
colormode (int)
Number (simple int)
trans (float)
lvcol2(colormode, colorName, trans)
Parameters:
colormode (int)
colorName (simple string)
trans (float)
lvcol2A(colormode, colorName, trans)
Parameters:
colormode (int)
colorName (simple string)
trans (float)
在脚本中搜索"细算江西救护车家长倒赚了四万三+-医疗花费13万(家长视频)++医保报"

Multi Time Frame Composite BandsMulti Time Frame Composite Bands utilizes Fibonacci numbers (5, 8, 13, 21, 34) as period lengths for calculations. The indicator calculates a composite high line (C_high) by averaging the highest prices over Fibonacci periods, incorporating moving averages (SMA) of high prices for added refinement and smoothing. Similarly, a composite low line (C_low) is calculated by averaging the lowest prices with moving averages of low prices. The midline, obtained from the mean of C_high and C_low.
This band can function as volatility bands unlike traditional volatility indicators like Bollinger Bands , ATR bands it does not use traditional measures of volatility such standard deviation , ATR. This hugs closely to the price and during trending markets the some part of the candles stay outside the band and when the entire candle digress outside the band a price correction or reversal can be anticipated. This can be considered as a smoothed Donchian channel.

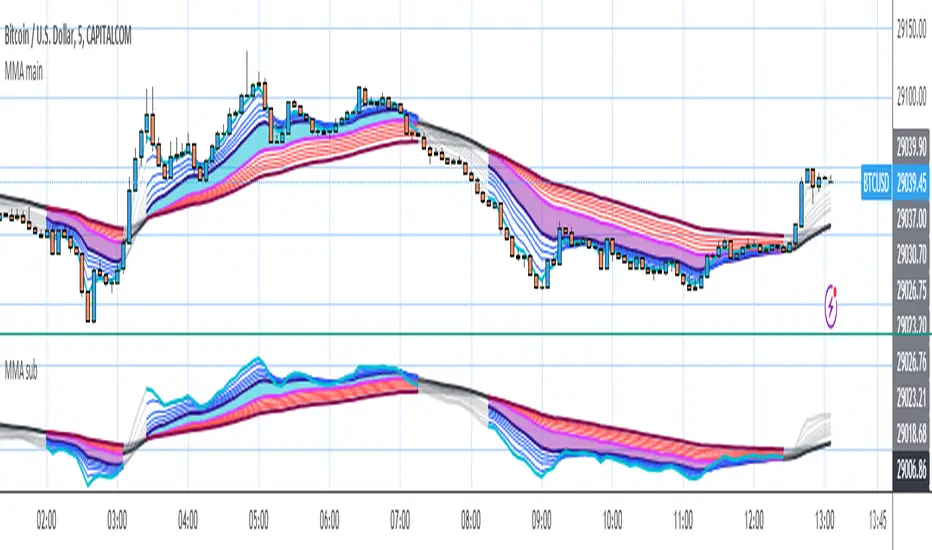
MMA mainpanelI stumbled on the MMA in the “Active Investing” course notes by Alan Hull (who invented the Hull Moving Average)
alanhull.com
He writes on page 13:
“Multiple moving averages, MMAs, are a sophisticated tool that can be used in a range of applications. MMAs are a series of lines that track and filter the weekly price movements. They consist of 2 sets of lines that allow Technical Analysts to observe and compare the immediate behavior of price activity with the long term behavior of the price activity. Exponential moving averages are used for this type of analysis. The price bars in the following chart have been switched off to improve readability of the MMA lines.”
“Once we have found a share that has an acceptable 'Rate of return' we must make a qualitative judgment of the trend. We are looking for a strong and consistent trend that is not likely to reverse shortly after we enter the market. The following points are critical;
- The long term group must be spreading apart or running parallel with each other.
- The long term group must be pointing upwards.
- The straighter the long term group of lines are; the less volatile the trend is.
- The short term group can pullback (ie. compress together) but if they cross into the long term group then the trend is weakening and may be about to break.
This type of qualitative analysis is only used when entering the market and the idea is to avoid volatility. We want to 'Buy and Hold' and not get bounced in and out of the market. Judging the quality of trends is the most subjective function we will have to perform.”
Because I tend to close positions too soon, I tried MMA. I found that it can help me to stay in position as long as the trend is going on. TradingView offers several scripts for MMA, this version differs from the others because I added color zones and linecolor changes to mark the trend according to Alan’s norms:
An uptrend is marked with a blue zone when the short term group is above the long term group and the long term group is sorted correctly and ema50 points up. The zone is purple when vice versa in downtrend. When there is no trend no zone is colored, but the lines are made gray.
Because of Alan’s idea to show MMA without price bars, I created both an overlay version for the main panel and a version for a sub panel.
Buy/Sell EMA CandleThis indicator is designed to display various technical indicators, candle patterns, and trend directions on a price chart. Let's break down the code and explain its different sections:
Exponential Moving Averages (EMA):
The code calculates and plots five EMAs of different lengths (13, 21, 55, 90, and 200) on the price chart. These EMAs are used to identify trends and potential crossovers.
Engulfing Candle Patterns:
The code identifies and highlights potential bullish and bearish engulfing candle patterns. It checks if the current candle's body size is larger than the combined body sizes of the previous and subsequent four candles. If this condition is met, it marks the pattern on the chart.
s3.tradingview.com
EMA Crossovers:
The code identifies and highlights points where the shorter EMA (ema1) crosses above or below the longer EMA (ema2). It plots circles to indicate these crossover points.
Candle Direction and RSI Trend:
The code determines the trend direction of the last candle based on whether it closed higher or lower than its open price. It also calculates the RSI (Relative Strength Index) and determines its trend direction (overbought, oversold, or neutral) based on predefined thresholds.
s3.tradingview.com
Table Display:
The code creates a table displaying trend directions for different timeframes (monthly, weekly, daily, 4-hour, and 1-hour) for candle direction and RSI trends. The trends are labeled with "L" for long, "S" for short, and "N/A" for not applicable.
High Volume Bars (HVB):
The code identifies and colors bars with above-average volume as either bullish or bearish based on whether the price closed higher or lower than it opened. The color and conditions for high volume bars can be customized.
s3.tradingview.com
Doji Candle Pattern:
The code identifies and marks doji candle patterns, where the open and close prices are very close to each other within a certain percentage of the candle's high-low range.
RSI-Based Candle Coloring:
The code adjusts the color of the candles based on the RSI value. If the RSI value is above the overbought threshold or below the oversold threshold, the candles are colored yellow.
Usage and Interpretation:
Traders can use this indicator to identify potential trend changes based on EMA crossovers and candle patterns like engulfing and doji.
The RSI trend direction can provide additional insight into potential overbought or oversold conditions.
High volume bars can indicate potential price reversals or continuation patterns.
The table provides an overview of trend directions on different timeframes for both candle direction and RSI trends.
Keep in mind that this is a complex indicator with multiple features. Users should carefully evaluate its performance and consider combining it with other indicators and analysis methods for more accurate trading decisions.
The table is designed to provide a consolidated view of trend directions and other indicators across multiple timeframes. It is displayed on the chart and organized into rows and columns. Each row corresponds to a specific aspect of analysis, and each column corresponds to a different timeframe.
Here's a breakdown of the components of the table:
Row 1: Separation.
Row 2 (Header Row): This row contains the headers for the columns. The headers represent the different timeframes being analyzed, such as Monthly (M), Weekly (W), Daily (D), 4-hour (4h), and 1-hour (1h).
Row 3 (Content Row): This row contains labels indicating the types of information being displayed in the columns. The labels include "T" for Trend, "C" for Current Candle, and "R" for RSI Trend.
Row 4 and Onwards: These rows display the actual data for each aspect of analysis across different timeframes.
For each aspect of analysis (Trend, Current Candle, RSI Trend), the corresponding rows display the following information:
Monthly (M): The trend direction for the given aspect on the monthly timeframe.
Weekly (W): The trend direction for the given aspect on the weekly timeframe.
Daily (D): The trend direction for the given aspect on the daily timeframe.
4-hour (4h): The trend direction for the given aspect on the 4-hour timeframe.
1-hour (1h): The trend direction for the given aspect on the 1-hour timeframe.
The trend directions are represented by labels such as "L" for Long, "S" for Short, or "N/A" for Not Applicable.
The table's purpose is to provide a quick overview of trend directions and related information across multiple timeframes, aiding traders in making informed decisions based on the analysis of trend changes and other indicators.

TrendGuard Flag Finder - Strategy [presentTrading]
Introduction and How It Is Different
In the vast world of trading strategies, the TrendGuard Flag Finder stands out as a unique blend of traditional flag pattern detection and the renowned SuperTrend indicator.
- A significant portion of the Flag Pattern detection is inspired by the "Flag Finder" code by @Amphibiantrading, which serves as one of foundational element of this strategy.
- While many strategies focus on either trend-following or pattern recognition, this strategy harmoniously combines both, offering traders a more holistic view of the market.
- The integration of the SuperTrend indicator not only provides a clear direction of the prevailing trend but also offers potential stop-loss levels, enhancing the strategy's risk management capabilities.
AAPL 1D chart
ETHBTC 6hr chart
Strategy: How It Works
The TrendGuard Flag Finder is primarily built on two pillars:
1. Flag Pattern Detection : At its core, the strategy identifies flag patterns, which are continuation patterns suggesting that the prevailing trend will resume after a brief consolidation. The strategy meticulously detects both bullish and bearish flags, ensuring traders can capitalize on opportunities in both rising and falling markets.
What is a Flag Pattern? A flag pattern consists of two main components:
1.1 The Pole : This is the initial strong price move, which can be either upwards (for bullish flags) or downwards (for bearish flags). The pole represents a strong surge in price in a particular direction, driven by significant buying or selling momentum.
1.2 The Flag : Following the pole, the price starts consolidating, moving against the initial trend. This consolidation forms a rectangular shape and is characterized by parallel trendlines. In a bullish flag, the consolidation will have a slight downward tilt, while in a bearish flag, it will have a slight upward tilt.
How the Strategy Detects Flags:
Identifying the Pole: The strategy first identifies a strong price movement over a user-defined number of bars. This movement should meet a certain percentage change to qualify as a pole.
Spotting the Flag: After the pole is identified, the strategy looks for a consolidation phase. The consolidation should be counter to the prevailing trend and should be contained within parallel lines. The depth (for bullish flags) or rally (for bearish flags) of this consolidation is calculated to ensure it meets user-defined criteria.
2. SuperTrend Integration : The SuperTrend indicator, known for its simplicity and effectiveness, is integrated into the strategy. It provides a dynamic line on the chart, signaling the prevailing trend. When prices are above the SuperTrend line, it's an indication of an uptrend, and vice versa. This not only confirms the flag pattern's direction but also offers a potential stop-loss level for trades.
When combined, these components allow traders to identify potential breakout (for bullish flags) or breakdown (for bearish flags) scenarios, backed by the momentum indicated by the SuperTrend.
Usage
To use the SuperTrend Enhanced Flag Finder:
- Inputs : Begin by setting the desired parameters. The strategy offers a range of user-controlled settings, allowing for customization based on individual trading preferences and risk tolerance.
- Visualization : Once the parameters are set, the strategy will identify and visually represent flag patterns on the chart. Bullish flags are represented in green, while bearish flags are in red.
- Trade Execution : When a breakout or breakdown is identified, the strategy provides entry signals. It also offers exit signals based on the SuperTrend, ensuring that traders can capitalize on the momentum while managing risk.
Default Settings
The strategy comes with a set of default settings optimized for general use:
- SuperTrend Parameters: Length set to 10 and Factor set to 5.0.
- Bull Flag Criteria: Max Flag Depth at 7, Max Flag Length at 10 bars, Min Flag Length at 3 bars, Prior Uptrend Minimum at 9%, and Flag Pole Length between 7 to 13 bars.
- Bear Flag Criteria: Similar settings adjusted for bearish patterns.
- Display Options: By default, both bullish and bearish flags are displayed, with breakout and breakdown points highlighted.

RedK Relative Strength Ribbon: RS Ribbon and RS ChartsRedK Relative Strength Ribbon (RedK RS_Ribbon) is TA tool that plots the Relative Strength of the current chart symbol against another symbol, or an index of choice. It enables us to see when a stock is gaining strength (or weakness) relative to (an index that represents) the market, and when it hits new highs or lows of that relative strength, which may lead to better trading decisions.
I searched TV for existing RS indicators but didn't find what I really wanted, so I put this together and added some additional features for my own use. It started as a simple RS line with new x-weeks Hi/Lo markers, then evolved into what you see here in v1.0 with the ability to plot a full RS chart in regular or HA candle types. Hope this will be useful to some other growth traders here on TV.
What is Relative Strength (RS)
------------------------------------
(RS is a comprehensive concept in TA, below is a quick summary - please research further if it's not already a familiar topic)
Relative Strength (RS) is a technical concept / indicator used mainly by growth / swing / momentum traders to compare the performance of one security or asset against another. RS measures the price performance of a specific security relative to a benchmark, such as an index or another asset. It's not to be confused with the famous Relative Strength Index (RSI) technical indicator
For example, In the context of comparing a stock's relative strength to the SPY (S&P 500) index, the relative strength calculation involves dividing the stock's price or price-related value (e.g., close price) by the corresponding value of the SPY index. The resulting ratio (and its trend over time) indicates the relative performance of the stock compared to the index.
Traders and investors use relative strength analysis to identify securities that have been showing relative strength or weakness compared to a benchmark, which can help in making investment decisions or identifying the "market leaders" and potential trading opportunities.
There are so many books and documentation about the RS concept and its importance to identify market leaders, especially when recovering from a bear market - if you're interested in the concept, please search more about it and review some of that literature. There's also a more detailed definition of Relative Strength in this article on Invstopedia
RedK RS_Ribbon features and options
---------------------------------------------------
The indicator settings provide many options and features - see the settings box below
- Change / choose base symbol
The default is to use SPY as the base symbol - so we're comparing the chart's symbol to a proxy of the S&P 500 - Some traders may prefer to use the QQQ - or other index or ETF that acts as a proxy for the industry / sector / market they are trading
- RS Calculation / RS line
we use the simple form of the RS calculation,
RS = closing price of current chart symbol / closing price of the base symbol (default is SPY) * 100
some RS documentation will use the Rate of Change (RoC) - but that's not what we're using here.
- The RS_Ribbon
* Once the RS line is plotted, it made sense to add couple of moving averages to it, to make it easier to observe the trend of the RS and the changes in that trend as you can see in the sample chart on top.
* The RS_Ribbon is made up of a fast and slow moving averages and will change color (green / red) based on detected trend RS direction - the 2 MA types and lengths can be changed until you get the setup that provides the best view for you of the RS trend over time. My preferred settings are used as defaults here.
- Identifying New (x)Week Hi/Lo RS Values
* Most traders would be interested when the calculated RS hits a new 52-week high or low value.
* There are cases where we may want to see when a new RS Hi/Lo has been hit for a different period - for example, a quarter (13 weeks)
* the number of weeks can be changed as well as adjusting the numbers of trading days per week (if needed for certain symbols/exchanges)
- Working with Different Timeframes
* Now these "markers" will only be available in the daily and weekly timeframes and there is a good reason for that, it's not the fact that i'm lazy :) and that enabling this in timeframes lower than 1D would have been some heavy lifting, but the reality is that with RS, we're really interested if a "day's close" hits a new RS high or low value against the moving window of x weeks (and the weeks close also) - if you think of this more, at lower TF, RS can hit a lower value that never end up registering on the daily closing and that causes a lot of visual confusion. So i took the "cleaner way out" of that issue.
* note that you can choose a different timeframe for the RS_Ribbon than the chart - if you do, please make sure the chart is at a lower timeframe than the indicator's - (and in that case remember to hide the candles because they won't make much sense)
i wanted to leverage TV's built-in multi-Timeframe (MTF) support with the caveat that using the indicator at lower TF with a chart at a higher TF (example chart at 1Wk and indicator at 1D) will show inaccurate results. If this sounds confusing, keep the indicator TF same as the chart.
the example here shows a 2-Hr chart against 1D RS_Ribbon
- Using RS Charts and RS Candles
* Beside the ability to plot the RS "closing" value with the RS line, the indicator provides the ability to show a "full" RS Chart with candles that represent the relative values of open, high, low. and close against the base symbol.
* the RS Charts can be used for regular chart analysis, for example, we can identify common chart patterns like Cup & Handle, VCP, Head & Shoulder..etc using these charts .. which can provide some edge over the price charts
* for the Heikin Ashi fans, I added the ability to choose classic or HA candles for the chart. note you have to enable the option to show the RS candles first before you choose the option to switch to HA.
The chart below shows a side-by-side comparison on the 2 RS chart types
Closing remarks
-----------------------
* RS is a good way to identify market/sector leaders (who will usually recover from a bear market before others) - and enable us to see the strength that comes from the broader makrket versus the one that comes from the stock's own performance and identify good trading opportunities
* I'll continue to update this work and alerts will come in next version - but wanted to check initial reaction and value
* as usual, if you decide to use this in your chart analysis, it's necessary to combine with other momentum, trend, ...etc indicators and do not make trading decision only based on the signales from a single indicator

Volume ValueWhen VelocityTitle: Volume ValueWhen Velocity Trading Strategy
▶ Introduction:
The " Volume ValueWhen Velocity " trading strategy is designed to generate long position signals based on various technical conditions, including volume thresholds, RSI (Relative Strength Index), and price action relative to the Simple Moving Average (SMA). The strategy aims to identify potential buy opportunities when specific criteria are met, helping traders capitalize on potential bullish movements.
▶ How to use and conditions
★ Important : Only on Spot Binance BINANCE:BTCUSDT
Name: Volume ValueWhen Velocity
Operating mode: Long on Spot BINANCE BINANCE:BTCUSDT
Timeframe: Only one hour
Market: Crypto
currency: Bitcoin only
Signal type: Medium or short term
Entry: All sections in the Technical Indicators and Conditions section must be saved to enter (This is explained below)
Exit: Based on loss limit and profit limit It is removed in the settings section
Backtesting:
⁃ Exchange: BINANCE BINANCE:BTCUSDT
⁃ Pair: BTCUSDT
⁃ Timeframe:1h
⁃ Fee: 0.1%
- Initial Capital: 1,000 USDT
- Position sizing: 500 usdt
-Trading Range: 2022-07-01 11:30 ___ 2023-07-21 14:30
▶ Strategy Settings and Parameters:
1. `strategy(title='Volume ValueWhen Velocity', ...`: Sets the strategy title, initial capital, default quantity type, default quantity value, commission value, and trading currency.
↬ Stop-Loss and Take-Profit Settings:
1. long_stoploss_value and long_stoploss_percentage : Define the stop-loss percentage for long positions.
2. long_takeprofit_value and long_takeprofit_percentage : Define the take-profit percentage for long positions.
↬ ValueWhen Occurrence Parameters:
1. occurrence_ValueWhen_1 and occurrence_ValueWhen_2 : Control the occurrences of value events.
2. `distance_value`: Specifies the minimum distance between occurrences of ValueWhen 1 and ValueWhen 2.
↬ RSI Settings:
1. rsi_over_sold and rsi_length : Define the oversold level and RSI length for RSI calculations.
↬ Volume Thresholds:
1. volume_threshold1 , volume_threshold2 , and volume_threshold3 : Set the volume thresholds for multiple volume conditions.
↬ ATR (Average True Range) Settings:
1. atr_small and atr_big : Specify the periods used to calculate the Average True Range.
▶ Date Range for Back-Testing:
1. start_date, end_date, start_month, end_month, start_year, and end_year : Define the date range for back-testing the strategy.
▶ Technical Indicators and Conditions:
1. rsi: Calculates the Relative Strength Index (RSI) based on the defined RSI length and the closing prices.
2. was_over_sold: Checks if the RSI was oversold in the last 10 bars.
3. getVolume and getVolume2 : Custom functions to retrieve volume data for specific bars.
4. firstCandleColor : Evaluates the color of the first candle based on different timeframes.
5. sma : Calculates the Simple Moving Average (SMA) of the closing price over 13 periods.
6. numCandles : Counts the number of candles since the close price crossed above the SMA.
7. atr1 : Checks if the ATR_small is less than ATR_big for the specified security and timeframe.
8. prevClose, prevCloseBarsAgo, and prevCloseChange : ValueWhen functions to calculate the change in the close price between specific occurrences.
9. atrval: A condition based on the ATR_value3.
▶ Buy Signal Condition:
Condition: A combination of multiple volume conditions.
buy_signal: The final buy signal condition that considers various technical conditions and their interactions.
▶ Long Strategy Execution:
1. The strategy will enter a long position (buy) when the buy_signal condition is met and within the specified date range.
2. A stop-loss and take-profit will be set for the long position to manage risk and potential profits.
▶ Conclusion:
The " Volume ValueWhen Velocity " trading strategy is designed to identify long position opportunities based on a combination of volume conditions, RSI, and price action. The strategy aims to capitalize on potential bullish movements and utilizes a stop-loss and take-profit mechanism to manage risk and optimize potential returns. Traders can use this strategy as a starting point for their own trading systems or further customize it to suit their preferences and risk appetite. It is crucial to thoroughly back-test and validate any trading strategy before deploying it in live markets.
↯ Disclaimer:
Risk Management is crucial, so adjust stop loss to your comfort level. A tight stop loss can help minimise potential losses. Use at your own risk.
How you or we can improve? Source code is open so share your ideas!
Leave a comment and smash the boost button!

Higher Fibonacci EMAOverall image:
If the closing price is higher than the three Fibonacci EMAs (uptrend):
Thanks to @ZenAndTheArtOfTrading and his indicator "Higher Timeframe EMA", URL =
This is a trend-discriminating indicator that uses 3 EMAs.
The Williams Alligator is the underlying philosophy, and we have applied it to capture the larger trend.
It is set up for the current time frame + 2 higher time frames.
One of the upper time legs has a daily EMA length of 13 Fibonacci numbers.
The top-level time leg has a weekly EMA with a length of 5 Fibonacci.
If the current closing price of the ticker leg is higher than these three EMAs, the bar color will be green. If it is lower, it will be red. If it is neither, it will be gray.
If the bar color is green, it suggests that the trend is upward. If it is red, you can consider entering short. If it is gray, it is best not to enter anything.

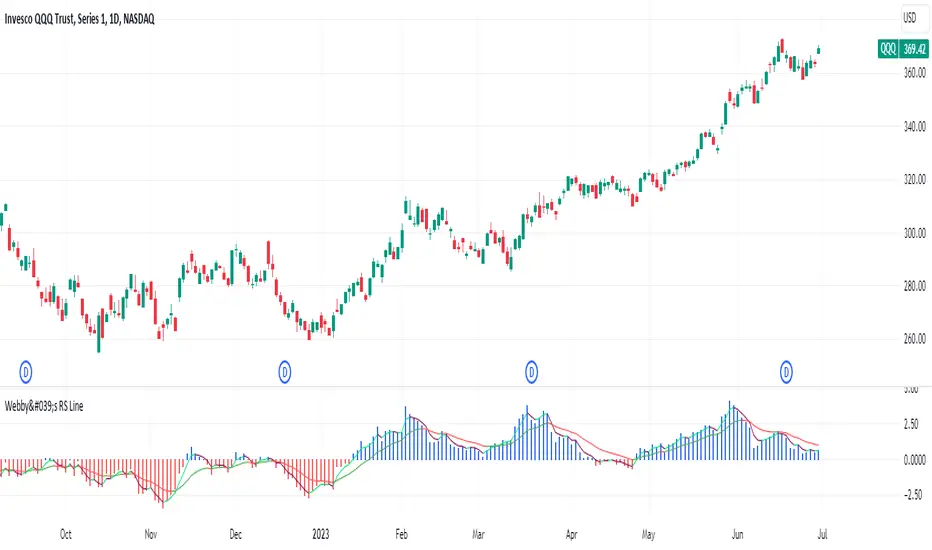
Webby's RS LineThe Relative Strength (RS) line is something many investors are familiar with. It is used to measure a stocks performance versus the S&P 500 and is typically calculated by dividing the closing price of the stock by the closing price of the S&P. This means if a stock moves up and the S&P moves down or the stock moves up more than the S&P the RS line will increase, if the stock moves down while the S&P moves up the line will decrease.
While the standard RS line is a powerful tool, Mike Webster recently discussed how he has made changes to the standard RS line and also uses a 21 exponential moving average of the RS line to help guide his decision making. This script puts those new twists on the standard RS line, by first calculating the RS line using the low of both the security and the S&P rather than the closing prices. Next it measures the 21-day exponential moving average of the RS line and plots the distance between the two as a histogram.
A strong trending stock that is out performing the market will see an extended period of a positive blue histogram signifying the RS line is above the 21-ema.
While on the other hand a stock in a downtrend that is underperforming will see a negative red histogram a red histogram signifying the RS line is below the 21-ema.
On top of all of that, the indicator also keeps 3 & 13 exponential moving average of the distance between the RS line and the 21 ema to help identify shorter term relative strength and capture more immediate shifts in momentum. Both of those are plotted on the histogram as well and will change color as they rise and fall making it easy to spot the direction.
Indicator options include:
Choose symbol to measure performance against
Change histogram colors
Choose ema line width
* Note this indicator does not plot the actual RS line, it is the histogram representing the distance between the RS line calculated using the lows and the 21 ema, as well as the two ema's of the relationship.
Reversal Signals [LuxAlgo]The Reversal Signals indicator is a technical analysis tool that aims to identify when a trend is fading and potentially starting to reverse.
As a counter-trend tool, the Reversal Signals indicator aims to solve the problem of several technical analysis indicators that perform well during trending markets but struggle in ranging markets. By understanding the key concepts and applications of the tool, traders can enhance their market timing and improve their trading strategies.
Note: It's important to explore the settings of the indicator to customize to your own usage & display as there are various options available as covered below.
🔶 USAGE
The Reversal Signals indicator is comprised of two main phases: Momentum Phase and Trend Exhaustion Phase . These phases help identify potential trend reversals in bullish, bearish, and ranging markets.
🔹The Momentum Phase
The momentum phase consists of a 9-candle count and in rare cases 8-candle count. In a bullish trend, a starting number ‘1’ is plotted if a candle closes higher than the close of a candle four periods ago. In a bearish trend, a starting number ‘1’ is plotted if a candle closes lower than the close of a candle four periods ago.
The following numbers are plotted when each successive candle satisfies the four-period rule. The potential reversal point comes when the Reversal Signals plot a label on top of a candle in a bullish trend or at the bottom of a candle in a bearish trend. The momentum phase is immediately canceled if, at any point, a candle fails to satisfy the four-period rule.
Based on the extremes of the momentum phase, the Reversal Signals generate support & resistance levels as well as risk/stop levels.
🔹 The Trend Exhaustion Phase
The trend exhaustion phase starts after completing the momentum phase and consists of a 13-candle count. In a bullish trend exhaustion phase, each candle’s close is compared to the close of two candles earlier, and the close must be greater than the close two periods earlier. In a bearish trend exhaustion phase, each candle’s close is compared to the close of two candles earlier, and the close must be lower than the close two periods earlier.
The trend exhaustion phase does not require a consecutive sequence of candles; if the order of candles is interrupted, the trend exhaustion phase is not canceled. The trend exhaustion phase generates stronger trading signals than the momentum phase, with the potential for longer-lasting price reversals.
🔹 Trading Signals
The Reversal Signals script presents an overall setup and some phase-specific trade setup options, where probable trades might be considered. All phase-specific trade setups, presented as options, are triggered once the selected phase is completed and followed by a price flip in the direction of the trade setup.
Please note that those setups are presented for educational purposes only and do not constitutes professional and/or financial advice
- Momentum: Enter a trade at momentum phase completion, and search for buy (sell) when the bullish (bearish) momentum phase pattern is complete. Ideally, the momentum phase completion should close near its support/resistance line but shall not be above them, which indicates continuation of the trend
- Exhaustion: Enter a trade on trend exhaustion phase completion, and search for buy (sell) when the bullish (bearish) trend exhaustion phase is complete
- Qualified: Buy (sell) when a bullish (bearish) trend exhaustion phase combined with another bullish (bearish) momentum phase sequence is complete
Long trade setups are presented with "L" label and short trade setups with "S" label, where the content of the label displays details related to the probable trade opportunity
Once a phase-specific trade setup is triggered then the Reversal Signals script keeps checking the status of the price action relative to the phase-specific trade setups and in case something goes wrong presents a caution label. Pay attention to the content of the caution labels as well as where they appear. A trade signal, followed immediately by a warning indication can be assumed as a continuation of the underlying trend and can be traded in the opposite direction of the suggested signal
It is strongly advised to confirm trading setups in conjunction with other forms of technical and fundamental analysis, including technical indicators, chart/candlestick pattern analysis, etc.
🔶 DETAILS
The Reversal Signals script performs the detection of the phases by counting the candlestick meeting the specific conditions, which includes:
- Detection of the 8th and 9th candle perfection during the momentum phase
- In some cases, the 8th count will be assumed as momentum phase completion
- Trend exhaustion phase counting stops in case any type of momentum phase completion is detected during the counting process
- Postponing the last count of the trend exhaustion phase, the 13th candle must be below/above the 8th candle and if not the candles will be indicated with '+' sign under them and the script continues to search for a 13th candle at the next ones until the conditions are met
🔶 ALERTS
When an alert is configured, the user will have the ability to be notified in case;
Momentum / Trend Exhaustion phase completion
Support & Resistance level cross detection
Stop / Risk level cross detection
Long / Short Trade Setups are triggered
Please note, alerts are available with 'any alert() function call' and the alerts will be received only for the features that are enabled during alert configuration
🔶 SETTINGS
🔹 Momentum Phase
Display Phases: displays the momentum phases, where the Completed option allows the display of only completed momentum phases. The detailed option allows the display of the entire process of the momentum phase processes
Support & Resistance Levels: Toggles the visibility of the Support & Resistance Levels and Line Styling options
Momentum Phase Risk Levels: Toggles the visibility of the momentum phase Stop/Risk Levels and Line Styling options
For color options please refer to the options available under the style tab
🔹 Trend Exhaustion Phase
Display Phases: displays the trend exhaustion phases, where the Completed option allows the display of only completed trend exhaustion phases. The detailed option allows the display of the entire process of the trend exhaustion phase processes
Trend Exhaustion Phase Risk Levels: Toggles the visibility of the trend exhaustion phase Stop/Risk Levels
Trend Exhaustion Phase Target Levels: Toggles the visibility of the trend exhaustion phase Target Levels
For color options please refer to the options available under the style tab
🔹 Trade Setups
Overall Trend Direction & Trade Setup: displays the overall trend and probable trade setup levels, the users should search for a price flip and confirm with other means of technical and fundamental analysis for the trade setups once the label is plotted
Phase-Specific Trade Setup Options
Momentum: Searches for a trade setup after momentum phase completion
Exhaustion: Searches for a trade setup after trend exhaustion phase completion, stronger trend reversal possibility compared to momentum phase setup
Qualified: Searches for a trade setup after the trend exhaustion phase followed by a momentum phase completion
None: No trade setups are presented
Price Flips against the Phase Specific Trade Setups: enables checking the price action relative to the phase-specific trade setups
🔶 RELATED SCRIPTS
Here are the scripts that may add additional insight during potential trading decisions.
Buyside-Sellside-Liquidity
Support-Resistance-Classification

120x ticker screener (composite tickers)In specific circumstances, it is possible to extract data, far above the 40 `request.*()` call limit for 1 single script .
The following technique uses composite tickers . Changing tickers needs to be done in the code itself as will be explained further.
⎯⎯⎯⎯⎯⎯⎯⎯⎯⎯⎯⎯⎯⎯⎯⎯⎯⎯⎯⎯⎯⎯⎯⎯⎯⎯⎯⎯⎯⎯⎯⎯⎯⎯⎯⎯⎯⎯⎯⎯⎯⎯⎯⎯⎯⎯⎯⎯⎯⎯⎯⎯⎯⎯⎯
🔶 PRINCIPLE
Standard example:
c1 = request.security('MTLUSDT' , 'D', close)
This will give the close value from 1 ticker (MTLUSDT); c1 for example is 1.153
Now let's add 2 tickers to MTLUSDT; XMRUSDT and ORNUSDT with, for example, values of 1.153 (I), 143.4 (II) and 0.8242 (III) respectively.
Just adding them up 'MTLUSDT+XMRUSDT+ORNUSDT' would give 145.3772 as a result, which is not something we can use...
Let's multiply ORNUSDT by 100 -> 14340
and multiply MTLUSDT by 1000000000 -> 1153000000 (from now, 10e8 will be used instead of 1000000000)
Then we make the sum.
When we put this in a security call (just the close value) we get:
c1 = request.security('MTLUSDT*10e8+XMRUSDT*100+ORNUSDT', 'D', close)
'MTLUSDT*10e8+XMRUSDT*100+ORNUSDT' -> 1153000000 + 14340 + 0.8242 = 1153014340.8242 (a)
This (a) will be split later on, for example:
1153014330.8242 / 10e8 = 1.1530143408242 -> round -> in this case to 1.153 (I), multiply again by 10e8 -> 1153000000.00 (b)
We subtract this from the initial number:
1153014340.8242 (a)
- 1153000000.0000 (b)
–––––––––––––––––
14340.8242 (c)
Then -> 14340.8242 / 100 = 143.408242 -> round -> 143.4 (II) -> multiply -> 14340.0000 (d)
-> subtract
14340.8242 (c)
- 14340.0000 (d)
––––––––––––
0.8242 (III)
Now we have split the number again into 3 tickers: 1.153 (I), 143.4 (II) and 0.8242 (III)
⎯⎯⎯⎯⎯⎯⎯⎯⎯⎯⎯⎯⎯⎯⎯⎯⎯⎯⎯⎯⎯⎯⎯⎯⎯⎯⎯⎯⎯⎯⎯⎯⎯⎯⎯⎯⎯⎯⎯⎯⎯⎯⎯⎯⎯⎯⎯⎯⎯⎯⎯⎯⎯⎯⎯
In this publication the function compose_3_() will make a composite ticker of 3 tickers, and the split_3_() function will split these 3 tickers again after passing 1 request.security() call.
In this example:
t46 = 'BINANCE:MTLUSDT', n46 = 10e8 , r46 = 3, t47 = 'BINANCE:XMRUSDT', n47 = 10e1, r47 = 1, t48 = 'BINANCE:ORNUSDT', r48 = 4 // T16
•••
T16= compose_3_(t48, t47, n47, t46, n46)
•••
= request.security(T16, res, )
•••
= split_3_(c16, n46, r46, n47, r47, r48)
🔶 CHANGING TICKERS
If you need to change tickers, you only have to change the first part of the script, USER DEFINED TICKERS
Back to our example, at line 26 in the code, you'll find:
t46 = 'BINANCE:MTLUSDT', n46 = 10e8 , r46 = 3, t47 = 'BINANCE:XMRUSDT', n47 = 10e1, r47 = 1, t48 = 'BINANCE:ORNUSDT', r48 = 4 // T16
( t46 , T16 ,... will be explained later)
You need to figure out how much you need to multiply each ticker, and the number for rounding, to get a good result.
In this case:
'BINANCE:MTLUSDT', multiply number = 10e8, round number is 3 (example value 1.153)
'BINANCE:XMRUSDT', multiply number = 10e1, round number is 1 (example value 143.4)
'BINANCE:ORNUSDT', NO multiply number, round number is 4 (example value 0.8242)
The value with most digits after the decimal point by preference is placed to the right side (ORNUSDT)
If you want to change these 3, how would you do so?
First pick your tickers and look for the round values, for example:
'MATICUSDT', example value = 0.5876 -> round -> 4
'LTCUSDT' , example value = 77.47 -> round -> 2
'ARBUSDT' , example value = 1.0231 -> round -> 4
Value with most digits after the decimal point -> MATIC or ARB, let's pick ARB to go on the right side, LTC at the left of ARB, and MATIC at the most left side.
-> 'MATICUSDT', LTCUSDT', ARBUSDT'
Then check with how much 'LTCUSDT' and 'MATICUSDT' needs to be multiplied to get this: 5876 0 7747 0 1.0231
'MATICUSDT' -> 10e10
'LTCUSDT' -> 10e3
Replace:
t46 = 'BINANCE:MTLUSDT', n46 = 10e8 , r46 = 3, t47 = 'BINANCE:XMRUSDT', n47 = 10e1, r47 = 1, t48 = 'BINANCE:ORNUSDT', r48 = 4 // T16
->
t46 = 'BINANCE:MATICUSDT', n46 = 10e10 , r46 = 4, t47 = 'BINANCE:LTCUSDT', n47 = 10e3, r47 = 2, t48 = 'BINANCE:ARBUSDT', r48 = 4 // T16
DO NOT change anything at t46, n46,... if you don't know what you're doing!
Only
• tickers ('BINANCE:MTLUSDT', 'BINANCE:XMRUSDT', 'BINANCE:ORNUSDT', ...),
• multiply numbers (10e8, 10e1, ...) and
• round numbers (3, 1, 4, ...)
should be changed.
There you go!
🔶 LIMITATIONS
🔹 The composite ticker fails when 1 of the 3 isn't in market in the weekend, while the other 2 are.
That is the reason all tickers are crypto. I think it is possible to combine stock,... tickers, but they have to share the same market hours.
🔹 The number cannot be as large as you want, the limit lays around 15-16 digits.
This means when you have for example 123, 45.67 and 0.000000000089, you'll get issues when composing to this:
-> 123045670.000000000089 (21 digits)
Make sure the numbers are close to each other as possible, with 1 zero (or 2) in between:
-> 1.230045670089 (13 digits by doing -> (123 * 10e-3) + (45.67 * 10e-7) + 0.000000000089)
🔹 This script contains examples of calculated values, % change, SMA, RMA and RSI.
These values need to be calculated from HTF close data at current TF (timeframe).
This gives challenges. For example the SMA / %change is not a problem (same values at 1h TF from Daily data).
RMA , RSI is not so easy though...
Daily values are rather similar on a 2-3h TF, but 1h TF and lower is quite different.
At the moment I haven't figured out why, if someone has an idea, don't hesitate to share.
The main goal of this publication is 'composite tickers ~ request.security()' though.
🔹 When a ticker value changes substantially (x10, x100), the multiply number needs to be adjusted accordingly.
🔶 SETTINGS
SHOW SETS
SET
• Length : length of SMA, RMA and RSI
• HTF : Higher TimeFrame (default Daily)
TABLE
• Size table : \ _ Self-explanatory
• Include exchange name : /
• Sort : If exchange names are shown, the exchanges will be sorted first
COLOURS
• CH%
• RSI
• SMA (RMA)
DEBUG
Remember t46 , T16 ,... ?
This can be used for debugging/checking
ALWAYS DISABLE " sort " when doing so.
Example:
Set string -> T1 (tickers FIL, CAKE, SOL)
(Numbers are slightly different due to time passing by between screen captures)
Placing your tickers at the side panel makes it easy to compare with the printed label below the table (right side, 332201415014.45 ),
together with the line T1 in the script:
t1 = 'BINANCE:FILUSDT' , n1 = 10e10, r1 = 4, t2 = 'BINANCE:CAKEUSDT' , n2 = 10e5 , r2 = 3, t3 = 'BINANCE:SOLUSDT' , r3 = 2 // T1
FIL : 3.322
CAKE: 1.415
SOL : 14.56
Now it is easy to check whether the tickers are placed close enough to each other, with 1-2 zero's in between.
If you want to check a specific ticker, use " Show Ticker" , see out initial example:
Set string -> T16
Show ticker -> 46 (in the code -> t46 = 'BINANCE:MTLUSDT')
(Set at 0 to disable " check string " and NONE to disable " Set string ")
-> Debug/check/set away! 😀
🔶 OTHER TECHNIQUES
• REGEX ( Regular expression ) and str.match() is used to delete the exchange name from the ticker, in other words, everything before ":" is deleted by following regex:
exch(t) => incl_exch ? t : str.match(t, "(?<=:) +")
• To sort, array.sort_indices() is used (line 675 in the code), just as in my first "sort" publication Sort array alphabetically - educational
aSort = arrT.copy()
sort_Indices = array.sort_indices(id= aSort, order= order.ascending)
• Numbers and text colour will adjust automatically when switching between light/dark mode by using chart.fg_color / chart.bg_color
🔹 DISCLAIMER
Please don't ask me for custom screeners, thank you.

LNL Scalper ArrowsLNL Scalper Arrows
The indicator consist of various different types of candlestick patterns that are truly time tested by multiple veteran traders. These arrows are a combination of short-term scalping strategies taught by Linda Raschke & a trader that goes by name Quant Trade Edge. These strategies/patterns occur regularly within the markets. They offer high probability quick moves during the trending days. These four patterns are based on pure price action, no oscillators, no trend, no momentum indicators involved. Trend (ema) is there just as a simple trend gauge.
LNL Scalper Arrows were designed specifically for intra-day trading. Mostly useful for the futures but also stocks as well. These arrows can work anywhere between the fast-moving 512 or 1600 tick charts to a 1min, 2min and up to 5min or 10min charts.
Trend Gauge (Exponential Moving Average)
Nothing fancy just a classic EMA that can guide the direction of the short-term trend. I have added a custom coloring of the EMA that is based on a simple RSI filter. That should help to visualize the non-directional moments within the trend. Although the length is adjustable, for scalping it is better to focus on smaller periods such as 9, 13 or 20 or 34 but anything above 50 loses its purpose as a short-term trend gauge. Again, this is a scalping tool not a trend tool, you are not going to get rid of the fakeouts by increasing the period of the trend.
Tail Arrows (Eat the Tail Pattern)
Tail is a candlestick that is either a price rejection spike, or a flag continuation pattern on a lower time frame. A failed action. It is basically a candle with much bigger wick (shadow) of the candle than the actual body. Such candles are usually telling us about strong participation from the other side of the market. Eat the tail pattern occurs whenever the low of the Tail candle is immediately broken on a following candle "the tail is eaten alive". Such a breaks occurs in a most aggressive types of markets with a strong momentum. DO NOT try to trade this in a low volume or a ranging market. Tail Arrows are the most aggressive arrows & should be only used on the highest volume or a parabolic momentum markets.
Scalp Arrows (Scallop Pattern)
Known as Scallops or minor lows or highs, these patterns are the most common within the all scalper arrows. They occur regularly on 1min & 5min charts - basically everyday. Scallops provide the best possible risk to reward entry within the trend without the need of any indicators or oscillators. The Scallop Up 3 bar pattern consist of a high that is lower that the previous high but also low that is lower than the previous low. Scallop Up or a minor low triggers when the last high is broken, creating a three bar mountain or a peak within the 5 bar span.
Hoagie Arrows (Hoagie Pattern)
Hoagies occur way less often than any other scalping patterns. Hoagies represent two (or more) inside candles within the shadow of a first candle. Such a formation is creating a small compression or a range that sooner or later breaks out. The hoagie is triggered whenever the high or low of the shadow (first) candle is broken. The great thing about the hoagies is that they can work either way despite the trend direction. Although this indicator is coded for the 2 bar hoagies, there are no limitations on how much inside bars can hoagie include.
Umbrella Arrows (Umbrella Pattern)
Another really awesome 3 bar pattern that is really fun to trade. Umbrella occurs when the candle before the previous candle is a pin bar or a tail bar and the body of the previous candle is within the shadow or a wick of the candle before. The umbrella is triggered once the high or low of the previous bar is broken. Umbrellas are more frequent than Hoagies but occur much less than the Scallops.
Outside Bar Wedges (Outside Bar Pattern)
Pretty much self-explanatory candlestick pattern. Outside Bar is basically any bar that peaks outside of the both ends of the previous candle. So the range of the candle is higher & it looked beyond the high and beyond the low of the previous candle. These candles are signalizing the potenial momentum change. Ouside Bars usually occur at the tops or bottoms of the moves. I decided to add them because they can serve as a great addition to these scalping patterns.
Signal vs. SignalBreak Mode
The trigger can be viewed in two different ways:
1. Signal: Plots the trigger before the trigger bar, basically right when the pattern is formed but NOT YET triggered. The signal is triggered once the next candle break the high or low of the current candle.
2. SignalBrake: Plots the trigger after the break of the high or low of the actual pattern. It is basically a candle after the signal candle. (Signal is better for trading because it gives you time to prepare for the actual break of the high or low = the actual signal. SignalBrake is great for looking back in history only for the patterns that actually traded).
Pin Bar BTW Ratio
Pin Bar (Body-To-Wick) Ratio represents the size of the body of a pin bar candle for Eat the Tail and Umbrella patterns. Pin Bar BTW Ratio measures the ratio between the wick & the body of the candle. Ref. interval is 2.0 - 5.0 (ideal pin bar is 2.0 - 3.0 = the wick or a shadow is 2x - 3x bigger than the body of the candle)
ATR Stop & Target Labels
I also created three simple labels (tables) that can show you the ideal target & stop as well as the current ATR. Since LNL Scalper Arrows consist of high probability scalping patterns, a good rule of thumb to follow is to use a half of the current ATR as a target and a current ATR as a stop (or two times the target). So if the current 7 period ATR is 30 the target would be 15 pts. and a stop around 30 pts. With such a risk management you should aim for a win rate 70% or higher. Obviously you can adjust the risk management in the settings to your personal preference.
Low Range vs. High Range Markets
There are two major downsides with the Scalper Arrows:
1. You need volume and a volatility. These patterns really do struggle in ranging "boring" sideways action. It is absolutely crucial to recognize the current market environment and really stay cautions and (or completely out) in case the chop continues. Adding something like DMI can help you recognize the potential flat markets.
2. Not only do you need volume & momentum, you also need a decent range. This indicator works better on a rangy market such as NQ futures or YM. But are much tougher to trade on lower range markets such as some stocks or ZB futures or basically any other lower range market.
Hope it helps.

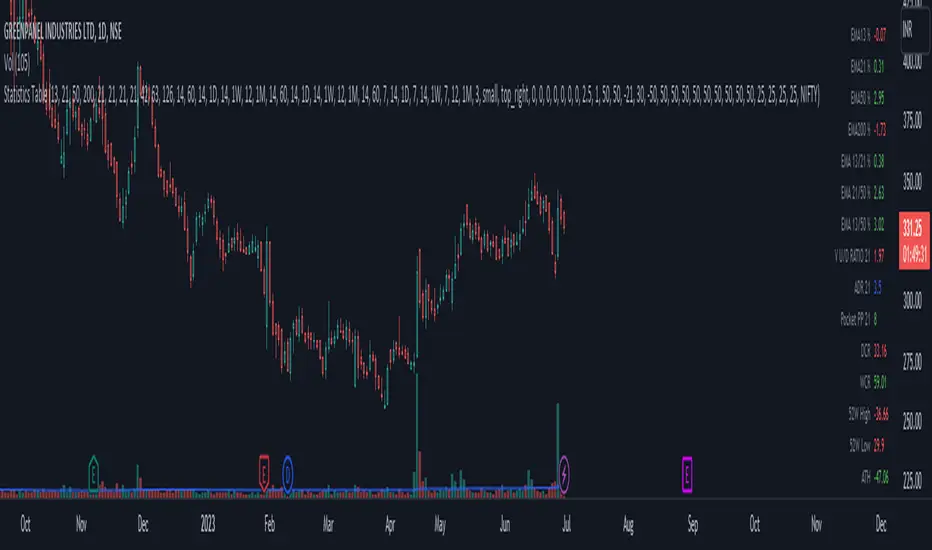
Statistics TableThis script display some useful Statistics data that can be useful in making trading decision.
Here the list of information this script is display in table format.
You can change each and every single ema and rs length as per your need from setting.
1) close difference from first ema
2) close difference from second ema
3) close difference from third ema
4) close difference from fourth ema
5) difference between first and second ema
6) difference between second and third ema
7) difference between first and third ema
8) volume up down ratio
9) ATR/ADR %
10) volume pocket pivot count
11) daily closing range
12) weekly closing range
13) close difference from 52week high
14) close difference from 52week low
15) close difference from All time high
16) close difference from All time low
17) rs line above or below first rs ema
18) rs line above or below second rs ema
19) rs line above or below third rs ema
20) rs line above or below fourth rs ema
21) first rs value
22) second rs value
23) third rs value
24) fourth rs value
25) difference between previous first rs length days change % and current first rs length days change %
26) difference between previous second rs length days change % and current second rs length days change %
27) difference between previous third rs length days change % and current third rs length days change %
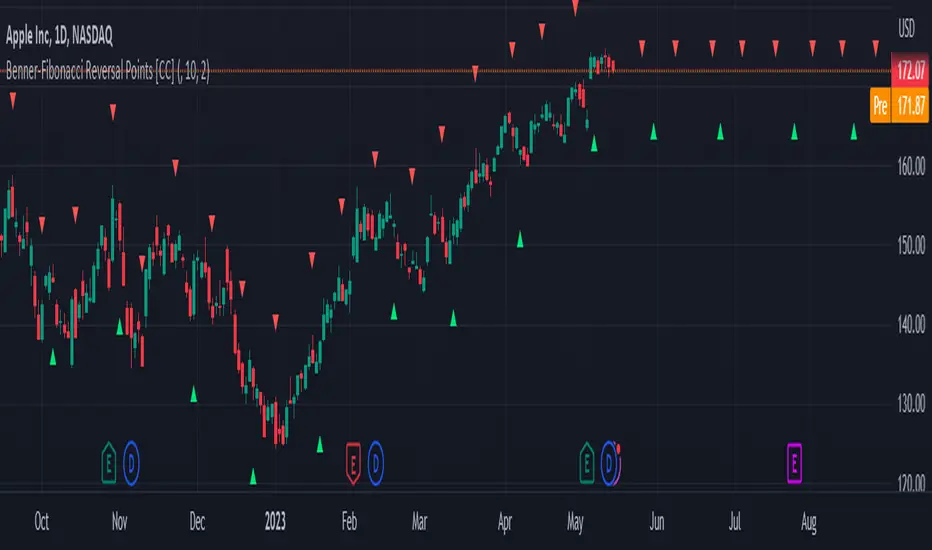
Benner-Fibonacci Reversal Points [CC]This is an original script based on a very old idea called the Benner Theory from the Civil War times. Benner discovered a pattern in pig iron prices (no clue what those are), and this turned out to be a parallel idea to indicators based on Fibonacci numbers. Because a year is 365 days (nearly 377, which is a Fibonacci number), made up of 52 weeks (nearly 55, which is another Fibonacci number), or 12 months (nearly 13, which is another Fibonacci number), Benner theorized that he could find both past and future turning points in the market by using a pattern he found. He discovered that peaks in prices seemed to follow a pattern of 8-9-10, meaning that after a recent peak, it would be 8 bars until the next peak, 9 bars until after that peak for the next, and 10 bars until the following peak. For past peaks, he would just need to reverse this pattern, and so the previous peak would be 10 bars before the most current peak, 9 bars before that peak, and 8 bars before the previous one, and these patterns seemed to repeat. For troughs, he found a pattern of 16,18,20 which follows the same logic, and this idea also seemed to work on long-term peaks and troughs as well.
This is my version of the Benner theory and the major difference between my version and his is that he would manually select a year or date and either work backwards or forwards from that point. I chose to go with an adaptive version that will automatically detect those points and plot those past and future points. I have included several options such as allowing the algorithm to be calculated in reverse which seems to work well for Crypto for some reason. I also have both short and long term options to only show one or both if you choose and of course the option to enable repainting or leave it disabled.
Big thanks to @HeWhoMustNotBeNamed and @RicardoSantos for helping me fix some bugs in my code and for @kerpiciwuasile for suggesting this idea in the first place.
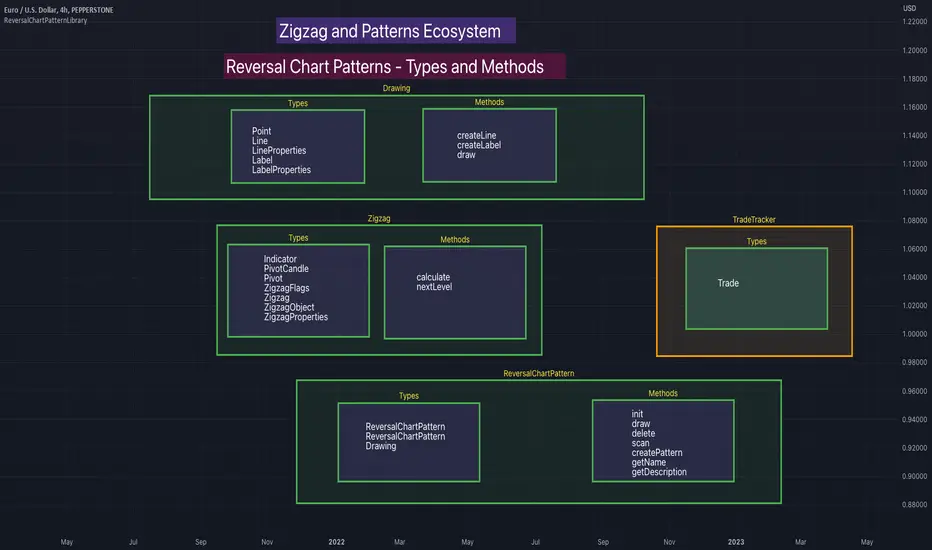
ReversalChartPatternLibraryLibrary "ReversalChartPatternLibrary"
User Defined Types and Methods for reversal chart patterns - Double Top, Double Bottom, Triple Top, Triple Bottom, Cup and Handle, Inverted Cup and Handle, Head and Shoulders, Inverse Head and Shoulders
method delete(this)
Deletes the drawing components of ReversalChartPatternDrawing object
Namespace types: ReversalChartPatternDrawing
Parameters:
this (ReversalChartPatternDrawing) : ReversalChartPatternDrawing object
Returns: current ReversalChartPatternDrawing object
method delete(this)
Deletes the drawing components of ReversalChartPattern object. In turn calls the delete of ReversalChartPatternDrawing
Namespace types: ReversalChartPattern
Parameters:
this (ReversalChartPattern) : ReversalChartPattern object
Returns: current ReversalChartPattern object
method lpush(this, obj, limit, deleteOld)
Array push with limited number of items in the array. Old items are deleted when new one comes and exceeds the limit
Namespace types: ReversalChartPattern
Parameters:
this (ReversalChartPattern ) : array object
obj (ReversalChartPattern) : ReversalChartPattern object which need to be pushed to the array
limit (int) : max items on the array. Default is 10
deleteOld (bool) : If set to true, also deletes the drawing objects. If not, the drawing objects are kept but the pattern object is removed from array. Default is false.
Returns: current ReversalChartPattern object
method draw(this)
Draws the components of ReversalChartPatternDrawing
Namespace types: ReversalChartPatternDrawing
Parameters:
this (ReversalChartPatternDrawing) : ReversalChartPatternDrawing object
Returns: current ReversalChartPatternDrawing object
method draw(this)
Draws the components of ReversalChartPatternDrawing within the ReversalChartPattern object.
Namespace types: ReversalChartPattern
Parameters:
this (ReversalChartPattern) : ReversalChartPattern object
Returns: current ReversalChartPattern object
method scan(zigzag, patterns, errorPercent, shoulderStart, shoulderEnd)
Scans zigzag for ReversalChartPattern occurences
Namespace types: zg.Zigzag
Parameters:
zigzag (Zigzag type from HeWhoMustNotBeNamed/ZigzagTypes/2) : ZigzagTypes.Zigzag object having array of zigzag pivots and other information on each pivots
patterns (ReversalChartPattern ) : Existing patterns array. Used for validating duplicates
errorPercent (float) : Error threshold for considering ratios. Default is 13
shoulderStart (float) : Starting range of shoulder ratio. Used for identifying shoulders, handles and necklines
shoulderEnd (float) : Ending range of shoulder ratio. Used for identifying shoulders, handles and necklines
Returns: int pattern type
method createPattern(zigzag, patternType, patternColor, riskAdjustment)
Create Pattern from ZigzagTypes.Zigzag object
Namespace types: zg.Zigzag
Parameters:
zigzag (Zigzag type from HeWhoMustNotBeNamed/ZigzagTypes/2) : ZigzagTypes.Zigzag object having array of zigzag pivots and other information on each pivots
patternType (int) : Type of pattern being created. 1 - Double Tap, 2 - Triple Tap, 3 - Cup and Handle, 4 - Head and Shoulders
patternColor (color) : Color in which the patterns are drawn
riskAdjustment (float) : Used for calculating stops
Returns: ReversalChartPattern object created
method getName(this)
get pattern name of ReversalChartPattern object
Namespace types: ReversalChartPattern
Parameters:
this (ReversalChartPattern) : ReversalChartPattern object
Returns: string name of the pattern
method getDescription(this)
get consolidated description of ReversalChartPattern object
Namespace types: ReversalChartPattern
Parameters:
this (ReversalChartPattern) : ReversalChartPattern object
Returns: string consolidated description
method init(this)
initializes the ReversalChartPattern object and creates sub object types
Namespace types: ReversalChartPattern
Parameters:
this (ReversalChartPattern) : ReversalChartPattern object
Returns: ReversalChartPattern current object
ReversalChartPatternDrawing
Type which holds the drawing objects for Reversal Chart Pattern Types
Fields:
patternLines (Line type from HeWhoMustNotBeNamed/DrawingTypes/1) : array of Line objects representing pattern
entry (Line type from HeWhoMustNotBeNamed/DrawingTypes/1) : Entry price Line
target (Line type from HeWhoMustNotBeNamed/DrawingTypes/1) : Target price Line
patternLabel (Label type from HeWhoMustNotBeNamed/DrawingTypes/1)
ReversalChartPattern
Reversal Chart Pattern master type which holds the pattern components, drawings and trade details
Fields:
pivots (Pivot type from HeWhoMustNotBeNamed/ZigzagTypes/2) : Array of Zigzag Pivots forming the pattern
patternType (series int) : Defines the main type of pattern 1 - Double Tap, 1 - Triple Tap, 3 - Cup and Handle, 4 - Head and Shoulders
patternColor (series color) : Color in which the pattern will be drawn on chart
riskAdjustment (series float) : Percentage adjustment of risk. Used for setting stops
drawing (ReversalChartPatternDrawing) : ReversalChartPatternDrawing object which holds the drawing components
trade (Trade type from HeWhoMustNotBeNamed/TradeTracker/1) : TradeTracker.Trade object holding trade components
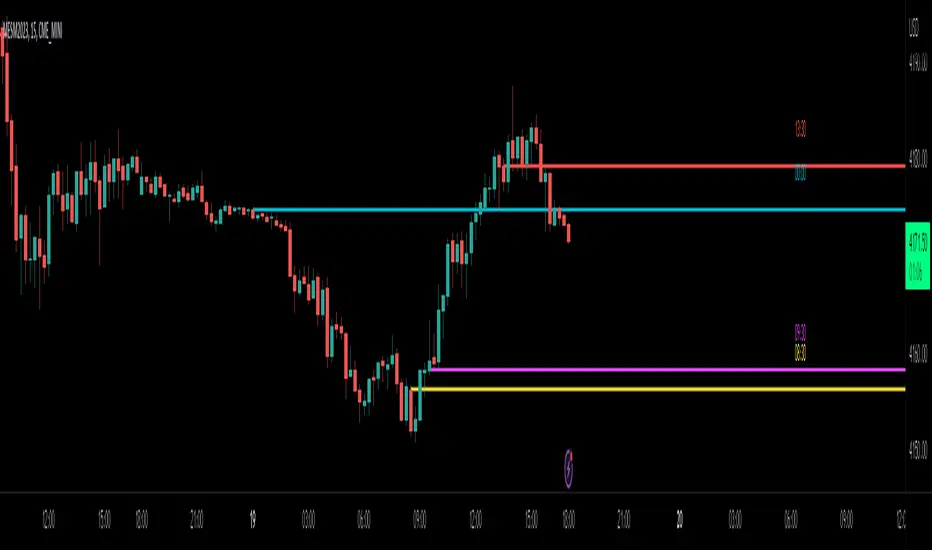
ICT Opening Lines [MK]Plots horizontal lines for the following opening times:
00:00 open
08:30 open
09:30 open
13:30 open
Opening lines can be used to monitor for power of 3/judas swings as per ICT teachings. The script allows the user to set a maximum timeframe for displaying the lines to keep HTF charts clean. Also an option is available to hide the lines after the market closes. If the hide option is used, the lines will be removed at 23:00.
Removing the lines after market closes ensures that the charts are clean when the market opens.
Labels can be displayed, colors and line styles can be customised.
RSI and Stochastic Probability Based Price Target IndicatorHello,
Releasing this beta indicator. It is somewhat experimental but I have had some good success with it so I figured I would share it!
What is it?
This is an indicator that combines RSI and Stochastics with probability levels.
How it works?
This works by applying a regression based analysis on both Stochastics and RSI to attempt to predict a likely close price of the stock.
It also assess the normal distribution range the stock is trading in. With this information it does the following:
2 lines are plotted:
Yellow line: This is the stochastic line. This represents the smoothed version of the stochastic price prediction of the most likely close price.
White Line: This is the RSI line. It represents the smoothed version of the RSI price prediction of the most likely close price.
When the Yellow Line (Stochastic Line) crosses over the White Line (the RSI line), this is a bearish indication. It will signal a bearish cross (red arrow) to signal that some selling or pullback may follow.
IF this bearish cross happens while the stock is trading in a low probability upper zone (anything 13% or less), it will trigger a label to print with a pullback price. The pullback price is the "regression to the mean" assumption price. Its the current mean at the time of the bearish cross.
The inverse is true if it is a bullish cross. If the stock has a bullish cross and is trading in a low probability bearish range, it will print the price target for a regression back to the upward mean.
Additional information:
The indicator also provides a data table. This data table provides you with the current probability range (i.e. whether the stock is trading in the 68% probability zone or the outer 13, 2.1 or 0.1 probability zones), as well as the overall probability of a move up or down.
It also provides the next bull and bear targets. These are calculated based on the next probability zone located immediately above and below the current trading zone of the stock.
Smoothing vs Non-smoothed data:
For those who like to assess RSI and Stochastic for divergences, there is an option in the indicator to un-smooth the stochastic and RSI lines. Doing so looks like this:
Un-smoothing the RSI and stochastic will not affect the analysis or price targets. However it does add some noise to the chart and makes it slightly difficult to check for crosses. But whatever your preference is you can use.
Cross Indicators :
A bearish cross (stochastic crosses above RSI line) is signalled with a red arrow down shape.
A bullish cross (RSI crosses above stochastic line) is signalled with a green arrow up shape.
Labels vs Arrows:
The arrows are lax in their signalling. They will signal at any cross. Thus you are inclined to get false signals.
The labels are programmed to only trigger on high probability setups.
Please keep this in mind when using the indicator!
Warning and disclaimer:
As with all indicators, no indicator is 100% perfect.
This will not replace the need for solid analysis, risk management and planning.
This is also kind of beta in its approach. As such, there are no real rules on how it should be or can be applied rigorously. Thus, its important to exercise caution and not rely on this alone. Do your due diligence before using or applying this indicator to your trading regimen.
As it is kind of different, I am interested in hearing your feedback and experience using it. Let me know your feedback, experiences and suggestions below.
Also, because it does have a lot of moving parts, I have done a tutorial video on its use linked below:
Thanks for checking it out, safe trades everyone and take care!

SPY 1 Minute Day TraderWhen scalping options, users are looking for where breakouts are going to occur instead of sitting thru areas choppy price action that drain delta and cause them to lose value even if price is up trending. This script tries to identify when a trend reversal is expected based on one minute price action on the SPY. It alerts users to prepare for potential breakout when 5 out of the 6 key optimized parameters are discovered by showing a white L or S. Once all six trigger, it informs the user at the close of that candle with a golden triangle with Pivot Up or Pivot Down. As scalping options is something that is expected to be short in duration, a take profit and stop loss of 30 cents of price actions is established. If five or more parameters occur after the pivot is initiated, then stop losses and take profits are adhered to; however, if there are less, then it waits to take profit or stop the trade, as likely it is just noise and it will finish trend with an additional breakout.
This script has been created to take into account how the following variables impact trend for SPY 1 Minute:
ema vs 13 ema : A cross establishes start of trend
MACD (Line, Signal & Slope) : If you have momentum
ADX : if you are trending
RSI : If the trend has strength
The above has been optimized to determine pivot points in the trend using key values for these 6 indicators
bounce up = ema5 > ema13 and macdLine < .5 and adx > 20 and macdSlope > 0 and signalLine > -.1 and rsiSignal > 40
bounce down = ema5 < ema13 and macdLine > -.5 and adx > 20 and signalLine < 0 and macdSlope < 0 and rsiSignal < 60
White L's indicate that 5 of 6 conditions are met due to impending uptrend w/ missing one in green below it
Yellow L's indicate that 6 of 6 conditions still are met
White S's indicate that 5 of 6 conditions are met due to impending downtrend w/ missing condition in red above it
Yellow S's indicate that 6 of 6 conditions still are met
After a downtrend or uptrend is established, once it closes it can't repeat for 10 minutes
Won't open any trades on last two minutes of any hours to avoid volatility
Will close any open trades going into last minute of hour to avoid large overnight random swings.

Negroni MA & RSI Strategy, plus trade entry and SL/TP optionsI will start with the context, and some things to think about when using a strategy tool to back-test ideas.
CONTEXT
FIRST: This is derived from other people's work, but I honestly hadn't found a mixed indicator MA strategy tool that does what this now does. If it is out there, apologies!!
This tool can help back-test various MA trends (SMA, EMA, HMA, VWMA); as well as factoring in RSI levels (or not); and can factor in a fixed HTF MA (or not). You can apply a 'retest entry' or a 'breakout entry', and you can also apply various risk mgt for SL/TP orders: 1) No SL/TP; or 2) a fixed %, or 3) dynamic ATR multipliers.
Find below, some details explaining what this tool is attempting to do.
Thank you, tack, salute!
THINGS TO REVIEW (it is not just about 'profitability'!!)
Whilst discretion is always highly encouraged as a trader, and a 100% indicator-driven strategy is VERY unlikely to yield sustainable results going forward, at the very least back-testing your strategies can help provide some guidance, not just on win rate Vs profit factor, but other things including:
a) Trade frequency: if a strategy has an 75% win rate and profit factor of 4, with all your parameters and confluence checks, but only triggers 3 trades every 5 years, is that realistically implementable to your trading situation if you have a $10,000 account?
b) Trade entry type: is it consistently better to wait for a retest of an 'MA zone', or is it better to market buy/sell on breakout of the 'MA zone'?
c) Risk management (SL/TP): is it consistently better to have a fixed static % for SL/TP ("I always place my stops 2% away, whether it is EURUSD or BTCUSDT"), or would you be better placed to try using an ATR multiplier of the respective assets?
d) Moving average type: is your old faithful 100 EMA really serving you well, or is the classic SMA more reliable, or how about the HMA, or the VWMA? Is the 100/200 cross holding up, or do you need something more sensitive? Is there any significant difference between a 10 EMA/20 EMA trend zone compared to a 13 EMA /25 EMA zone?
e) Confluence: Do added confluence checks (RSI, higher timeframe MA) actually improve profitability? But even if they do, is at the cost of cutting too many trades?
INPUTS AND PARAMETERS
Choice 1) Entry Strategy: Retest or Breakout - You can select both!
[ ]:
a) RETEST entry strat: price crosses UNDER FastMA INTO the 'MA trend zone'.
b) BREAKOUT entry strat: price crosses OVER FastMA OUT the 'MA trend zone'.
Choice 2) Risk Management (SL and TP) - You can select more than 1 strategy!
a) No SL/TP: Long trades are closed when the LOW crosses back UNDER the fastMA again, and shorts are closed when the HIGH crosses back OVER the fastMA again.
b) Static % SL/TP: Your SL/TP will be a fixed % away from avg. position price... WARNING: You should change this for various asset classes; FX vol is not the same as crypto altcoin vol!
c) Dynamic ATR SL/TP: Your SL/TP is a multiple of your selected ATR range (default is 50, see 'info' when you select ATR range). ATR accounts for the change in vol of different asset classes somewhat, HOWEVER... you should probably still not have the same multiplier trading S&P500 as you would trading crypto altcoins!
Then select your preferred parameters: EMA, SMA, HMA, VWMA, etc. You can mix and match, and most options have a info/tooltip guide.
RSI note: If you don't care for RSI levels, then set buy signal at 1... i.e always buys! Similarly set sell signal at 99.
ATR note: standard ATR length is usually 14, however... your SL/TP will move POST entry, and can tighten or widen your initial SL/TP... for better AND usually for worse! Go find a trade (strat 3) on the chart, look at the SL/TP lines, now change the number to 5, you'll see.
Fixed HTF MA note: If you don't care for HTF MA confluence, just change the timeframe/options to match the 'Slow MA' options you've chosen.

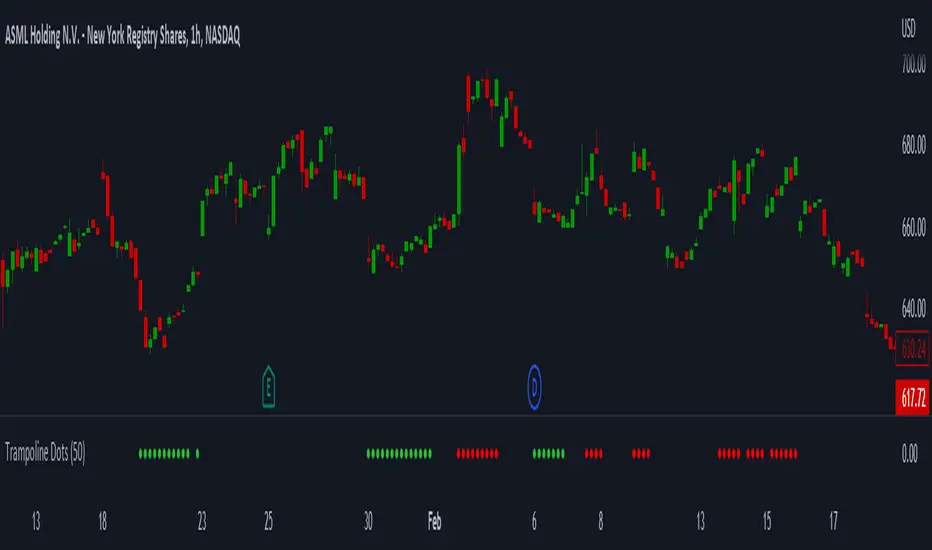
Trampoline DotsTrampoline Dots (Price Divergence)
Higher Time Frame Price Divergence:
Trampoline Dots serve as a "quick bounce" tool. These little dots will trigger whenever the higher aggregation MACD is above / below zero and the price is below / above the 50 period simple moving average. When these criteria are met, the price is usually under pressure of strong divergence, more often than not price will sharply reverse into the trend direction usually within the next few bars.
The Use of The Trampoline Dots:
This indicator can serve multiple ways. Obviously the main use case is the price divergence. These "dots" will not give you any precise & exact entry. But rather a zone of possible incoming reversal. There is no timing to it. All these dots will do is warn you about potential sharp reversal in the upcoming bars. It can be used by itself alone for sure, but the best way to utilize the dots is to use them in combination of other trend or momentum studies. The best signals are the ones that are within the larger time frame trend. Another great thing is that the visuals are really straight-forward and simple. It is either green dot or a red dot. Nothing more, nothing less. Also since the indicator is pretty small, it can be easily layered onto other studies as well which can create an additional confirmation for different patterns or setups.
Which Time Frame Are Reliable?
This indicator works on any time frame. But the most "stable" one is the daily & hourly time frame. My personal favorite is the hourly since these divergences can produce amazing entries in the daily trends (which are usually hidden on the daily chart). In the most aggresive trends, I like to see the green dots triggering around the 8 EMA and 13 EMA. Daily chart can show the daily and weekly (big divergences) that can take multiple days & weeks to resolve.
Hope it helps.
[blackcat] L2 Aroon13Level 2
Background
The Aroon indicator developed by Tushar Chanand indicates whether there is a trend price or is located in a trading area.
Function
Classical Aroon can also show the beginning of a new trend, its strength and expectation of changes from trade areas to trends. This is a traditional aroon indicator with length == 13, which exhibit good performance.
Remarks
Feedbacks are appreciated.

Crossing TableCrossing Table V1
I created this indicator as it had been asked for a number of times to create a crossover/under table screen and here it is!!!
The indicator is set up to be selected from SMA, EMA and Volume.
The SMA is defaulted to 2/10 but it is customizable to whatever SMA you choose to use.
Volume is based off a volume formula and the volume settings in the indicators settings, and the table will show either buyers/sellers on the last candle on the volume in the settings.
Just like the SMA the EMA option will be based off the default value of 5/13 but can be customized to your choosing.
If there are any question or comments just let me know :)

VIB / GIB v1.0The VIB / GIB indicator
V1 ----- 13 Feb 2023 ------------ Inital release.
This gives the user the ability to easily display VIB(Volume ImBalances) and GIB(Gap ImBalances) on their chart.
Volume imbalances (VIB) are created when there is a price difference between the close of a candle and the opening of the next candle. This price difference can be used as a level of support or resistance in future trading.
A Gap imbalance (GIB) has the same principles as a VIB, but also has the feature that no wick closes through the gap, showing an even more powerful imbalance in the market at that point.
GIBs and VIBs can be individually switched on or off via the settings, and optional icons can also be activated or not to show where the imbalance took place.
Please note that this is purely an indicator that should be used with other confluence before making trading decisions.