TICK Extremes IndicatorSimple TICK indicator, plots candles and HL2 line
Conditional green/red coloring for highs above 500, 900 and lows above 0, and for lows below -500, -900, and highs above 0
Probably best used for 1 - 5 min timeframes
Always open to suggestions if criteria needs tweaking or if something else would make it more useful or user-friendly!
在脚本中搜索"美股标普500"

Market direction and pullback based on S&P 500.A simple indicator based on www.swing-trade-stocks.com The link is also the guide for how to use it.
0 - nothing. If the indicator is showing 0 for a prolonged amount of time, it is likely the market is in "momentum mode" (referred to in the link above).
1 - indicates an uptrend based on SMA and EMA and also a place where a reversal to the upside is likely to occur. You should look only for long trades in the stock market when you see a spike upwards and S&P 500 is showing an obvious uptrend.
-1 - indicates a downtrend based on SMA and EMA and also a place where a reversal to the downside is likely to occur. You should look only for short trades in the stock market when you see a spike upwards and S&P 500 is showing an obvious uptrend.

Net XRP Margin PositionTotal XRP Longs minus XRP Shorts in order to give you the total outstanding XRP margin debt.
ie: If 500,000 XRP has been longed, and 400,000 XRP has been shorted, then 500,000 has been bought, and 400,000 sold, leaving us with 100,000 XRP (net) remaining to be sold to give us an overall neutral margin position.
That isn't to say that the net margin position must move towards zero, but it is a sensible reference point, and historical net values may provide useful insights into the current circumstances.

Net DASH Margin PositionTotal DASH Longs minus DASH Shorts in order to give you the total outstanding DASH margin debt.
ie: If 500,000 DASH has been longed, and 400,000 DASH has been shorted, then 500,000 has been bought, and 400,000 sold, leaving us with 100,000 DASH (net) remaining to be sold to give us an overall neutral margin position.
That isn't to say that the net margin position must move towards zero, but it is a sensible reference point, and historical net values may provide useful insights into the current circumstances.
(Anyone know what category this script should be in?)

Net NEO Margin PositionTotal NEO Longs minus NEO Shorts in order to give you the total outstanding NEO margin debt.
ie: If 500,000 NEO has been longed, and 400,000 NEO has been shorted, then 500,000 has been bought, and 400,000 sold, leaving us with 100,000 NEO (net) remaining to be sold to give us an overall neutral margin position.
That isn't to say that the net margin position must move towards zero, but it is a sensible reference point, and historical net values may provide useful insights into the current circumstances.
(Anyone know what category this script should be in?)

Everyday 0002 _ MAC 1st Trading Hour WalkoverThis is the second strategy for my Everyday project.
Like I wrote the last time - my goal is to create a new strategy everyday
for the rest of 2016 and post it here on TradingView.
I'm a complete beginner so this is my way of learning about coding strategies.
I'll give myself between 15 minutes and 2 hours to complete each creation.
This is basically a repetition of the first strategy I wrote - a Moving Average Crossover,
but I added a tiny thing.
I read that "Statistics have proven that the daily high or low is established within the first hour of trading on more than 70% of the time."
(source: )
My first Moving Average Crossover strategy, tested on VOLVB daily, got stoped out by the volatility
and because of this missed one nice bull run and a very nice bear run.
So I added this single line: if time("60", "1000-1600") regarding when to take exits:
if time("60", "1000-1600")
strategy.exit("Close Long", "Long", profit=2000, loss=500)
strategy.exit("Close Short", "Short", profit=2000, loss=500)
Sweden is UTC+2 so I guess UTC 1000 equals 12.00 in Stockholm. Not sure if this is correct, actually.
Anyway, I hope this means the strategy will only take exits based on price action which occur in the afternoon, when there is a higher probability of a lower volatility.
When I ran the new modified strategy on the same VOLVB daily it didn't get stoped out so easily.
On the other hand I'll have to test this on various stocks .
Reading and learning about how to properly test strategies is on my todo list - all tips on youtube videos or blogs
to read on this topic is very welcome!
Like I said the last time, I'm posting these strategies hoping to learn from the community - so any feedback, advice, or corrections is very much welcome and appreciated!
/pbergden

Auto Trend [theUltimator5]The Auto Trend indicator was designed to be a unique pattern detection indicator without the use of standard pivot point logic or high/low lines. It is a study in pattern detection by using iterative best-fit logic.
The indicator automatically identifies and draws trend channels by analyzing price action across configurable lookback periods. It finds optimal high and low trendlines that contain price movement, with a middle line marking the trend's center.
Key Features:
Automatic Pattern Detection - Intelligently searches for the best lookback period where price stays within the channel boundaries
Dual Pattern Modes - Choose between Short (20-66 bars) for quick patterns or Long (50-500 bars) for extended trends. Note - the long pattern is fully configurable and can be set anywhere up to 5000 bars.
Smart Caching - Optimized performance that only recalculates when necessary
Customizable Starting Point - Click directly on the chart to set where the trend channel begins
Flexible Lookback Range - Set minimum and maximum lookback periods to match your trading style
Visual Debugging - Optional label displays the active lookback period and violation count
How It Works:
The indicator divides the lookback period into thirds, finds the highest and lowest closes in the first and last thirds, then draws trendlines connecting these points. It can automatically search through different lookback periods to find the one with the fewest price violations (closes outside the channel).
Settings:
Use Auto Lookback - Enable automatic optimal lookback detection
Pattern Length - Short (faster, 1-bar increments) or Long (broader, 5-bar increments)
Min/Max Lookback - Define the search range for the Long pattern
Manual Lookback - Override auto-detection with a fixed period
Custom Colors - Personalize the high, low, and middle line colors
Starting Point - Select where the trend analysis begins
Use Cases:
Identify dominant trend channels across different timeframes
Spot potential support and resistance levels
Determine trend strength and consistency
Time entries and exits based on channel position
The indicator supports up to 5000 bars of historical data for comprehensive trend analysis.

RSI+Breadth Multi-Factor# RSI+ Breadth Multi-Factor Indicator
**Multi-factor scoring system for US market timing | 美股多因子择时评分系统**
[! (img.shields.io)](www.tradingview.com)
[! (img.shields.io)](www.tradingview.com)
[! (img.shields.io)](LICENSE)
---
## Overview | 概述
A quantitative indicator that combines **RSI**, **market breadth** (% above 20/50-day MA), and **up/down volume ratio** to generate actionable buy/sell signals for SPY, QQQ, and IWM.
这是一个结合 **RSI**、**市场广度**(站上20/50日均线比例)和 **涨跌成交量比** 的量化指标,为 SPY、QQQ 和 IWM 生成可操作的买卖信号。
---
## Features | 功能特点
| Feature | 功能 |
|---------|------|
| 🎯 Multi-factor scoring (-10 to +10) | 多因子评分系统 (-10 到 +10) |
| 📊 RSI + Breadth + Volume integration | RSI + 广度 + 成交量三重验证 |
| 🔀 Three markets: SPY, QQQ, IWM | 三大市场:SPY、QQQ、IWM |
| 🔥 Cross-market resonance detection | 跨市场共振信号检测 |
| 📈 Trend filter (MA-based) | 趋势过滤(均线判断) |
| ⏰ Auto-adapts to intraday timeframes | 自动适配日内时间周期 |
| 🎚️ Three modes: Aggressive/Standard/Conservative | 三种模式:激进/标准/保守 |
---
## Signal Reference | 信号说明
| Score | Emoji | Signal | 中文 | Action |
|:-----:|:-----:|--------|:----:|--------|
| ≥ 6 | 🚀 | **PANIC LOW** | 恐慌低点 | Strong buy 强烈买入 |
| ≥ 4 | 📈 | **BUY ZONE** | 低吸区 | Accumulate 分批建仓 |
| -3~3 | - | **HOLD** | 持有 | Hold position 持仓观望 |
| ≤ -4↑ | ⭐ | **ELEVATED** | 高估 | Hold cautious 持有但谨慎 |
| ≤ -4↓ | ⚡ | **CAUTION** | 观望 | Take profit 止盈 |
| ≤ -6↓ | ⚠️ | **REDUCE** | 减仓 | Reduce position 减少仓位 |
> **↑ = Uptrend** (price > MA) | **↓ = Downtrend** (price < MA)
### Resonance Signals | 共振信号
| Emoji | Signal | Description |
|:-----:|--------|-------------|
| 🔥 | Resonance Buy | Multiple markets in buy zone 多市场同时低吸 |
| ❄️ | Resonance Risk | Multiple markets in risk zone 多市场同时高估 |
---
## Scoring Logic | 评分逻辑
### Factors | 因子
| Factor | Weight | Buy Score | Sell Score |
|--------|--------|-----------|------------|
| **RSI** | 1x | RSI < 30 → +2, < 40 → +1 | RSI > 75 → -2, > 65 → -1 |
| **FI (50D MA%)** | Bottom focus | < 25% → +3, < 35% → +2 | > 85% → -2, > 78% → -1 |
| **TW (20D MA%)** | Top focus | < 30% → +1 | > 82% → -3, > 72% → -2 |
| **Volume Ratio** | 1x | UVOL/DVOL < 0.5 → +2 | > 2.5 → -2 |
### Breadth Symbols | 广度数据
| Market | TW Symbol | FI Symbol | Volume |
|--------|-----------|-----------|--------|
| SPY (S&P 500) | INDEX:S5TW | INDEX:S5FI | USI:UVOL/DVOL |
| QQQ (NASDAQ) | INDEX:NCTW | INDEX:NCFI | USI:UVOLQ/DVOLQ |
| IWM (Russell 2000) | INDEX:R2TW | INDEX:R2FI | USI:UVOL/DVOL |
---
## Settings | 设置说明
### Mode | 模式
- **Aggressive**: Lower thresholds, shorter cooldown (5 bars)
- **Standard**: Balanced defaults (10 bar cooldown)
- **Conservative**: Higher thresholds, longer cooldown (15 bars)
### Key Parameters | 关键参数
| Parameter | Default | Description |
|-----------|---------|-------------|
| RSI Length | 14 | RSI calculation period |
| Trend MA Length | 10 | MA for trend filter |
| Cooldown Bars | 10 | Min bars between same signals |
| Resonance Window | 3 | Bars to check for multi-market agreement |
| Min Markets | 2 | # of markets needed for resonance |
---
## Usage | 使用方法
### Installation | 安装
1. Copy the indicator code
2. In TradingView: **Pine Editor** → **New** → Paste code → **Add to Chart**
### Recommended Setup | 推荐设置
- **Timeframe**: Daily (D) for best accuracy | 推荐日线图
- **Markets**: Apply on SPY, QQQ, or IWM | 应用于SPY/QQQ/IWM
- **Mode**: Start with "Standard" | 建议从"标准"模式开始
### Intraday Mode | 日内模式
The indicator automatically detects intraday timeframes and adjusts:
- Uses only RSI + Volume factors (TW/FI are daily-only data)
- Lowers signal thresholds accordingly
指标会自动检测日内周期并调整:
- 仅使用 RSI + 成交量因子(TW/FI 仅有日线数据)
- 相应降低信号触发阈值
---
## Dashboard | 仪表盘
Displays real-time factor breakdown:
```
┌────────┬───────┬────────┐
│ Factor │ Score │ Weight │
├────────┼───────┼────────┤
│ RSI │ 1.0 │ 1x │
│ FI(50D)│ 2.0 │ Bottom │
│ TW(20D)│ -1.0 │ Top │
│ Vol │ 1.0 │ 1x │
│ Trend │ ↑ │ 10MA │
├────────┼───────┼────────┤
│ Total │ 3.0 │ HOLD │
└────────┴───────┴────────┘
```
---
## Alerts | 警报
Available alerts for each market (SPY/QQQ/IWM):
- Panic Low / Buy Zone (entry signals)
- Reduce / Caution (exit signals)
- Resonance Buy / Risk (cross-market confirmation)
每个市场(SPY/QQQ/IWM)可设置以下警报:
- 恐慌低点 / 低吸区(入场信号)
- 减仓 / 观望(出场信号)
- 共振买入 / 风险(跨市场确认)
---
## Trend Filter | 趋势过滤
**Key feature**: Risk signals (CAUTION/REDUCE) only trigger when **price is below the trend MA**.
When price is above MA (uptrend), the indicator shows **ELEVATED** ⭐ instead, preventing premature exits during strong rallies.
**核心功能**:风险信号(观望/减仓)仅在 **价格跌破趋势均线** 时触发。
当价格在均线之上(上升趋势)时,指标显示 **高估** ⭐,避免在强势上涨中过早离场。
---
## Disclaimer | 免责声明
This indicator is for **educational and informational purposes only**. It is not financial advice. Past performance does not guarantee future results. Always do your own research and consider your risk tolerance before trading.
本指标仅供 **教育和参考用途**,不构成投资建议。历史表现不代表未来收益。交易前请自行研究并考虑风险承受能力。
---
## License | 许可
MIT License - Free to use and modify with attribution.
MIT 许可证 - 可自由使用和修改,请注明出处。
---
## Author | 作者
Built with ❤️ for the trading community.
为交易社区精心打造 ❤️

Trading Dashboard + Daily SMAsThis indicator is an all-in-one workspace overlay designed for futures and intraday traders. It consolidates critical market internals, session statistics, and daily technical levels into a single, highly customizable dashboard.
The goal of this script is to reduce chart clutter by placing essential data into a clean table while overlaying key Daily Moving Averages onto your intraday timeframe.
Key Features:
1. Comprehensive Market Internals Dashboard Monitor the health of the broad market directly from your chart. The dashboard includes real-time data for:
VIX: Volatility Index.
TICK & TRIN: Sentiment and volume flow indicators.
Breadth Data: ADD, ADV, and DECL (Advance/Decline lines and volume).
Multi-Ticker Watch: Monitor 3 additional assets (Defaults: NQ, RTY, YM) with real-time price and % change.
2. Session Statistics & Probabilities Automated calculation of intraday statistics based on a user-defined lookback period (default 100 days):
RTH Data: Tracks Regular Trading Hours Open, Close, and Range.
Contextual ATR: Compares current RTH range to the 14-day ATR.
Probabilities: Displays historical probabilities for "Gap Fill," "Break of Yesterday's High," and "Break of Yesterday's Low."
3. Daily SMAs on Intraday Charts Plot key Daily Simple Moving Averages (21, 50, 200) directly on your lower timeframe charts (1m, 5m, etc.) without switching views.
Fully Customizable: Toggle each SMA on/off individually.
Color Control: Users can change the color of every SMA line to fit their theme.
4. "Dark Mode" Optimized The dashboard features a specific "Very Dark Grey" (#121212) background by default, designed to reduce eye strain and blend seamlessly with dark-themed trading setups.
Settings & Customization:
Session Times: Define your specific RTH start and end times.
Symbols: All ticker symbols (VIX, ADD, NQ, etc.) can be customized in the settings menu to match your data provider.
Visibility: Every element in the table and every SMA line has a toggle switch. You only see what you need.
Visuals: Change table position, text size, and line colors.
Author's Instructions: Configuration Guide
This script relies on specific ticker symbols to pull data for Market Internals (TICK, TRIN, ADD) and the Watchlist. Depending on your data subscription plan (CME, CBOE, etc.), you may need to adjust the default symbols to match what you have access to.
1. How to Change Symbols
Add the indicator to your chart.
Hover over the indicator name in the top-left corner and click the Settings (Gear Icon).
Scroll to the "Symbols" section.
Click inside the text box for the symbol you want to change.
2. Common Symbol Formats If the default symbols show "N/A" or "Error," try these alternatives based on your data feed:
TICK (NYSE Tick)
Default: USI:TICK (Requires specific data)
Alternative: TVC:TICK (General TradingView feed)
Alternative: TICK (Generic)
TRIN (Arms Index)
Default: USI:TRIN
Alternative: TVC:TRIN
Alternative: TRIN
Breadth (ADD/ADV/DECL)
ADD (Advance-Decline Line): Try USI:ADD, TVC:ADD, or ADD
ADV (Advancing Volume): Try USI:ADV, TVC:ADV, or UVOL (Up Volume)
DECL (Declining Volume): Try USI:DECL, TVC:DECL, or DVOL (Down Volume)
VIX
Standard: CBOE:VIX or TVC:VIX
3. Setting Up the Ticker Watchlist (Ticker 1, 2, 3) The script defaults to "Continuous Contracts" (indicated by the 1!), which automatically rolls to the front month.
Nasdaq: CME_MINI:NQ1!
S&P 500: CME_MINI:ES1!
Russell 2000: CME_MINI:RTY1!
Dow Jones: CBOT_MINI:YM1!
Note: If you want to watch a specific contract month (e.g., December 2025), enter the specific code like NQZ2025.
4. Troubleshooting "N/A" Data If a cell in the table is empty or says "N/A":
Verify you are not viewing the chart on a timeframe that excludes the data (though dynamic_requests=true usually handles this).
Ensure you have the correct data permission for that specific symbol.
Market Closed: Some internal data points only populate during the active NYSE session (09:30 - 16:00 ET).
Disclaimer: This tool is for informational purposes only and does not constitute financial advice. Past probabilities do not guarantee future results.

Volatility High/Low Projection (PHOD / PLOD)AP Capital – Volatility + High/Low Projection
This indicator is designed to identify high-probability intraday turning points by combining daily range statistics, session behaviour, and volatility context into a single clean framework.
It is built for index, forex, and metals traders who want structure, not noise.
🔹 Core Features
1️⃣ Potential High of Day (PHOD) & Potential Low of Day (PLOD)
The indicator highlights likely intraday extremes based on:
Session timing (Asia, London, New York)
Current day volatility vs historical averages
Prior day expansion or compression behaviour
Each level is displayed with:
A clear label (PHOD / PLOD)
A forward-extending box acting as a live Point of Interest (POI)
Automatic invalidation when price breaks the zone
2️⃣ Volatility & Range Context (Info Panel)
A compact information panel in the top-right corner provides real-time context without cluttering the chart:
20-Day Average Range
% of the average range already used today
Range status (NORMAL / EXHAUSTED)
Average session ranges for:
Asia
London
New York
This allows traders to immediately assess whether price is:
Early in the day with room to trend
Statistically stretched and prone to reversal
Over-extended where breakout chasing is risky
3️⃣ Session-Aware Logic
The model respects how markets behave across the trading day:
Asia favours accumulation and potential lows
London provides expansion
New York often delivers distribution or exhaustion
This prevents random high/low marking and focuses only on structurally meaningful levels.
🧠 How to Use
Use PHOD / PLOD boxes as reaction zones, not blind entries
Combine with your own confirmation (structure break, momentum, volume, EMA reclaim, etc.)
Avoid chasing trades when the Range Status = EXHAUSTED
Particularly effective on 15m – 1h timeframes
⚠️ Important Notes
This indicator does not repaint
It is contextual, not a buy/sell signal generator
Best used as part of a complete trading plan
📈 Suitable Markets
XAUUSD (Gold)
Indices (NASDAQ, S&P 500, DAX)
Major FX pairs
📌 Disclaimer
This indicator is for educational and analytical purposes only.
It does not constitute financial advice. Trading involves risk.

ICT Premium/Discount Zones [Exponential-X]Premium/Discount Zones - Visual Market Structure Tool
Overview
This indicator helps traders visualize premium and discount price zones based on recent market structure. It automatically identifies swing highs and lows within a specified lookback period and divides the price range into three key areas: Premium Zone, Equilibrium, and Discount Zone.
What This Indicator Does
The script continuously monitors price action and calculates:
Highest High and Lowest Low within the lookback period
Equilibrium Level - the midpoint between the swing high and low
Premium Zone - the area from equilibrium to the swing high (typically viewed as relatively expensive price levels)
Discount Zone - the area from the swing low to equilibrium (typically viewed as relatively cheap price levels)
Core Calculation Method
The indicator uses pivot point logic to identify significant swing highs and lows based on the pivot strength parameter. It then calculates the highest high and lowest low over the specified lookback period. The equilibrium is computed as the arithmetic mean of these two extremes, creating a fair value reference point.
The zones are dynamically updated as new price data becomes available, ensuring the visualization remains relevant to current market conditions.
Key Features
Dynamic Zone Detection
Automatically adjusts zones based on recent price action
Uses customizable lookback period for flexibility across different timeframes
Employs pivot strength parameter to filter out minor price fluctuations
Visual Clarity
Color-coded zones for easy identification (red for premium, green for discount)
Optional equilibrium line display
Adjustable zone label placement
Customizable color schemes to match your charting preferences
Alert Capabilities
Alerts when price enters the premium zone
Alerts when price enters the discount zone
Alerts when price returns to equilibrium
Helps traders monitor key zone interactions without constant chart watching
Customization Options
Adjustable lookback period (5-500 bars)
Configurable pivot strength for swing detection (1-20 bars)
Control over box extension into the future
Toggle labels and equilibrium line on/off
Full color customization for all visual elements
How to Use This Indicator
Setup
Add the indicator to your chart
Adjust the lookback period to match your trading timeframe (shorter for intraday, longer for swing trading)
Set pivot strength to filter out noise (higher values for major swings, lower for more frequent updates)
Customize colors and labels to your preference
Interpretation
Premium Zone: Price trading here may indicate potential resistance or selling opportunities when aligned with other technical factors
Discount Zone: Price trading here may indicate potential support or buying opportunities when aligned with other technical factors
Equilibrium: Acts as a fair value reference point where price often consolidates or reacts
Trading Applications
This tool works well when combined with other forms of analysis such as:
Trend identification indicators
Volume analysis
Support and resistance levels
Price action patterns
Market structure analysis
Important Considerations
This indicator identifies zones based purely on historical price data
Premium and discount zones are relative to the recent lookback period
The effectiveness varies across different market conditions and timeframes
Should be used as part of a comprehensive trading strategy, not in isolation
Past price structure does not guarantee future price behavior
Technical Details
Calculation Method
Uses Pine Script's ta.pivothigh() and ta.pivotlow() functions for swing detection
Employs ta.highest() and ta.lowest() for range calculation
Updates dynamically with each new bar
Draws zones using box objects for clear visual representation
Performance Optimization
Efficiently manages box and line objects to minimize resource usage
Uses conditional plotting to reduce unnecessary calculations
Limited to essential visual elements for chart clarity
Timeframe Compatibility
This indicator works on all timeframes but the recommended settings vary:
1-5 minute charts: Lookback period 10-20, Pivot strength 3-5
15-60 minute charts: Lookback period 20-50, Pivot strength 5-10
Daily charts: Lookback period 50-100, Pivot strength 10-15
Weekly charts: Lookback period 20-50, Pivot strength 5-10
Adjust these values based on the volatility of your specific instrument.
Limitations and Considerations
What This Indicator Does NOT Do
Does not provide buy or sell signals on its own
Does not predict future price movements
Does not account for fundamental factors or market events
Does not guarantee profitability or accuracy
Market Condition Awareness
In strong trending markets, price may remain in premium or discount zones for extended periods
During ranging conditions, price typically oscillates between zones more predictably
High volatility can cause frequent zone recalculations
Low volatility may result in narrow zones with limited practical use
Risk Considerations
Premium and discount are relative concepts, not absolute values
What appears as a discount zone may continue lower in a downtrend
What appears as a premium zone may continue higher in an uptrend
Always use proper risk management and position sizing
Consider multiple timeframe analysis for context
Version Information
This indicator is written in Pine Script v6, ensuring compatibility with the latest TradingView features and optimal performance.
Final Notes
This tool is designed to enhance your market analysis by providing a clear visual representation of premium and discount price zones. It should be used as one component of a well-rounded trading approach that includes proper risk management, multiple forms of analysis, and realistic expectations about market behavior.
The concept of premium and discount zones is rooted in auction market theory and the idea that price oscillates around fair value. However, traders should understand that these zones are interpretive tools based on historical data and do not constitute trading advice or predictions about future price action.
Remember to backtest any strategy using this indicator on historical data before applying it to live trading, and always trade responsibly within your risk tolerance.
Disclaimer: The information provided by this indicator is for educational and informational purposes only. It does not constitute financial advice, investment advice, trading advice, or any other sort of advice. Always conduct your own research and consult with qualified financial professionals before making trading decisions.

Renkli EMA BAR//@version=5
indicator("EMA Color Cross + Trend Arrows V6", overlay=true, max_bars_back=500)
// === Inputs ===
fastLen = input.int(9, "Hızlı EMA")
slowLen = input.int(21, "Yavaş EMA")
// === EMA Hesapları ===
emaFast = ta.ema(close, fastLen)
emaSlow = ta.ema(close, slowLen)
// Trend Yönü
trendUp = emaFast > emaSlow
trendDown = emaFast < emaSlow
// === Çizgi Renkleri ===
lineColor = trendUp ? color.new(color.green, 0) : color.new(color.red, 0)
// === EMA Çizgileri (agresif kalın) ===
plot(emaFast, "Hızlı EMA", lineColor, 4)
plot(emaSlow, "Yavaş EMA", color.new(color.gray, 70), 2)
// === Ok Sinyalleri ===
buySignal = ta.crossover(emaFast, emaSlow)
sellSignal = ta.crossunder(emaFast, emaSlow)
// Büyük Oklar
plotshape(buySignal, title="AL", style=shape.triangleup, color=color.green, size=size.large, location=location.belowbar)
plotshape(sellSignal, title="SAT", style=shape.triangledown, color=color.red, size=size.large, location=location.abovebar)
// === Trend Bar Color ===
barcolor(trendUp ? color.green : color.red)

EMA Cross Color Buy/Sell//@version=5
indicator("EMA Color Cross + Trend Arrows V6", overlay=true, max_bars_back=500)
// === Inputs ===
fastLen = input.int(9, "Hızlı EMA")
slowLen = input.int(21, "Yavaş EMA")
// === EMA Hesapları ===
emaFast = ta.ema(close, fastLen)
emaSlow = ta.ema(close, slowLen)
// Trend Yönü
trendUp = emaFast > emaSlow
trendDown = emaFast < emaSlow
// === Çizgi Renkleri ===
lineColor = trendUp ? color.new(color.green, 0) : color.new(color.red, 0)
// === EMA Çizgileri (agresif kalın) ===
plot(emaFast, "Hızlı EMA", lineColor, 4)
plot(emaSlow, "Yavaş EMA", color.new(color.gray, 70), 2)
// === Ok Sinyalleri ===
buySignal = ta.crossover(emaFast, emaSlow)
sellSignal = ta.crossunder(emaFast, emaSlow)
// Büyük Oklar
plotshape(buySignal, title="AL", style=shape.triangleup, color=color.green, size=size.large, location=location.belowbar)
plotshape(sellSignal, title="SAT", style=shape.triangledown, color=color.red, size=size.large, location=location.abovebar)
// === Trend Bar Color ===
barcolor(trendUp ? color.green : color.red)

EMA Color Cross + Trend Arrows V6//@version=5
indicator("EMA Color Cross + Trend Arrows V6", overlay=true, max_bars_back=500)
// === Inputs ===
fastLen = input.int(9, "Hızlı EMA")
slowLen = input.int(21, "Yavaş EMA")
// === EMA Hesapları ===
emaFast = ta.ema(close, fastLen)
emaSlow = ta.ema(close, slowLen)
// Trend Yönü
trendUp = emaFast > emaSlow
trendDown = emaFast < emaSlow
// === Çizgi Renkleri ===
lineColor = trendUp ? color.new(color.green, 0) : color.new(color.red, 0)
// === EMA Çizgileri (agresif kalın) ===
plot(emaFast, "Hızlı EMA", lineColor, 4)
plot(emaSlow, "Yavaş EMA", color.new(color.gray, 70), 2)
// === Ok Sinyalleri ===
buySignal = ta.crossover(emaFast, emaSlow)
sellSignal = ta.crossunder(emaFast, emaSlow)
// Büyük Oklar
plotshape(buySignal, title="AL", style=shape.triangleup, color=color.green, size=size.large, location=location.belowbar)
plotshape(sellSignal, title="SAT", style=shape.triangledown, color=color.red, size=size.large, location=location.abovebar)
// === Trend Bar Color ===
barcolor(trendUp ? color.green : color.red)

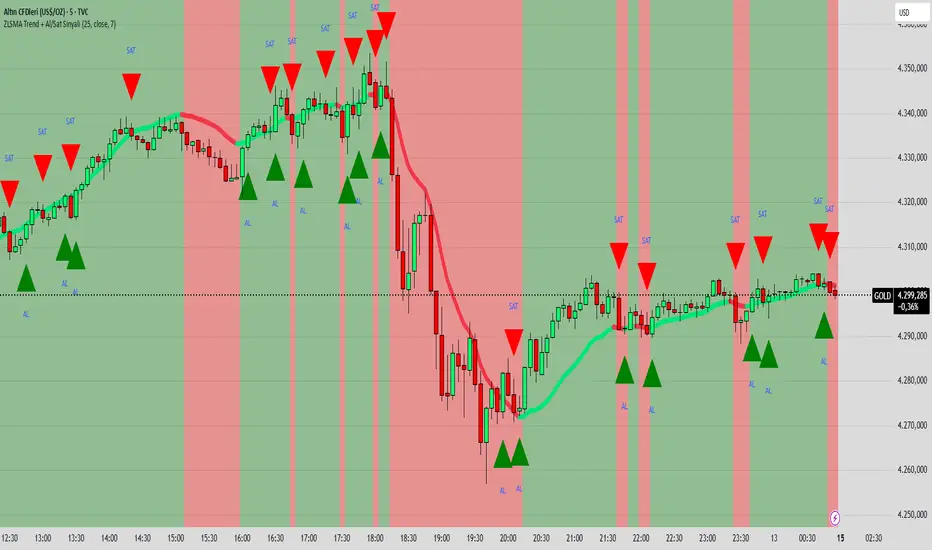
ZLSMA Trend + Al/Sat Sinyali/@version=6
indicator("ZLSMA Trend + Al/Sat Sinyali", overlay=true, max_labels_count=500)
length = input.int(25, "ZLSMA Periyodu")
src = input.source(close, "Kaynak")
thickness = input.int(4, "Çizgi Kalınlığı")
colorUp = input.color(color.new(color.lime, 0), "Yükselen Renk")
colorDown = input.color(color.new(color.red, 0), "Düşen Renk")
ema1 = ta.ema(src, length)
ema2 = ta.ema(ema1, length)
zlsma = 2 * ema1 - ema2
trendUp = zlsma > zlsma
trendDown = zlsma < zlsma
zlsmaColor = trendUp ? colorUp : colorDown
plot(zlsma, title="ZLSMA", color=zlsmaColor, linewidth=thickness)
buySignal = ta.crossover(close, zlsma)
sellSignal = ta.crossunder(close, zlsma)
plotshape(buySignal, title="Al", location=location.belowbar, color=color.new(color.lime, 0), style=shape.triangleup, size=size.large, text="AL")
plotshape(sellSignal, title="Sat", location=location.abovebar, color=color.new(color.red, 0), style=shape.triangledown, size=size.large, text="SAT")
bgcolor(trendUp ? color.new(color.lime, 90) : color.new(color.red, 90))
CRUX-3 Macro Regime Index"CRUX-3 Macro Regime Index"
Description:
CRUX-3 Macro Regime Index is a higher-timeframe macro indicator designed to evaluate how crypto markets are performing relative to traditional equities. It compares Bitcoin, Ethereum, and the broader altcoin market (TOTAL3) against the S&P 500 using Z-score normalization to highlight periods of relative outperformance or underperformance.
The indicator incorporates liquidity-based regime detection using Bitcoin dominance and stablecoin dominance to classify market environments as Risk-On, BTC-Led, or Risk-Off. Background shading visually highlights these regimes, helping users identify broader macro conditions rather than short-term trade signals.
CRUX-3 is intended for macro context, regime awareness, and allocation bias decisions, not for precise trade entries or timing.
How to Use:
Weekly timeframe recommended for best results
Rising Z-scores indicate crypto outperforming equities
ETH/SPX typically acts as an early rotation signal
TOTAL3/SPX confirms broader altcoin participation
Regime shading reflects liquidity conditions, not price forecasts
Regime Definitions:
Risk-On: BTC dominance and stablecoin dominance declining
BTC-Led: BTC dominance strong while stablecoin dominance eases
Risk-Off: BTC dominance and stablecoin dominance rising
Notes:
Forward regime bands are statistical reference guides based on historical behavior
This indicator does not predict future prices or market direction
Best used alongside price charts and other macro tools
Disclaimer:
This indicator is for educational and informational purposes only. It does not constitute financial advice, investment advice, or trading recommendations.
Recommended Settings:
Timeframe: Weekly (1W)
Z-Score Lookback: 52
Forward Regime Bands: Enabled

Trendlines & SR ZonesIt's a comprehensive indicator (Pine Script v6) that represents two powerful technical analysis tools: automatic trendline detection based on pivot points and volume delta analysis with support/resistance zone identification. This overlay indicator helps traders identify potential trend directions and key price levels where significant buying or selling pressure has occurred.
Features: =
1. Price Trendlines
The indicator automatically identifies and draws trendlines based on pivot points, creating dynamic support and resistance levels.
Key Components:
Pivot Detection: Uses configurable left and right bars to identify significant pivot highs and lows
Trendline Filtering: Only draws downward-sloping resistance trendlines and upward-sloping support trendlines
Zone Creation: Creates filled zones around trendlines based on average price volatility
Automatic Management: Maintains only the 3 most recent significant trendlines to avoid chart clutter
Customization Options:
Left/Right Bars for Pivot: Adjust sensitivity of pivot detection (default: 10 bars each side)
Extension Length: Control how far trendlines extend past the second pivot (default: 50 bars)
Average Body Periods: Set the lookback period for volatility calculation (default: 100)
Tolerance Multiplier: Adjust the width of the trendline zones (default: 1.0)
Color Customization: Separate colors for high (resistance) and low (support) trendlines and their fills
2. Volume Delta % Bars
The indicator analyzes volume distribution across price levels to identify significant supply and demand zones.
Key Components:
Volume Profile Analysis: Divides the price range into rows and calculates volume delta at each level
Delta Visualization: Displays horizontal bars showing the percentage difference between buying and selling volume
Zone Identification: Automatically identifies the most significant supply and demand zones
Visual Integration: Connects volume delta bars with corresponding support/resistance zones on the price chart
Customization Options:
Lookback Period: Set the number of bars to analyze for volume (default: 200)
Price Rows: Control the granularity of the volume analysis (default: 50 rows)
Delta Sections: Adjust the number of horizontal delta bars displayed (default: 20)
Panel Appearance: Customize width, position, and direction of the delta panel
Zone Settings: Control the number of supply/demand zones and their extension (default: 3 zones)
How It Works-
Trendline Logic:
The script continuously scans for pivot highs and lows based on the specified left and right bars
When a pivot is detected, it creates a horizontal line at that price level
The script then looks for the previous pivot of the same type (high or low)
It connects these pivots with a trendline, extending it based on the user-specified setting
A parallel line is created to form a zone, with the distance based on average price volatility
The script filters out invalid trendlines (upward-sloping resistance and downward-sloping support). Only the 3 most recent trendlines are maintained to prevent chart clutter
Volume Delta Logic:
The script divides the price range over the lookback period into the specified number of rows
For each bar in the lookback period, it categorizes volume as bullish (close > open) or bearish (close < open). This volume is assigned to the appropriate price level based on the HLC3 price.
The price levels are grouped into sections, and the net delta (bullish - bearish volume) is calculated for each Horizontal bars are drawn to represent these delta percentages.
The most significant positive and negative deltas are identified and displayed as support and resistance zones. These zones are extended to the left on the price chart and connected to the delta panel with dotted lines.
Ideal Timeframes:
The indicator is versatile and can be used across multiple timeframes, but it performs optimally on specific timeframes depending on your trading style:
For Day Trading:
Optimal Timeframes: 15-minute to 1-hour charts
Why: These timeframes provide a good balance between noise reduction and sufficient volume data. The volume delta analysis is particularly effective on these timeframes as it captures intraday accumulation/distribution patterns while the trendlines remain reliable enough for intraday trading decisions.
For Swing Trading:
Optimal Timeframes: 1-hour to 4-hour charts
Why: These timeframes offer the best combination of reliable trendline formation and meaningful volume analysis. The trendlines on these timeframes are less prone to whipsaws, while the volume delta analysis captures multi-day trading sessions and institutional activity.
For Position Trading:
Optimal Timeframes: Daily and weekly charts
Why: On these higher timeframes, trendlines become extremely reliable as they represent significant market structure points. The volume delta analysis reveals longer-term accumulation and distribution patterns that can define major support and resistance zones for weeks or months.
Timeframe-Specific Adjustments:
Lower Timeframes (1-15 minutes):
Reduce left/right bars for pivots (5-8 bars)
Decrease lookback period for volume delta (50-100 bars)
Increase tolerance multiplier (1.2-1.5) to account for higher volatility
Higher Timeframes (Daily+):
Increase left/right bars for pivots (15-20 bars)
Extend lookback period for volume delta (300-500 bars)
Consider increasing the number of price rows (70-100) for more detailed volume analysis
Usage Guidelines-
For Trendline Analysis:
Use the trendlines as dynamic support and resistance levels
Price reactions at these levels can indicate potential trend continuation or reversal points
The filled zones around trendlines represent areas of price volatility or uncertainty
Consider the slope of the trendline as an indication of trend strength
For Volume Delta Analysis:
The horizontal delta bars show where buying or selling pressure has been concentrated
Green bars indicate areas where buying volume exceeded selling volume (demand)
Red bars indicate areas where selling volume exceeded buying volume (supply)
The highlighted supply and demand zones on the price chart represent significant price levels
These zones can act as future support or resistance areas as price revisits them
Customization Tips:
Trendline Sensitivity: Decrease left/right bars values to detect more pivots (more sensitive) or increase them for fewer, more significant pivots
Zone Width: Adjust the tolerance multiplier to make trendline zones wider or narrower based on your trading style
Volume Analysis: Increase the lookback period for a longer-term volume profile or decrease it for more recent activity
Visual Clarity: Adjust colors and transparency settings to match your chart theme and preferences
Conclusion:
This indicator provides traders with a comprehensive view of both trend dynamics and volume-based support/resistance levels. With these two analytical approaches, the indicator offers valuable insights for identifying potential entry and exit points, trend strength, and key price levels where significant market activity has occurred. The extensive customization options allow traders to adapt the indicator to various trading styles and timeframes, with optimal performance on 15-minute to daily charts depending on their trading horizon.
Chart Attached: NSE HINDZINC, EoD 12/12/25
DISCLAIMER: This information is provided for educational purposes only and should not be considered financial, investment, or trading advice. Please do boost if you like it. Happy Trading.

11-MA Institutional System (ATR+HTF Filters)11-MA Institutional Trading System Analysis.
This is a comprehensive Trading View Pine Script indicator that implements a sophisticated multi-timeframe moving average system with institutional-grade filters. Let me break down its key components and functionality:
🎯 Core Features
1. 11 Moving Average System. The indicator plots 11 customizable moving averages with different roles:
MA1-MA4 (5, 8, 10, 12): Fast-moving averages for short-term trends
MA5 (21 EMA): Short-term anchor - critical pivot point
MA6 (34 EMA): Intermediate support/resistance
MA7 (50 EMA): Medium-term bridge between short and long trends
MA8-MA9 (89, 100): Transition zone indicators
MA10-MA11 (150, 200): Long-term anchors for major trend identification
Each MA is fully customizable:
Type: SMA, EMA, WMA, TMA, RMA
Color, width, and enable/disable toggle
📊 Signal Generation System
Three Signal Tiers: Short-Term Signals (ST)
Trigger: MA8 (EMA 8) crossing MA21 (EMA 21)
Filters Applied:
✅ ATR-based post-cross confirmation (optional)
✅ Momentum confirmation (RSI > 50, MACD positive)
✅ Volume spike requirement
✅ HTF (Higher Timeframe) alignment
✅ Strong candle body ratio (>50%)
✅ Multi-MA confirmation (3+ MAs supporting direction)
✅ Price beyond MA21 with conviction
✅ Minimum bar spacing (prevents signal clustering)
✅ Consolidation filter
✅ Whipsaw protection (ATR-based price threshold)
Medium-Term Signals (MT)
Trigger: MA21 crossing MA50
Less strict filtering for swing trades
Major Signals
Golden Cross: MA50 crossing above MA200 (major bullish)
Death Cross: MA50 crossing below MA200 (major bearish)
🔍 Advanced Filtering System1. ATR-Based ConfirmationPrice must move > (ATR × 0.25) beyond the MA after crossover
This prevents false signals during low-volatility consolidation.2. Momentum Filters
RSI (14)
MACD Histogram
Rate of Change (ROC)
Composite momentum score (-3 to +3)
3. Volume Analysis
Volume spike detection (2x MA)
Volume classification: LOW, MED, HIGH, EXPL
Directional volume confirmation
4. Higher Timeframe Alignment
HTF1: 60-minute (default)
HTF2: 4-hour (optional)
HTF3: Daily (optional)
Signals only trigger when current TF aligns with HTF trend
5. Market Structure Detection
Break of Structure (BOS): Price breaking recent swing highs/lows
Order Blocks (OB): Institutional demand/supply zones
Fair Value Gaps (FVG): Imbalance areas for potential fills
📈 Comprehensive DashboardReal-Time Metrics Display: {scrollbar-width:none;-ms-overflow-style:none;-webkit-overflow-scrolling:touch;} ::-webkit-scrollbar{display:none}MetricDescriptionPriceCurrent close priceTimeframeCurrent chart timeframeSHORT/MEDIUM/MAJORTrend classification (🟢BULL/🔴BEAR/⚪NEUT)HTF TrendsHigher timeframe alignment indicatorsMomentumSTR↑/MOD↑/WK↑/WK↓/MOD↓/STR↓VolatilityLOW/MOD/HIGH/EXTR (based on ATR%)RSI(14)Color-coded: >70 red, <30 greenATR%Volatility as % of priceAdvanced Dashboard Features (Optional):
Price Distance from Key MAs
vs MA21, MA50, MA200 (percentage)
Color-coded: green (above), red (below)
MA Alignment Score
Calculates % of MAs in proper order
🟢 for bullish alignment, 🔴 for bearish
Trend Strength
Based on separation between MA21 and MA200
NONE/WEAK/MODERATE/STRONG/EXTREME
Consolidation Detection
Identifies low-volatility ranges
Prevents signals during sideways markets
⚙️ Customization OptionsFilter Toggles:
☑️ Require Momentum
☑️ Require Volume
☑️ Require HTF Alignment
☑️ Use ATR post-cross confirmation
☑️ Whipsaw filter
Min bars between signals (default: 5)
Dashboard Styling:
9 position options
6 text sizes
Custom colors for header, rows, and text
Toggle individual metrics on/off
🎨 Visual Elements
Signal Labels:
ST▲/ST▼ (green/red) - Short-term
MT▲/MT▼ (blue/orange) - Medium-term
GOLDEN CROSS / DEATH CROSS - Major signals
Volume Spikes:
Small labels showing volume class + direction
Example: "HIGH🟢" or "EXPL🔴"
Market Structure:
Dashed lines for Break of Structure levels
Automatic detection of swing highs/lows
🔔 Alert Conditions
Pre-configured alerts for:
Short-term bullish/bearish crosses
Medium-term bullish/bearish crosses
Golden Cross / Death Cross
Volume spikes
💡 Key Strengths
Institutional-Grade Filtering: Multiple confirmation layers reduce false signals
Multi-Timeframe Analysis: Ensures alignment across timeframes
Adaptive to Market Conditions: ATR-based thresholds adjust to volatility
Comprehensive Dashboard: All critical metrics in one view
Highly Customizable: 100+ input parameters
Signal Quality Over Quantity: Strict filters prioritize high-probability setups
⚠️ Usage Recommendations
Best for: Swing trading and position trading
Timeframes: Works on all TFs, optimized for 15m-Daily
Markets: Stocks, Forex, Crypto, Indices
Signal Frequency: Conservative (quality over quantity)
Combine with: Support/resistance, price action, risk management
🔧 Technical Implementation Notes
Uses Pine Script v6 syntax
Efficient calculation with minimal repainting
Maximum 500 labels for performance
Security function for HTF data (no lookahead bias)
Array-based MA alignment calculation
State variables to track signal spacing
This is a professional-grade trading system that combines classical technical analysis (moving averages) with modern institutional concepts (market structure, order blocks, multi-timeframe alignment).
The extensive filtering system is designed to eliminate noise and focus on high-probability trade setups.

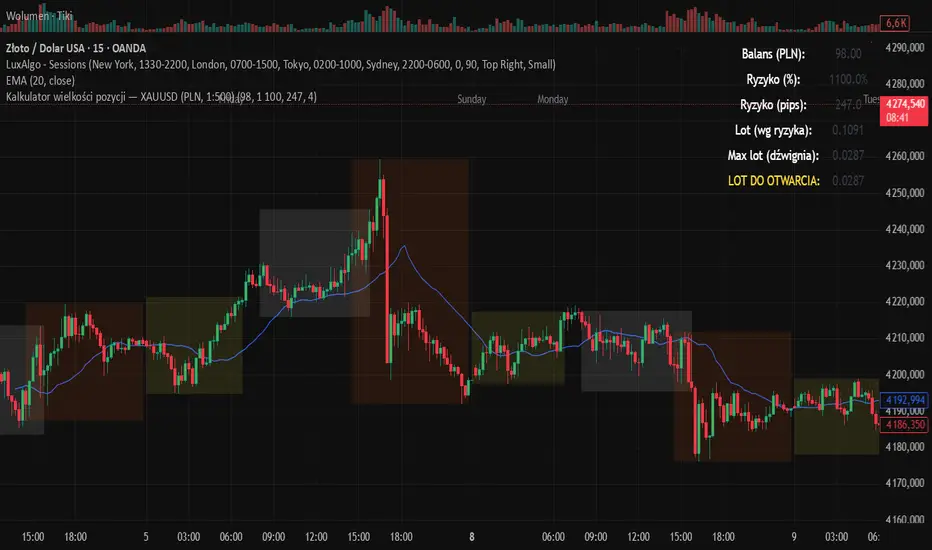
Kalkulator pozycji XAUUSD PLN, 1:500, 1100 to 100 kontaPosition calculator based on the number of pips that you quickly enter from the tool, this device will select the appropriate lot for you and you can quickly take a position
ALT Risk Metric StrategyHere's a professional write-up for your ALT Risk Strategy script:
ALT/BTC Risk Strategy - Multi-Crypto DCA with Bitcoin Correlation Analysis
Overview
This strategy uses Bitcoin correlation as a risk indicator to time entries and exits for altcoins. By analyzing how your chosen altcoin performs relative to Bitcoin, the strategy identifies optimal accumulation periods (when alt/BTC is oversold) and profit-taking opportunities (when alt/BTC is overbought). Perfect for traders who want to outperform Bitcoin by strategically timing altcoin positions.
Key Innovation: Why Alt/BTC Matters
Most traders focus solely on USD price, but Alt/BTC ratios reveal true altcoin strength:
When Alt/BTC is low → Altcoin is undervalued relative to Bitcoin (buy opportunity)
When Alt/BTC is high → Altcoin has outperformed Bitcoin (take profits)
This approach captures the rotation between BTC and alts that drives crypto cycles
Key Features
📊 Advanced Technical Analysis
RSI (60% weight): Primary momentum indicator on weekly timeframe
Long-term MA Deviation (35% weight): Measures distance from 150-period baseline
MACD (5% weight): Minor confirmation signal
EMA Smoothing: Filters noise while maintaining responsiveness
All calculations performed on Alt/BTC pairs for superior market timing
💰 3-Tier DCA System
Level 1 (Risk ≤ 70): Conservative entry, base allocation
Level 2 (Risk ≤ 50): Increased allocation, strong opportunity
Level 3 (Risk ≤ 30): Maximum allocation, extreme undervaluation
Continuous buying: Executes every bar while below threshold for true DCA behavior
Cumulative sizing: L3 triggers = L1 + L2 + L3 amounts combined
📈 Smart Profit Management
Sequential selling: Must complete L1 before L2, L2 before L3
Percentage-based exits: Sell portions of position, not fixed amounts
Auto-reset on re-entry: New buy signals reset sell progression
Prevents premature full exits during volatile conditions
🤖 3Commas Automation
Pre-configured JSON webhooks for Custom Signal Bots
Multi-exchange support: Binance, Coinbase, Kraken, Bitfinex, Bybit
Flexible quote currency: USD, USDT, or BUSD
Dynamic order sizing: Automatically adjusts to your tier thresholds
Full webhook documentation compliance
🎨 Multi-Asset Support
Pre-configured for popular altcoins:
ETH (Ethereum)
SOL (Solana)
ADA (Cardano)
LINK (Chainlink)
UNI (Uniswap)
XRP (Ripple)
DOGE
RENDER
Custom option for any other crypto
How It Works
Risk Metric Calculation (0-100 scale):
Fetches weekly Alt/BTC price data for stability
Calculates RSI, MACD, and deviation from 150-period MA
Normalizes MACD to 0-100 range using 500-bar lookback
Combines weighted components: (MACD × 0.05) + (RSI × 0.60) + (Deviation × 0.35)
Applies 5-period EMA smoothing for cleaner signals
Color-Coded Risk Zones:
Green (0-30): Extreme buying opportunity - Alt heavily oversold vs BTC
Lime/Yellow (30-70): Accumulation range - favorable risk/reward
Orange (70-85): Caution zone - consider taking initial profits
Red/Maroon (85-100+): Euphoria zone - aggressive profit-taking
Entry Logic:
Buys execute every candle when risk is below threshold
As risk decreases, position sizing automatically scales up
Example: If risk drops from 60→25, you'll be buying at L1 rate until it hits 50, then L2 rate, then L3 rate
Exit Logic:
Sells only trigger when in profit AND risk exceeds thresholds
Sequential execution ensures partial profit-taking
If new buy signal occurs before all sells complete, sell levels reset to L1
Configuration Guide
Choosing Your Altcoin:
Select crypto from dropdown (or use CUSTOM for unlisted coins)
Pick your exchange
Choose quote currency (USD, USDT, BUSD)
Risk Metric Tuning:
Long Term MA (default 150): Higher = more extreme signals, Lower = more frequent
RSI Length (default 10): Lower = more volatile, Higher = smoother
Smoothing (default 5): Increase for less noise, decrease for faster reaction
Buy Settings (Aggressive DCA Example):
L1 Threshold: 70 | Amount: $5
L2 Threshold: 50 | Amount: $6
L3 Threshold: 30 | Amount: $7
Total L3 buy = $18 per candle when deeply oversold
Sell Settings (Balanced Exit Example):
L1: 70 threshold, 25% position
L2: 85 threshold, 35% position
L3: 100 threshold, 40% position (final exit)
3Commas Setup
Bot Configuration:
Create Custom Signal Bot in 3Commas
Set trading pair to your altcoin/USD (e.g., ETH/USD, SOL/USDT)
Order size: Select "Send in webhook, quote" to use strategy's dollar amounts
Copy Bot UUID and Secret Token
Script Configuration:
Paste credentials into 3Commas section inputs
Check "Enable 3Commas Alerts"
Save and apply to chart
TradingView Alert:
Create Alert → Condition: "alert() function calls only"
Webhook URL: api.3commas.io
Enable "Webhook URL" checkbox
Expiration: Open-ended
Strategy Advantages
✅ Outperform Bitcoin: Designed specifically to beat BTC by timing alt rotations
✅ Capture Alt Seasons: Automatically accumulates when alts lag, sells when they pump
✅ Risk-Adjusted Sizing: Buys more when cheaper (better risk/reward)
✅ Emotional Discipline: Systematic approach removes fear and FOMO
✅ Multi-Asset: Run same strategy across multiple altcoins simultaneously
✅ Proven Indicators: Combines RSI, MACD, and MA deviation - battle-tested tools
Backtesting Insights
Optimal Timeframes:
Daily chart: Best for backtesting and signal generation
Weekly data is fetched internally regardless of display timeframe
Historical Performance Characteristics:
Accumulates heavily during bear markets and BTC dominance periods
Captures explosive altcoin rallies when BTC stagnates
Sequential selling preserves capital during extended downtrends
Works best on established altcoins with multi-year history
Risk Considerations:
Requires capital reserves for extended accumulation periods
Some altcoins may never recover if fundamentals deteriorate
Past correlation patterns may not predict future performance
Always size positions according to personal risk tolerance
Visual Interface
Indicator Panel Displays:
Dynamic color line: Green→Lime→Yellow→Orange→Red as risk increases
Horizontal threshold lines: Dashed lines mark your buy/sell levels
Entry/Exit labels: Green labels for buys, Orange/Red/Maroon for sells
Real-time risk value: Numerical display on price scale
Customization:
All threshold lines are adjustable via inputs
Color scheme clearly differentiates buy zones (green spectrum) from sell zones (red spectrum)
Line weights emphasize most extreme thresholds (L3 buy and L3 sell)
Strategy Philosophy
This strategy is built on the principle that altcoins move in cycles relative to Bitcoin. During Bitcoin rallies, alts often bleed against BTC (high sell, accumulate). When Bitcoin consolidates, alts pump (take profits). By measuring risk on the Alt/BTC chart instead of USD price, we time these rotations with precision.
The 3-tier system ensures you're always averaging in at better prices and scaling out at better prices, maximizing your Bitcoin-denominated returns.
Advanced Tips
Multi-Bot Strategy:
Run this on 5-10 different altcoins simultaneously to:
Diversify correlation risk
Capture whichever alt is pumping
Smooth equity curve through rotation
Pairing with BTC Strategy:
Use alongside the BTC DCA Risk Strategy for complete portfolio coverage:
BTC strategy for core holdings
ALT strategies for alpha generation
Rebalance between them based on BTC dominance
Threshold Calibration:
Check 2-3 years of historical data for your chosen alt
Note where risk metric sat during major bottoms (set buy thresholds)
Note where it peaked during euphoria (set sell thresholds)
Adjust for your risk tolerance and holding period
Credits
Strategy Development & 3Commas Integration: Claude AI (Anthropic)
Technical Analysis Framework: RSI, MACD, Moving Average theory
Implementation: pommesUNDwurst
Disclaimer
This strategy is for educational purposes only. Cryptocurrency trading involves substantial risk of loss. Altcoins are especially volatile and many fail completely. The strategy assumes liquid markets and reliable Alt/BTC price data. Always do your own research, understand the fundamentals of any asset you trade, and never risk more than you can afford to lose. Past performance does not guarantee future results. The authors are not financial advisors and assume no liability for trading decisions.
Additional Warning: Using leverage or trading illiquid altcoins amplifies risk significantly. This strategy is designed for spot trading of established cryptocurrencies with deep liquidity.
Tags: Altcoin, Alt/BTC, DCA, Risk Metric, Dollar Cost Averaging, 3Commas, ETH, SOL, Crypto Rotation, Bitcoin Correlation, Automated Trading, Alt Season
Feel free to modify any sections to better match your style or add specific backtesting results you've observed! 🚀Claude is AI and can make mistakes. Please double-check responses. Sonnet 4.5

Volume Profile VisionVolume Profile Vision - Complete Description
Overview
Volume Profile Vision (VPV) is an advanced volume profile indicator that visualizes where trading activity has occurred at different price levels over a specified time period. Unlike traditional volume indicators that show volume over time, this indicator displays volume distribution across price levels, helping traders identify key support/resistance zones, fair value areas, and potential reversal points.
What Makes This Indicator Original
Volume Profile Vision introduces several unique features not found in standard volume profile tools:
Dual-Direction Histogram Display:
Unlike conventional volume profiles that only show bars extending in one direction, VPV displays volume bars extending both left (into historical candles) and right (as a traditional histogram). This bi-directional approach allows traders to see exactly where historical price action intersected with high-volume nodes.
Real-Time Candle Highlighting: The indicator dynamically highlights volume bars that intersect with the current candle's price range, making it immediately obvious which volume levels are currently in play.
Four Professional Color Schemes: Each color scheme uses distinct gradient algorithms and visual encoding systems:
Traffic Light: Uses red (POC), green (VA boundaries), yellow (HVN), with grayscale gradients outside the value area
Aurora Glass: Modern cyan-to-magenta gradient with hot magenta POC highlighting
Obsidian Precision: Professional dark theme with white POC and electric cyan accents
Black Ice: Monochromatic cyan family with graduated intensity
Adaptive Transparency System: Automatically adjusts bar transparency based on position relative to value area, with special handling for each color scheme to maintain visual clarity.
Core Concepts & Calculations
Volume Distribution Analysis
The indicator divides the visible price range into user-defined price levels (default: 80 levels) and calculates the total volume traded at each level by:
Scanning back through the specified lookback period (customizable or visible range)
For each historical bar, determining which price levels the bar's high/low range intersects
Accumulating volume for each intersected price level
Optionally filtering by bullish/bearish volume only
Point of Control (POC)
The POC is the price level with the highest traded volume during the analyzed period. This represents the "fairest" price where most traders agreed on value. The indicator marks this with distinct coloring (red in Traffic Light, magenta in Aurora Glass, white in Obsidian Precision, cyan in Black Ice).
Trading Significance: POC acts as a strong magnet for price - markets tend to return to fair value. When price is away from POC, traders watch for:
Mean reversion opportunities when price is far from POC
Rejection signals when price tests POC from above/below
Breakout confirmation when price breaks through and holds beyond POC
Value Area (VA)
The Value Area encompasses the price range where a specified percentage (default: 68%) of all volume traded. This represents the range of "accepted value" by market participants.
Calculation Method:
Start at the POC (highest volume level)
Expand upward and downward, adding adjacent price levels
Always add the level with higher volume next
Continue until accumulated volume reaches the VA percentage threshold
Value Area High (VAH): Upper boundary of accepted value - acts as resistance
Value Area Low (VAL): Lower boundary of accepted value - acts as support
Trading Significance:
Price spending time inside VA indicates market equilibrium
Breakouts above VAH suggest bullish momentum shift
Breakdowns below VAL suggest bearish momentum shift
Returns to VA boundaries often provide high-probability entry zones
High Volume Nodes (HVN)
Price levels with volume exceeding a threshold percentage (default: 80%) of POC volume. These represent areas of strong agreement and consolidation.
Trading Significance:
HVNs act as strong support/resistance zones
Price tends to consolidate at HVNs before making directional moves
Breaking through an HVN often signals strong momentum
Low Volume Nodes (LVN)
Price levels within the Value Area with volume ≤30% of POC volume. These are zones price moved through quickly with minimal consolidation.
Trading Significance:
LVNs represent areas of rejection - price finds little acceptance
Price tends to move rapidly through LVN zones
Useful for setting stop-losses (below LVN for longs, above for shorts)
Can identify potential gaps or "air pockets" in the market structure
Grayscale POC Detection
A secondary POC detection system identifies the highest volume level outside the Value Area (with a 2-level buffer to avoid confusion). This helps identify significant volume accumulation zones that exist beyond the main value area.
How to Use This Indicator
Setup
Choose Lookback Period:
Enable "Use Visible Range" to analyze only what's on your chart
Or set "Fixed Range Lookback Depth" (default: 200 bars) for consistent analysis
Adjust Profile Resolution:
"Number of Price Levels" (default: 80) - higher = more granular analysis, lower = broader zones
Select Color Scheme:
Traffic Light: Best for clear POC/VA/HVN identification
Aurora Glass: Modern aesthetic for dark charts
Obsidian Precision: Professional trader preference
Black Ice: Minimalist single-color family
Visual Customization
Left Extension: How far back the left-side histogram extends into historical candles (default: 490 bars)
Right Extension: Width of the traditional histogram bars on the right (default: 50 bars)
Right Margin: Space between current price bar and histogram (default: 0 for flush alignment)
Left Profile Gap: Space between left-side histogram and candles (default: 0)
Trading Strategies
Strategy 1: Value Area Mean Reversion
Wait for price to move outside the Value Area (above VAH or below VAL)
Look for rejection signals (wicks, bearish/bullish candles)
Enter trades toward the POC
Take profits as price returns to POC or opposite VA boundary
Strategy 2: Breakout Confirmation
Identify when price is consolidating within the Value Area
Wait for a strong close above VAH (bullish) or below VAL (bearish)
Enter on the breakout or on first pullback to the VA boundary
Target previous HVNs or swing highs/lows outside the VA
Strategy 3: POC Support/Resistance
Watch for price approaching the POC level
If approaching from below, look for bullish reversal patterns at POC (support)
If approaching from above, look for bearish reversal patterns at POC (resistance)
Trade in the direction of the bounce with stops beyond the POC
Strategy 4: LVN Fast Movement Zones
Identify LVN zones within the Value Area (marked with "LVN" label)
When price enters an LVN, expect rapid movement through the zone
Avoid entering trades within LVNs
Use LVNs as confirmation of directional momentum
Alert System
The indicator includes 7 customizable alert conditions:
POC Touch: Alerts when price comes within 0.5 ATR of POC
VAH/VAL Touch: Alerts at Value Area boundaries
VA Breakout: Alerts on breakouts above VAH or below VAL
HVN Touch: Alerts when price contacts High Volume Nodes
LVN Entry: Alerts when entering Low Volume zones
POC Shift: Alerts when POC moves to a new price level
Reading the Profile
Price Labels (shown on the right side):
POC: Point of Control - highest volume price level
VAH: Value Area High - upper boundary of accepted value
VAL: Value Area Low - lower boundary of accepted value
LVN: Low Volume Node - expect fast movement through this zone
Color Intensity Interpretation:
Brighter colors = higher volume concentration
Dimmer colors = lower volume
Abrupt color changes = transition between volume zones
Gaps in the histogram = price levels with no trading activity
Technical Details
Volume Accumulation Logic:
For each bar in lookback period:
For each price level:
If bar's high/low range intersects price level:
Add bar's volume to that price level's total
Gradient Algorithm:
Traffic Light: Dual-range piecewise gradient (0-50% and 50-100% volume intensity)
Aurora Glass: Linear cyan-to-magenta interpolation
Obsidian Precision: Dark blue gradient with cyan highlights
Black Ice: Three-stage cyan intensity progression
Real-Time Updates:
The profile recalculates on every bar, including real-time tick data, ensuring the volume distribution always reflects current market structure.
Best Practices
Timeframe Selection: Use higher timeframes (4H, Daily) for swing trading, lower timeframes (5min, 15min) for day trading
Combine with Price Action: Volume profile shows WHERE, price action shows WHEN
Multiple Timeframe Analysis: Check daily VP for major levels, then drill down to intraday for entries
Volume Type Selection: Use "Bullish" volume in uptrends, "Bearish" in downtrends, or "Both" for complete picture
Adjust VA Percentage: 68% (default) captures one standard deviation; try 70% for tighter or 60% for broader value areas
Performance Notes
Maximum bars back: 5000 (handles deep historical analysis)
Maximum boxes: 500 (handles complex profiles)
Optimized calculation: Only recalculates on last bar for efficiency
Real-time capable: Updates as new ticks arrive

Swing Trading IndicatorThis script is a swing‑trading dashboard designed for BTC, ETH, S&P 500 (for now). It combines weekly RSI, USDT.D, VIX, moving averages and Fisher Transform into a single visual tool, with background highlights, an on‑chart info table and ready‑made alerts to help you time high‑probability swing entries and manage risk.
1. Overview
The indicator is intended to work on daily timeframe.
Signals are context‑aware: BTC and ETH get USDT.D conditions, SPX gets VIX and EMA‑100 logic, and all non‑ETH symbols can also use Fisher Transform as a mean‑reversion filter.
2. Conditions and background highlights
Each component sets a boolean condition and, when active, paints a background layer:
Weekly RSI condition
True when weekly RSI is below its symbol‑specific threshold.
USDT.D conditions
BTC: triggered when USDT.D is above the user threshold and the chart symbol is BTC.
ETH: same logic for ETH, but tracked separately..
VIX condition (SPX only)
True when VIX high is at or above the VIX threshold while the chart is SPX.
EMA condition (BTC & SPX)
BTC: daily close below EMA‑200.
SPX: daily close below EMA‑100.
Fisher Transform condition (non‑ETH)
Fisher Transform on the chart timeframe, using the configured period.
True when Fisher value is below the Fisher threshold.
3. Intended use and notes
This indicator is designed as a confluence tool for swing traders, not a standalone buy/sell system. It works best on assets that are in a clear uptrend, where the main idea is to accumulate during corrections within that broader bullish structure.
During larger market shocks, deep corrections, or black‑swan events, trend‑based and mean‑reversion filters can produce false signals, because volatility and correlations often behave abnormally in those periods. For that reason, this script should always be combined with independent risk management, higher‑timeframe trend analysis, and your own discretion.

SMC N-Gram Probability Matrix [PhenLabs]📊 SMC N-Gram Probability Matrix
Version: PineScript™ v6
📌 Description
The SMC N-Gram Probability Matrix applies computational linguistics methodology to Smart Money Concepts trading. By treating SMC patterns as a discrete “alphabet” and analyzing their sequential relationships through N-gram modeling, this indicator calculates the statistical probability of which pattern will appear next based on historical transitions.
Traditional SMC analysis is reactive—traders identify patterns after they form and then anticipate the next move. This indicator inverts that approach by building a transition probability matrix from up to 5,000 bars of pattern history, enabling traders to see which SMC formations most frequently follow their current market sequence.
The indicator detects and classifies 11 distinct SMC patterns including Fair Value Gaps, Order Blocks, Liquidity Sweeps, Break of Structure, and Change of Character in both bullish and bearish variants, then tracks how these patterns transition from one to another over time.
🚀 Points of Innovation
First indicator to apply N-gram sequence modeling from computational linguistics to SMC pattern analysis
Dynamic transition matrix rebuilds every 50 bars for adaptive probability calculations
Supports bigram (2), trigram (3), and quadgram (4) sequence lengths for varying analysis depth
Priority-based pattern classification ensures higher-significance patterns (CHoCH, BOS) take precedence
Configurable minimum occurrence threshold filters out statistically insignificant predictions
Real-time probability visualization with graphical confidence bars
🔧 Core Components
Pattern Alphabet System: 11 discrete SMC patterns encoded as integers for efficient matrix indexing and transition tracking
Swing Point Detection: Uses ta.pivothigh/pivotlow with configurable sensitivity for non-repainting structure identification
Transition Count Matrix: Flattened array storing occurrence counts for all possible pattern sequence transitions
Context Encoder: Converts N-gram pattern sequences into unique integer IDs for matrix lookup
Probability Calculator: Transforms raw transition counts into percentage probabilities for each possible next pattern
🔥 Key Features
Multi-Pattern SMC Detection: Simultaneously identifies FVGs, Order Blocks, Liquidity Sweeps, BOS, and CHoCH formations
Adjustable N-Gram Length: Choose between 2-4 pattern sequences to balance specificity against sample size
Flexible Lookback Range: Analyze anywhere from 100 to 5,000 historical bars for matrix construction
Pattern Toggle Controls: Enable or disable individual SMC pattern types to customize analysis focus
Probability Threshold Filtering: Set minimum occurrence requirements to ensure prediction reliability
Alert Integration: Built-in alert conditions trigger when high-probability predictions emerge
🎨 Visualization
Probability Table: Displays current pattern, recent sequence, sample count, and top N predicted patterns with percentage probabilities
Graphical Probability Bars: Visual bar representation (█░) showing relative probability strength at a glance
Chart Pattern Markers: Color-coded labels placed directly on price bars identifying detected SMC formations
Pattern Short Codes: Compact notation (F+, F-, O+, O-, L↑, L↓, B+, B-, C+, C-) for quick pattern identification
Customizable Table Position: Place probability display in any corner of your chart
📖 Usage Guidelines
N-Gram Configuration
N-Gram Length: Default 2, Range 2-4. Lower values provide more samples but less specificity. Higher values capture complex sequences but require more historical data.
Matrix Lookback Bars: Default 500, Range 100-5000. More bars increase statistical significance but may include outdated market behavior.
Min Occurrences for Prediction: Default 2, Range 1-10. Higher values filter noise but may reduce prediction availability.
SMC Detection Settings
Swing Detection Length: Default 5, Range 2-20. Controls pivot sensitivity for structure analysis.
FVG Minimum Size: Default 0.1%, Range 0.01-2.0%. Filters insignificant gaps.
Order Block Lookback: Default 10, Range 3-30. Bars to search for OB formations.
Liquidity Sweep Threshold: Default 0.3%, Range 0.05-1.0%. Minimum wick extension beyond swing points.
Display Settings
Show Probability Table: Toggle the probability matrix display on/off.
Show Top N Probabilities: Default 5, Range 3-10. Number of predicted patterns to display.
Show SMC Markers: Toggle on-chart pattern labels.
✅ Best Use Cases
Anticipating continuation or reversal patterns after liquidity sweeps
Identifying high-probability BOS/CHoCH sequences for trend trading
Filtering FVG and Order Block signals based on historical follow-through rates
Building confluence by comparing predicted patterns with other technical analysis
Studying how SMC patterns typically sequence on specific instruments or timeframes
⚠️ Limitations
Predictions are based solely on historical pattern frequency and do not account for fundamental factors
Low sample counts produce unreliable probabilities—always check the Samples display
Market regime changes can invalidate historical transition patterns
The indicator requires sufficient historical data to build meaningful probability matrices
Pattern detection uses standardized parameters that may not capture all institutional activity
💡 What Makes This Unique
Linguistic Modeling Applied to Markets: Treats SMC patterns like words in a language, analyzing how they “flow” together
Quantified Pattern Relationships: Transforms subjective SMC analysis into objective probability percentages
Adaptive Learning: Matrix rebuilds periodically to incorporate recent pattern behavior
Comprehensive SMC Coverage: Tracks all major Smart Money Concepts in a unified probability framework
🔬 How It Works
1. Pattern Detection Phase
Each bar is analyzed for SMC formations using configurable detection parameters
A priority hierarchy assigns the most significant pattern when multiple detections occur
2. Sequence Encoding Phase
Detected patterns are stored in a rolling history buffer of recent classifications
The current N-gram context is encoded into a unique integer identifier
3. Matrix Construction Phase
Historical pattern sequences are iterated to count transition occurrences
Each context-to-next-pattern transition increments the appropriate matrix cell
4. Probability Calculation Phase
Current context ID retrieves corresponding transition counts from the matrix
Raw counts are converted to percentages based on total context occurrences
5. Visualization Phase
Probabilities are sorted and the top N predictions are displayed in the table
Chart markers identify the current detected pattern for visual reference
💡 Note:
This indicator performs best when used as a confluence tool alongside traditional SMC analysis. The probability predictions highlight statistically common pattern sequences but should not be used as standalone trading signals. Always verify predictions against price action context, higher timeframe structure, and your overall trading plan. Monitor the sample count to ensure predictions are based on adequate historical data.
