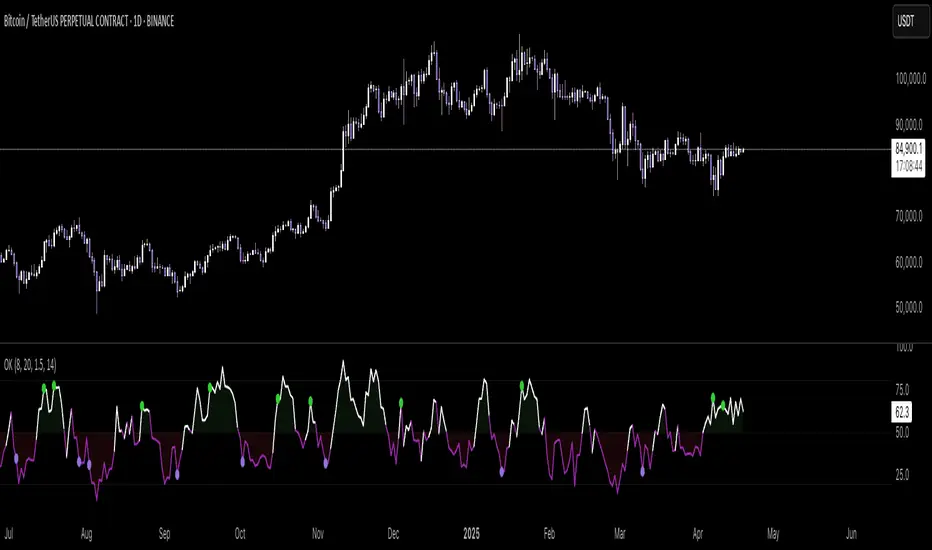
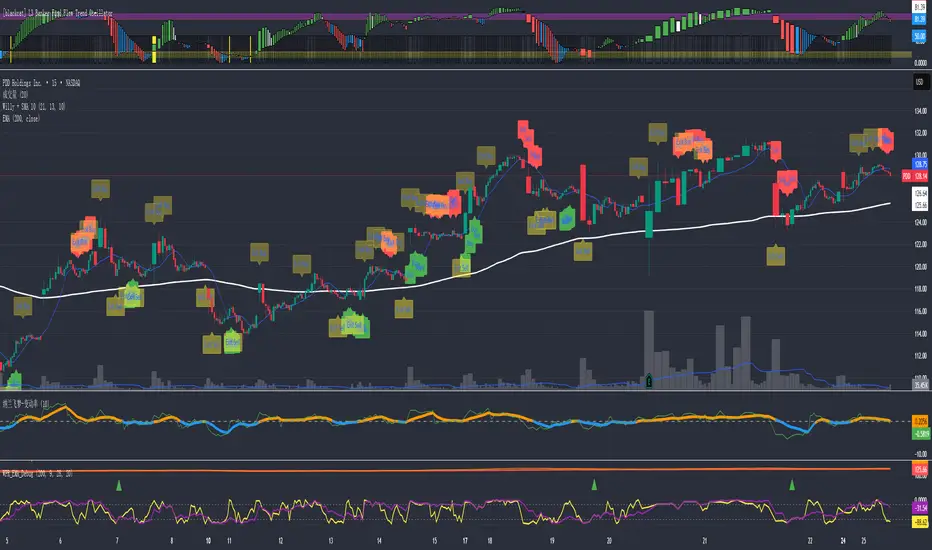
Oath KeeperOath Keeper - Advanced Money Flow & Market Dynamics Indicator
A sophisticated indicator that analyzes market dynamics through money flow patterns, volume analysis, and liquidation detection to identify high-probability trading opportunities.
Core Features:
• Smart Money Flow Analysis: Proprietary calculation of institutional money movement
• Volume-Enhanced Signals: Multi-timeframe volume confirmation
• Liquidation Detection: Identifies potential forced liquidation events
• Advanced Signal Classification: Regular, Super, and Fakeout signals
Signal Types:
1. Regular Signals (Green/Purple Circles)
• Volume-confirmed momentum shifts
• Money flow threshold breaches
• Institutional participation confirmation
2. Super Signals (Green/Purple Squares)
• Deep oversold/overbought reversals
• High-volume rejection patterns
• Liquidation event confirmation
3. Fakeout Signals (Red X)
• Rapid sentiment shifts
• Trap detection
• False breakout warnings
Visual Components:
• Dynamic Money Flow Line (White/Purple)
• Order Flow Clouds (Green/Red with high transparency)
• Reference Levels (20, 50, 80)
• Multi-type Signal Markers
• Color-coded momentum visualization
Interpretation Guide:
• Green Cloud: Bullish money flow dominance
• Red Cloud: Bearish money flow dominance
• Circle Markers: Standard reversals
• Square Markers: High-conviction moves
• X Markers: Potential trap zones
Best Practices:
• Most effective on 1H+ timeframes
• Use with major trading pairs
• Wait for candle close confirmation
• Combine with support/resistance levels
• Monitor volume confirmation
• Use multiple timeframe analysis
This indicator helps traders identify institutional money flow, potential liquidation events, and market reversals by analyzing volume patterns and money flow dynamics, providing multiple confirmation layers for trade decisions.
Note: Performance varies with market conditions and timeframes. Always employ proper risk management.
在脚本中搜索"股价在8元左右净利润为正市值小于80亿的热门股票有哪些"
Stochastic with 4 %K LinesQuad Rotation Stochastic Strategy – Indicator Description
The Quad Rotation Strategy is a momentum-based technical analysis tool that overlays four distinct Stochastic %K lines on a single chart. Each line is calculated using a unique set of parameters, allowing traders to visualize and compare momentum signals across varying sensitivities — from fast-reacting setups to slower, trend-confirming ones.
This multi-speed stochastic view is designed to help traders:
Identify rotation points where shorter-term stochastic lines cross faster than longer-term lines, signaling early reversals or trend continuation.
Confirm strength or weakness in price action by observing alignment or divergence among the %K lines.
Fine-tune entries and exits by using fast %K lines for timing and slower ones for confirmation.
🔍 How It Works:
Four separate %K lines are plotted, each with configurable Length and Smoothing.
All lines are calculated using the standard Stochastic formula:
(%K = SMA of (Close - Low) / (High - Low) over period)
No %D lines are included to keep the focus on %K behavior across different speeds.
Standard overbought (80), oversold (20), and midline (50) levels are provided for context.
This indicator is best used in:
Trend continuation setups where faster stochastics pull back to oversold while slower ones remain bullish.
Reversal zones where all four %K lines converge or cross in extreme levels.
Range-bound environments where confluence of extremes offers swing trade opportunities.

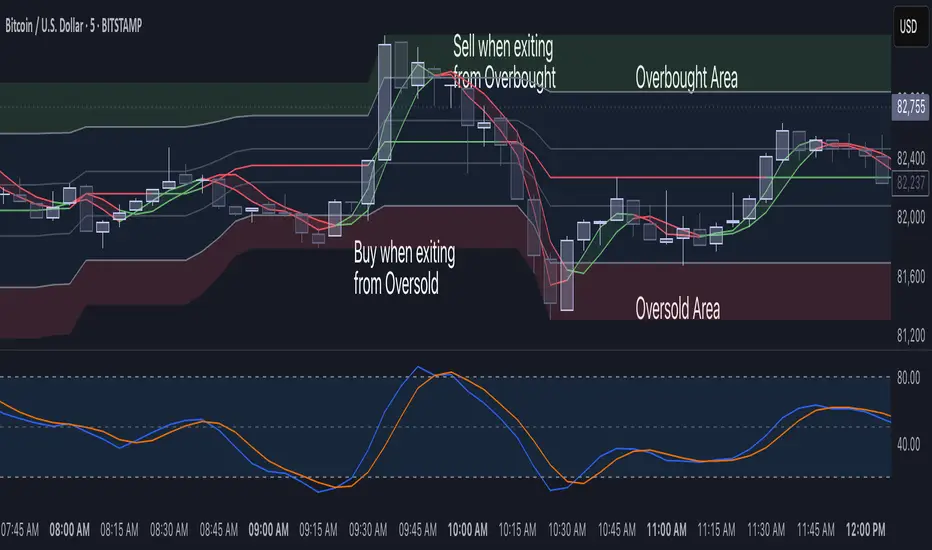
Reversal Strength Meter – Adib NooraniThe Reversal Strength Meter is an oscillator designed to identify potential reversal zones based on supply and demand dynamics. It uses smoothed stochastic logic to reduce noise and highlight areas where momentum may be weakening, signaling possible market turning points.
🔹 Smooth, noise-reduced stochastic oscillator
🔹 Custom zones to highlight potential supply and demand imbalances
🔹 Non-repainting, compatible across all timeframes and assets
🔹 Visual-only tool — intended to support discretionary trading decisions
This oscillator assists scalpers and intraday traders in tracking subtle shifts in momentum, helping them identify when a market may be preparing to reverse — always keeping in mind that trading is based on probabilities, not certainties.
📘 How to Use the Indicator Efficiently
For Reversal Trading:
Buy Setup
– When the blue line dips below the 20 level, wait for it to re-enter above 20.
– Look for reversal candlestick patterns (e.g., bullish engulfing, hammer, or morning star).
– Enter above the pattern’s high, with a stop loss below its low.
Sell Setup
– When the blue line rises above the 80 level, wait for it to re-enter below 80.
– Look for bearish candlestick patterns (e.g., bearish engulfing, inverted hammer, or evening star).
– Enter below the pattern’s low, with a stop loss above its high.
🛡 Risk Management Guidelines
Risk only 0.5% of your capital per trade
Book 50% profits at a 1:1 risk-reward ratio
Trail the remaining 50% using price action or other supporting indicators

RSI VWAP POC [Uncle Sam Trading]Category: Oscillators, Volume, Market Profile
Timeframe: Suitable for all timeframes
Markets: Crypto, Forex, Stocks, Commodities
Overview
The RSI VWAP POC indicator is a powerful and innovative oscillator that combines the Relative Strength Index (RSI), Volume-Weighted Average Price (VWAP), and Point of Control (POC) from market profile analysis. Designed to provide traders with clear, high-probability trading signals, this indicator helps you identify key market levels, spot overbought/oversold conditions, and time your entries and exits with precision. Whether you’re a day trader, swing trader, or scalper, this free tool adds significant value to your trading strategy by offering a unique blend of momentum, volume, and market profile insights.
How It Works
This indicator integrates three core components to deliver actionable insights:
RSI (Relative Strength Index): Measures momentum to identify overbought (above 70) and oversold (below 30) conditions, helping you anticipate potential reversals.
VWAP (Volume-Weighted Average Price): Calculates a volume-weighted price benchmark, which is used to compute a more accurate, volume-sensitive RSI. This ensures the indicator reflects true market dynamics.
POC (Point of Control): Derived from market profile analysis, the POC represents the price level with the highest traded volume in a session, acting as a critical support or resistance level.
The indicator plots a smoothed RSI based on VWAP, overlaid with market profile data on a user-defined higher timeframe (default: 4H). The POC is displayed as a red line, with aqua bars indicating the value area where the majority of trading volume occurred. When the RSI crosses the POC, the indicator generates clear buy and sell signals:
Strong Buy (SBU): RSI crosses above the POC in an oversold zone.
Strong Sell (SBD): RSI crosses below the POC in an overbought zone.
Additional features include:
Background colors to highlight bullish (green) or bearish (red) trends.
Shaded zones for overbought (70/60) and oversold (30/40) levels.
Customizable settings to fit your trading style and timeframe.
How This Indicator Adds Value
The RSI VWAP POC indicator offers several key benefits that enhance your trading performance:
High-Probability Signals: By combining RSI, VWAP, and POC, this indicator identifies trades at key market levels where price is likely to react, increasing your win rate.
Improved Timing: Clear buy and sell signals, such as ‘SBU’ and ‘SBD’, help you enter and exit trades at optimal points, maximizing profitability.
Risk Management: Overbought/oversold zones and trend confirmation via background colors help you avoid false signals, protecting your capital.
Versatility: Suitable for all markets (crypto, forex, stocks) and timeframes, making it a valuable tool for traders of all experience levels.
Time Efficiency: The indicator does the heavy lifting by analyzing momentum, volume, and market profile data, allowing you to focus on executing trades.
Real-World Performance Example: On a 1-hour Bitcoin chart with a 4-hour higher timeframe, this indicator identified a strong sell signal on April 6th at 12:00 ($82,000), leading to a 9% drop to $74,600. A subsequent strong buy signal on April 7th at 04:00 ($76,200) captured a 6% rise to $81,200 – a potential 25% profit with 5x leverage if exited at 5%.
How to Use
Add the Indicator: Search for “RSI VWAP POC ” in TradingView’s indicator library and add it to your chart.
Set Your Timeframe: The indicator works on any timeframe but is optimized for a 1-hour chart with a 4-hour higher timeframe (set in the settings).
Interpret Signals:
Look for ‘SBU’ (strong buy) labels when the RSI crosses above the POC in an oversold zone, indicating a potential buying opportunity.
Look for ‘SBD’ (strong sell) labels when the RSI crosses below the POC in an overbought zone, signaling a potential selling opportunity.
Use the background colors (green for bullish, red for bearish) to confirm the trend.
Combine with Your Strategy: Use the indicator alongside your existing analysis (e.g., support/resistance, candlestick patterns) for best results.
Settings and Customization
The indicator is highly customizable to suit your trading needs:
RSI Length (Default: 14): Adjust the sensitivity of the RSI. Use a shorter length (e.g., 10) for scalping, or a longer length (e.g., 20) for smoother signals.
EMA Smoothing Length (Default: 3): Smooths the RSI line. Increase to 5 or 7 for less choppy signals in volatile markets.
Higher Timeframe (Default: 240 minutes): Set to 240 (4 hours) for a 1-hour chart. Adjust based on your chart’s timeframe (e.g., 60 minutes for a 15-minute chart).
Value Area Percentage (Default: 100%): Defines the size of the value area around the POC. Lower to 70% for a tighter focus on key levels.
Overbought/Oversold Thresholds (Defaults: 70/30): Adjust these levels to match market conditions (e.g., 80/20 for trending markets).
Show POC Line (Default: True): Toggle the red POC line on or off.
Show Buy/Sell Signals: Enable ‘Show Strong Breakup Signals’ and ‘Show Strong Breakdown Signals’ to focus on high-probability trades.
Why Choose This Indicator?
The RSI VWAP POC indicator stands out by offering a unique combination of momentum, volume, and market profile analysis in a single, easy-to-use tool. It’s designed to help traders of all levels make informed decisions, reduce risk, and increase profitability. Whether you’re trading Bitcoin, forex pairs, or stocks, this indicator provides the clarity and precision you need to succeed.

Multi Oscillator OB/OS Signals v3 - Scope TestIndicator Description: Multi Oscillator OB/OS Signals
Purpose:
The "Multi Oscillator OB/OS Signals" indicator is a TradingView tool designed to help traders identify potential market extremes and momentum shifts by monitoring four popular oscillators simultaneously: RSI, Stochastic RSI, CCI, and MACD. Instead of displaying these oscillators in separate panes, this indicator plots distinct visual symbols directly onto the main price chart whenever specific predefined conditions (typically related to overbought/oversold levels or line crossovers) are met for each oscillator. This provides a consolidated view of potential signals from these different technical tools.
How It Works:
The indicator calculates the values for each of the four oscillators based on user-defined settings (like length periods and price sources) and then checks for specific signal conditions on every bar:
Relative Strength Index (RSI):
It monitors the standard RSI value.
When the RSI crosses above the user-defined Overbought (OB) level (e.g., 70), it plots an "Overbought" symbol (like a downward triangle) above that price bar.
When the RSI crosses below the user-defined Oversold (OS) level (e.g., 30), it plots an "Oversold" symbol (like an upward triangle) below that price bar.
Stochastic RSI:
This works similarly to RSI but is based on the Stochastic calculation applied to the RSI value itself (specifically, the %K line of the Stoch RSI).
When the Stoch RSI's %K line crosses above its Overbought level (e.g., 80), it plots its designated OB symbol (like a downward arrow) above the bar.
When the %K line crosses below its Oversold level (e.g., 20), it plots its OS symbol (like an upward arrow) below the bar.
Commodity Channel Index (CCI):
It tracks the CCI value.
When the CCI crosses above its Overbought level (e.g., +100), it plots its OB symbol (like a square) above the bar.
When the CCI crosses below its Oversold level (e.g., -100), it plots its OS symbol (like a square) below the bar.
Moving Average Convergence Divergence (MACD):
Unlike the others, MACD signals here are not based on fixed OB/OS levels.
It identifies when the main MACD line crosses above its Signal line. This is considered a bullish crossover and is indicated by a specific symbol (like an upward label) plotted below the price bar.
It also identifies when the MACD line crosses below its Signal line. This is a bearish crossover, indicated by a different symbol (like a downward label) plotted above the price bar.
Visualization:
All these signals appear as small, distinct shapes directly on the price chart at the bar where the condition occurred. The shapes, their colors, and their position (above or below the bar) are predefined for each signal type to allow for quick visual identification. Note: In the current version of the underlying code, the size of these shapes is fixed (e.g., tiny) and not user-adjustable via the settings.
Configuration:
Users can access the indicator's settings to customize:
The calculation parameters (Length periods, smoothing, price source) for each individual oscillator (RSI, Stoch RSI, CCI, MACD).
The specific Overbought and Oversold threshold levels for RSI, Stoch RSI, and CCI.
The colors associated with each type of signal (OB, OS, Bullish Cross, Bearish Cross).
(Limitation Note: While settings exist to toggle the visibility of signals for each oscillator individually, due to a technical workaround in the current code, these toggles may not actively prevent the shapes from plotting if the underlying condition is met.)
Alerts:
The indicator itself does not automatically generate pop-up alerts. However, it creates the necessary "Alert Conditions" within TradingView's alert system. This means users can manually set up alerts for any of the specific signals generated by the indicator (e.g., "RSI Overbought Enter," "MACD Bullish Crossover"). When creating an alert, the user selects this indicator, chooses the desired condition from the list provided by the script, and configures the alert actions.
Intended Use:
This indicator aims to provide traders with convenient visual cues for potential over-extension in price (via OB/OS signals) or shifts in momentum (via MACD crossovers) based on multiple standard oscillators. These signals are often used as potential indicators for:
Identifying areas where a trend might be exhausted and prone to a pullback or reversal.
Confirming signals generated by other analysis methods or trading strategies.
Noting shifts in short-term momentum.
Disclaimer: As with any technical indicator, the signals generated should not be taken as direct buy or sell recommendations. They are best used in conjunction with other forms of analysis (price action, trend analysis, volume, fundamental analysis, etc.) and within the framework of a well-defined trading plan that includes risk management. Market conditions can change, and indicator signals can sometimes be false or misleading.

Adaptable Relative Momentum Index [ParadoxAlgo]The Adaptable Relative Momentum Index (RMI) by ParadoxAlgo is an advanced momentum-based indicator that builds upon the well-known RSI (Relative Strength Index) concept by introducing a customizable momentum length. This indicator measures price momentum over a specified number of periods and applies a Rolling Moving Average (RMA) to both the positive and negative price changes. The result is a versatile tool that can help traders gauge the strength of a trend, pinpoint overbought/oversold levels, and potentially identify breakout opportunities.
⸻
Smart Configuration Feature
What sets this version of the RMI apart is ParadoxAlgo’s exclusive “Smart Configuration” functionality. Instead of manually adjusting parameters, traders can simply select their Asset Class (e.g., Stocks, Forex, Futures/Indices, Crypto, Commodities) and Trading Style (e.g., Scalping, Day Trading, Swing Trading, Short-Term Investing, Long-Term Investing). Based on these selections, the indicator automatically optimizes its core parameters:
• Length – The period over which the price changes are smoothed.
• Momentum Length – The number of bars used to calculate the price change.
By automating this process, users save time on tedious trial-and-error adjustments, ensuring that the RMI’s settings are tailored to the characteristics of specific markets and personal trading horizons.
⸻
Key Features & Benefits
1. Momentum-Based Insights
• Uses RMA to smooth price movements, helping identify shifts in market momentum more clearly than a basic RSI.
• Enhanced adaptability for a wide range of asset classes and time horizons.
2. Simple Yet Powerful Configuration
• Smart Configuration automatically sets optimal parameter values for each combination of asset class and trading style.
• Eliminates guesswork and manual recalibration when switching between markets or timeframes.
3. Overbought & Oversold Visualization
• Integrated highlight zones mark potential overbought and oversold extremes (default at 80 and 20).
• Optional breakout highlighting draws attention to times when the indicator crosses these key thresholds, helping spot possible entry or exit signals.
4. Intuitive Design & Ease of Use
• Clean plotting and color-coded signal lines make it easy to interpret bullish or bearish shifts in momentum.
• Straightforward dropdown menus keep the interface user-friendly, even for novice traders.
⸻
Practical Applications
• Early Trend Detection: Spot emerging trends when the RMI transitions from oversold to higher levels or vice versa.
• Breakout Confirmation: Confirm potential breakout trades by tracking overbought/oversold breakouts alongside other technical signals.
• Support/Resistance Confluence: Combine RMI signals with horizontal support/resistance levels to reinforce trade decisions.
• Trade Timing: Quickly gauge when momentum could be shifting, helping you time entries and exits more effectively.
⸻
Disclaimer
As with any technical indicator, the Adaptable Relative Momentum Index should be used as part of a broader trading strategy that includes risk management, fundamental analysis, and other forms of technical confirmation. Past performance does not guarantee future results.
⸻
Enjoy using the Adaptable RMI and experience a more streamlined, flexible approach to momentum analysis. Feel free to explore different asset classes and trading styles to discover which configurations resonate best with your unique trading preferences.

Stochastic Overlay [NLR]If you've ever traded with the Stochastic oscillator, you probably love its ability to gauge momentum and overbought/oversold conditions. However, one common frustration is interpreting its movements alongside the actual price chart. The oscillator, plotted separately, can feel disconnected from price action, forcing traders to constantly glance back and forth. That’s exactly the problem I wanted to solve with this indicator.
The Solution: Stochastic Overlay
This indicator takes the familiar Stochastic oscillator and integrates it directly onto the price chart. Instead of struggling to correlate Stochastic signals with price movements, you now see the levels overlaid on the main chart, bringing momentum analysis into a more intuitive space.
What is the Stochastic Oscillator? (For the Newbies)
The Stochastic oscillator is a momentum-based indicator that measures the closing price relative to the high-low range over a specified period. It fluctuates between 0 and 100, helping traders identify potential reversals when the market is overbought (above 80) or oversold (below 20). The two key components are:
%K (fast-moving line)
%D (a smoothed moving average of %K)
Technical Details of the Overlay
The indicator adjusts the traditional Stochastic calculation by multiplying the timeframe (HTF multiplier), allowing traders to view higher-timeframe Stochastics. Set HTF Multiplier to 1 to see current timeframe Stochastics
It plots horizontal reference lines representing 0%, 20%, 40%, 50%, 60%, 80%, and 100% levels, giving a visual framework of price movement.
Color-coded fills help differentiate bullish and bearish zones—making it easy to spot potential turning points.
Why Do the %K & %D Lines Look “Crooked”?
Normally, the %K and %D lines range between 0 and 100, but in this overlay, they are scaled to fit the current price gap (the difference between the highest and lowest price in the selected period). This means their movement aligns more closely with price action, but it may appear distorted compared to a standard Stochastic oscillator.
For clarity, you can enable the visibility of %K and %D (Show %K %D option), allowing the scaled Stochastic values to be plotted within the price range.
Why Use This Overlay?
Better price interpretation: Instead of staring at a separate oscillator panel, you see momentum levels right where the price action unfolds.
Higher-timeframe integration: Adjusting the multiplier allows you to track the Stochastic behavior of larger timeframes without switching charts.
Clear visual cues: The colored fills and midpoint signals enhance readability for momentum shifts.
This tool transforms the way traders engage with Stochastic indicators, making momentum analysis more intuitive and efficient. Try it out, and see how your interpretation of price and momentum improves!
RSI SiaThis script is a custom indicator for TradingView written in Pine Script version 5. It calculates the Relative Strength Index (RSI) and uses it to generate trading signals. Here's a breakdown of what the script does:
Key Features:
RSI Calculation:
The script calculates the RSI using a 14-period window.
It also calculates the momentum of the RSI over a 9-period window (rsi delta) and a simple moving average (SMA) of the RSI over a 3-period window (rsi sma).
Composite Index (CI):
The composite index is calculated as the sum of rsi delta and rsi sma.
Horizontal Lines and Zones:
Several horizontal lines are plotted at different levels (e.g., 20, 40, 60, 80, 120, 150, 180) to indicate overbought and oversold conditions.
Filled zones are created between certain levels to highlight areas of interest.
Moving Averages:
The script plots SMA and EMA of the RSI when Enable RSI ma is set to true.
It also plots moving averages of the composite index.
Crossover Signals:
The script detects bullish and bearish crossovers between the SMA and EMA of the RSI.
It plots shapes (labels) on the chart to indicate buy (BUY) and sell (SELL) signals based on these crossovers.
Usage:
Enable RSIma: This input allows you to enable or disable the plotting of RSI moving averages.
i1: This variable is used to adjust the vertical position of the composite index and its moving averages.
Visualization:
The RSI is plotted in black.
The RSI fast trigger line (SMA of RSI) is plotted in green when enabled.
The RSI slow trigger line (EMA of RSI) is plotted in orange when enabled.
The composite index and its moving averages are plotted in red, green, and orange.
Buy and sell signals are indicated with green and red labels, respectively.
This script can be used to identify potential trading opportunities based on RSI crossovers and the composite index.

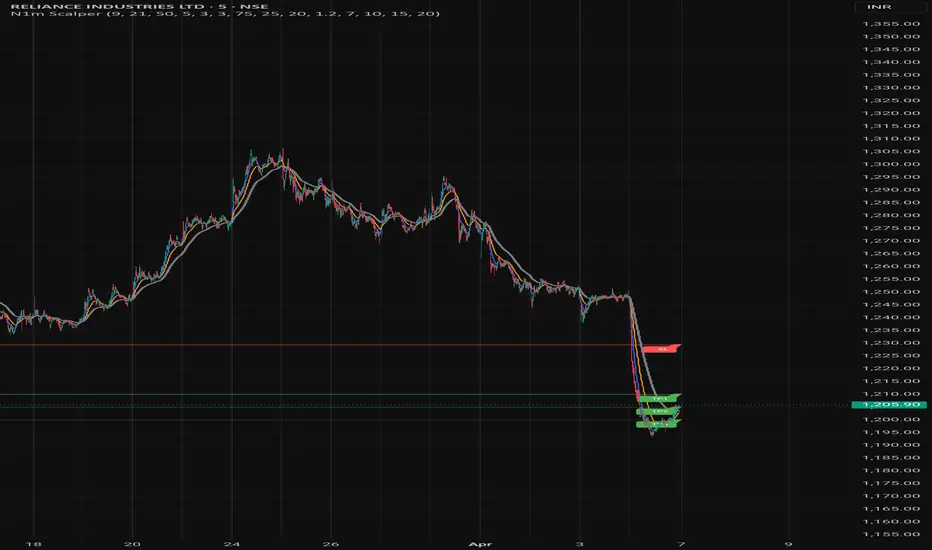
Nifty 1m EMA Pullback Scalper Signals
### **Master the Market with the Sniper Scalping Strategy for Nifty (1-Minute Timeframe)**
Unlock the power of precision trading with this expertly crafted **Sniper Scalping Strategy**, designed specifically for the Nifty index on a lightning-fast 1-minute timeframe. Perfect for traders who thrive on quick decisions and small, consistent profits, this strategy combines multiple indicators to deliver razor-sharp entries and exits—ideal for India’s dynamic market.
#### **Why This Strategy Stands Out**
- **Pinpoint Accuracy**: Harness the synergy of the **5 EMA and 10 EMA crossover** to lock onto the short-term trend, while the **Stochastic Oscillator (14,3,3)** times your entries and exits with surgical precision.
- **Fast and Effective**: Tailored for the 1-minute chart, this strategy capitalizes on Nifty’s volatility, targeting **10-point profits** with a tight **5-point stop-loss**—keeping your risk low and rewards high.
- **Trend + Momentum**: Blend trend-following (EMAs) with momentum signals (Stochastic) for a robust, multi-dimensional approach that cuts through market noise.
#### **How It Works**
- **Buy Signal**: Enter long when the 5 EMA crosses above the 10 EMA and the Stochastic rises above 20—catching the uptrend at its sweet spot.
- **Sell Signal**: Go short when the 5 EMA dips below the 10 EMA and the Stochastic falls below 80—riding the downtrend with confidence.
- **Exit Like a Pro**: Take profits at 10 points or when the Stochastic hits overbought/oversold extremes, ensuring you’re in and out before the market shifts.
#### **Perfect for Nifty Scalpers**
Built for the fast-paced world of Nifty trading, this strategy shines during high-volatility sessions like the market open or global overlaps. Whether you’re a beginner honing your skills or a seasoned trader seeking consistency, the Sniper Scalping Strategy offers a clear, actionable framework to scalp profits with discipline and precision.
#### **Get Started**
Test it in a demo account, refine it to your style, and watch your scalping game soar. Trade smart, stay focused, and let the Sniper Scalping Strategy turn Nifty’s 1-minute moves into your edge!
IDX - 5UPThe UDX-5UP is a custom indicator designed to assist traders in identifying trends, entry and exit signals, and market reversal moments with greater accuracy. It combines price analysis, volume, and momentum (RSI) to provide clear buy ("Buy") and sell ("Sell") signals across any asset and timeframe, whether you're a scalper on the 5M chart or a swing trader on the 4H chart. Inspired by robust technical analysis strategies, the UDX-5UP is ideal for traders seeking a reliable tool to operate in volatile markets such as cryptocurrencies, forex, stocks, and futures.
Components of the UDX-5UP
The UDX-5UP consists of three main panels that work together to provide a comprehensive view of the market:
Main Panel (Price):
Pivot Supertrend: A dynamic line that changes color to indicate the trend. Green for an uptrend (look for buys), red for a downtrend (look for sells).
SMAs (Simple Moving Averages): Two SMAs (8 and 21 periods) to confirm the trend direction. When the SMA 8 crosses above the SMA 21, it’s a bullish signal; when it crosses below, it’s a bearish signal.
Entry/Exit Signals: "Buy" (green) and "Sell" (red) labels are plotted on the chart when entry or exit conditions are met.
Volume Panel:
Colored Volume Bars: Green bars indicate dominant buying volume, while red bars indicate dominant selling volume.
Volume Moving Average (MA 20): A blue line that helps identify whether the current volume is above or below the average, confirming the strength of the movement.
RSI Panel:
RSI (Relative Strength Index): Calculated with a period of 14, with overbought (70) and oversold (30) lines to identify momentum extremes.
Divergences: The indicator detects divergences between the RSI and price, plotting signals for potential reversals.
How the UDX-5UP Works
The UDX-5UP uses a combination of rules to generate buy and sell signals:
Buy Signal ("Buy"):
The Pivot Supertrend changes from red to green.
The SMA 8 crosses above the SMA 21.
The volume is above the MA 20, with green bars (indicating buying pressure).
The RSI is rising and, ideally, below 70 (not overbought).
Example: On the 4H chart, the price of Tether (USDT) is at 0.05515. The Pivot Supertrend turns green, the SMA 8 crosses above the SMA 21, the volume shows green bars above the MA 20, and the RSI is at 46. The UDX-5UP plots a "Buy".
Sell Signal ("Sell"):
The Pivot Supertrend changes from green to red.
The SMA 8 crosses below the SMA 21.
The volume is above the MA 20, with red bars (indicating selling pressure).
The RSI is falling and, ideally, above 70 (overbought).
Example: On the 4H chart, the price of Tether rises to 0.05817. The Pivot Supertrend turns red, the SMA 8 crosses below the SMA 21, the volume shows red bars, and the RSI is above 70. The UDX-5UP plots a "Sell".
RSI Divergences:
The indicator identifies bullish divergences (price makes a lower low, but RSI makes a higher low) and bearish divergences (price makes a higher high, but RSI makes a lower high), plotting alerts for potential reversals.
Adjustable Settings
The UDX-5UP is highly customizable to suit your trading style:
Pivot Supertrend Period: Default is 2. Increase to 3 or 4 for more conservative signals (fewer false positives, but more lag).
SMA Periods: Default is 8 and 21. Adjust to 5 and 13 for smaller timeframes (e.g., 5M) or 13 and 34 for larger timeframes (e.g., 1D).
RSI Period: Default is 14. Reduce to 10 for greater sensitivity or increase to 20 for smoother signals.
Overbought/Oversold Levels: Default is 70/30. Adjust to 80/20 in volatile markets.
Display Panels: You can enable/disable the volume and RSI panels to simplify the chart.
How to Use the UDX-5UP
Identify the Trend:
Use the Pivot Supertrend and SMAs to determine the market direction. Uptrend: look for buys. Downtrend: look for sells.
Confirm with Volume and RSI:
For buys: Volume above the MA 20 with green bars, RSI rising and below 70.
For sells: Volume above the MA 20 with red bars, RSI falling and above 70.
Enter the Trade:
Enter a buy when the UDX-5UP plots a "Buy" and all conditions are aligned.
Enter a sell when the UDX-5UP plots a "Sell" and all conditions are aligned.
Plan the Exit:
Use Fibonacci levels or support/resistance on the price chart to set targets.
Exit the trade when the UDX-5UP plots an opposite signal ("Sell" after a buy, "Buy" after a sell).
Tips for Beginners
Start with Larger Timeframes: Use the 4H or 1D chart for more reliable signals and less noise.
Combine with Other Indicators: Use the UDX-5UP with tools like Fibonacci or the Candles RSI (another powerful indicator) to confirm signals.
Practice in Demo Mode: Test the indicator in a demo account before using real money.
Manage Risk: Always use a stop-loss and don’t risk more than 1-2% of your capital per trade.
Why Use the UDX-5UP?
Simplicity: Clear "Buy" and "Sell" signals make trading accessible even for beginners.
Versatility: Works on any asset (crypto, forex, stocks) and timeframe.
Multiple Confirmations: Combines price, volume, and momentum to reduce false signals.
Customizable: Adjust the settings to match your trading style.
Author’s Notes
The UDX-5UP was developed based on years of trading and technical analysis experience. It is an evolution of tested strategies, designed to help traders navigate volatile markets with confidence. However, no indicator is infallible. Always combine the UDX-5UP with proper risk management and fundamental analysis, especially in unpredictable markets. Feedback is welcome – leave a comment or reach out with suggestions for improvements!

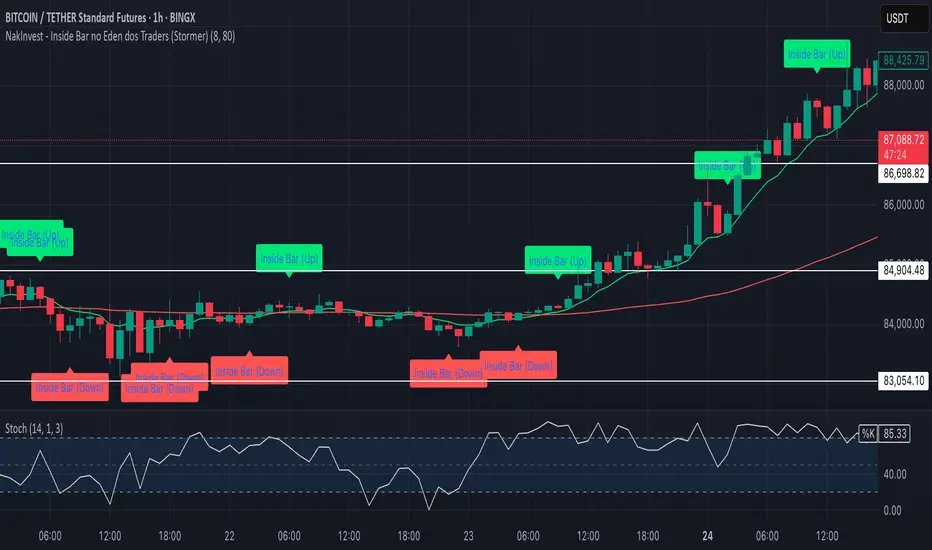
NakInvest - Inside Bar no Eden dos Traders (Stormer)📌 NakInvest - Inside Bar Detector (Éden dos Traders Enhanced Detection)
This indicator is designed to identify Inside Bars that occur during strong trending conditions, following the popular Éden dos Traders strategy by Stormer, famous brazilian trader. It uses the relationship between two EMAs (Short EMA & Long EMA) to determine whether the market is in a bullish or bearish trend, and highlights Inside Bars that meet specific criteria.
⸻
🔍 What This Indicator Does:
1. EMA-Based Trend Detection:
• Identifies Uptrends when the Short EMA is above the Long EMA.
• Identifies Downtrends when the Short EMA is below the Long EMA.
2. Inside Bar Detection:
• An Inside Bar is detected when the entire candle (body & wicks) is contained within the body of the previous candle.
• This pattern suggests consolidation and potential breakouts, especially when found within a strong trend.
3. Debug Mode for Transparency:
• When enabled, provides visual markers to indicate when the conditions for trend detection and Inside Bars are met.
• Helps traders understand why certain candles are detected and others are not.
⸻
📈 How to Use:
• Apply this indicator to any market and timeframe, but it’s most effective on higher timeframes (H1, H4, Daily).
• Ideal for traders looking for trend-continuation setups or reversal signals after periods of consolidation.
• Combine this indicator with other tools (e.g., Volume Analysis, Price Action Patterns) for greater accuracy.
⸻
⚙️ Indicator Settings:
1. Short EMA Length: The period for the fast-moving average (default: 8).
2. Long EMA Length: The period for the slow-moving average (default: 80).
3. Enable Debug Mode: Toggle visibility of debug markers to better understand condition logic.
⸻
📢 Alerts:
This script includes labels for:
• IB (Up): Inside Bar detected during an uptrend.
• IB (Down): Inside Bar detected during a downtrend.
⸻
📌 Disclaimer:
This indicator is intended for educational purposes only and is not financial advice. Always perform your own research and consult with a financial professional before making any trading decisions.
Optimized WPR Strategy with Filters (Debug)Identifying Market Trends:
The 200-period EMA is used to determine the short-term trend of the market.
When the price is above the 200-period EMA, it suggests a potential bullish market and an uptrend, and the strategy will only look for buying opportunities.
When the price is below the 200-period EMA, it suggests a potential bearish market and a downtrend, and the strategy will only look for selling opportunities.
When the 200-period EMA intersects with the price, it indicates that the market may be in a directionless consolidation phase.
Identifying Potential Reversal Points:
The strategy employs two Williams %R (WPR) indicators: one with a 9-period (fast WPR) and another with a 28-period (slow WPR).
WPR is a momentum indicator used to identify overbought and oversold conditions in the market. Its value oscillates between -100 and 0, with values near -100 indicating oversold conditions and values near 0 indicating overbought conditions.
In an uptrend (when the price is above the 200 EMA), the strategy seeks buying opportunities when both WPR indicators cross above -80 (the oversold zone) from below. This is considered a bullish signal, suggesting the market may be about to rebound. Sell signals are ignored at this time.
In a downtrend (when the price is below the 200 EMA), the strategy seeks selling opportunities when both WPR indicators cross below -20 (the overbought zone) from above. This is considered a bearish signal, suggesting the market may be about to reverse downward. Buy signals are ignored at this time.
Summary:
In summary, this strategy first uses the 200-period EMA to determine the overall trend direction of the market. Then, within the confirmed trend direction, it utilizes the simultaneous crossing of the overbought or oversold zones by the dual WPR indicators to identify potential reversal points as entry signals for trading. The strategy emphasizes that trading signals are only valid when both WPR indicators meet the conditions.
Triple SRSI-MFI Ⅲ - Multi TimeframeTriple SRSI-MFI Ⅲ - Multi Timeframe Indicator
Description
The Triple SRSI-MFI Ⅲ - Multi Timeframe indicator is a powerful tool designed to combine Stochastic RSI (SRSI) and Money Flow Index (MFI) across multiple timeframes (higher, current, and lower). It provides a comprehensive view of market momentum and potential overbought/oversold conditions by calculating a weighted hybrid of SRSI-MFI values from three different timeframes. The indicator also integrates Bollinger Bands to help identify trend direction and volatility.
This indicator is ideal for traders who want to analyze market conditions across multiple timeframes without switching charts. It automatically adjusts settings based on the current timeframe and includes a dynamic weighting system optimized for Bitcoin volatility. Additionally, a real-time information panel displays the market state (buy/sell) and signal strength.
Key Features
Multi-Timeframe Analysis: Combines SRSI-MFI from higher, current, and lower timeframes for a holistic view.
Dynamic Weighting: Automatically adjusts weights for each timeframe based on Bitcoin volatility, with an option for manual customization.
Bollinger Bands Integration: Visualizes trend direction and volatility using Bollinger Bands, with customizable source selection.
Real-Time Info Panel: Displays market state (buy/sell) and signal strength (%) in the top-right corner of the chart.
Customizable Settings: Allows users to tweak MFI source, Bollinger Bands parameters, and visibility of individual components.
How to Use
Add to Chart: Add the "Triple SRSI-MFI Ⅲ - Multi Timeframe" indicator to your chart.
Interpret Signals:
Market State (Buy/Sell): Shown in the info panel. "Buy" when the average SRSI-MFI is above the Bollinger Bands basis, "Sell" when below.
Strength (%): The relative position of the average SRSI-MFI within the Bollinger Bands, scaled from 0% to 100%.
Overbought/Oversold Levels: The indicator plots horizontal lines at 80 (overbought) and 20 (oversold). Use these as potential reversal zones.
Combine with Price Action: Use the indicator in conjunction with price action or other tools for better decision-making.
Adjust Settings: Customize the settings (e.g., Bollinger Bands length, weights, visibility) to match your trading style.
Settings
MFI Source: Select the source for MFI calculation (default: "hlc3"). Options include "close", "open", "high", "low", "hl2", "hlc3", "ohlc4".
Bollinger Bands:
Length: Period for Bollinger Bands calculation (default: 20).
Multiplier: Standard deviation multiplier for the bands (default: 2.0).
Source: Choose which SRSI-MFI value to use for Bollinger Bands ("averageHybrid", "hybrid_higher", "hybrid_current", "hybrid_lower"; default: "hybrid_higher").
Weights:
Auto Weight Enabled: Enable/disable automatic weights based on Bitcoin volatility (default: true).
Higher/Current/Lower Weights: Manually set weights for each timeframe if auto-weight is disabled (defaults: 1.5, 1.0, 0.5).
Indicator On/Off:
Toggle visibility for Higher SRSI-MFI, Current SRSI-MFI, Lower SRSI-MFI, Average SRSI-MFI, and Bollinger Bands.
How It Works
SRSI-MFI Calculation:
Stochastic RSI (SRSI) and Money Flow Index (MFI) are calculated for three timeframes: higher, current, and lower.
The hybrid value (SRSI * (MFI / 100)) is computed for each timeframe.
Weighted Average:
The hybrid values are combined into a weighted average (averageHybrid) using dynamic or manual weights.
Bollinger Bands:
Bollinger Bands are applied to the selected source (e.g., hybrid_higher) to identify trend direction and volatility.
Relative Position:
The position of averageHybrid within the Bollinger Bands is scaled to a percentage (0% to 100%) for strength assessment.
Visualization:
Plots individual SRSI-MFI lines, Bollinger Bands, and overbought/oversold levels.
A real-time info panel provides market state and signal strength.
Notes
This indicator is best used as part of a broader trading strategy. It is not a standalone signal generator and should be combined with other forms of analysis.
The automatic weights are optimized for Bitcoin (BTC) volatility. For other assets, you may need to adjust the weights manually.
The indicator may require sufficient historical data to calculate higher and lower timeframe values accurately.

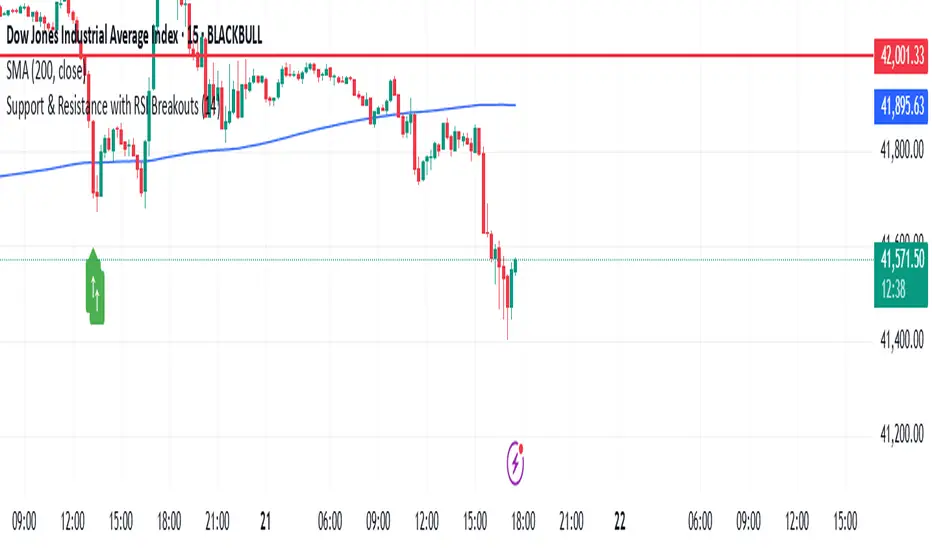
Support & Resistance with RSI BreakoutsThe script is a TradingView Pine Script (v5) indicator that identifies support and resistance levels using RSI (Relative Strength Index) breakouts. Here’s a breakdown of what it does:
Features:
RSI Calculation:
The script calculates the 14-period RSI (default) using the closing price.
The user can modify the RSI period through an input setting.
Buy and Sell Signals:
A buy signal is triggered when RSI drops below 20 (indicating oversold conditions).
A sell signal is triggered when RSI rises above 80 (indicating overbought conditions).
Visual Representation:
Buy signals are marked with a green upward arrow (↑) below the price bars.
Sell signals are marked with a red downward arrow (↓) above the price bars.
The arrows help traders easily spot potential trade opportunities.
Usage:
This script is useful for traders looking to buy at oversold conditions and sell at overbought conditions based on RSI.
It works best when combined with other indicators or price action strategies to confirm signals.
RSI with Trend LinesThe RSI with Trend Lines indicator is a tool designed to analyze the behavior of the Relative Strength Index (RSI) combined with dynamic trend lines. This indicator not only provides the standard RSI reading but also identifies pivot points on the RSI and draws bullish and bearish trend lines based on these points. It also includes customizable options for adjusting trend lines, displaying the RSI moving average, and highlighting key levels such as overbought, oversold, and the center line.
This indicator is ideal for finding and identifying clear trends in the RSI and taking advantage of market breakout or consolidation signals. It also includes a table with the POC value, which represents the price level at which the most trading activity has occurred, indicating the highest liquidity and highest trading volume.
Key Features:
1. Basic RSI:
• Calculates the RSI using a configurable period length (default 14).
• Colors the RSI based on its direction (green for rising, red for falling) and its position relative to the center line (50).
2. Key Levels:
• Displays overbought (70 and 80), oversold (20 and 30), and the center line (50) levels for easy visual interpretation.
3. RSI Moving Average:
• Enables and configures an RSI moving average (SMA, EMA, WMA, or ALMA) to smooth out fluctuations and detect clearer trends.
4. Dynamic Trend Lines:
• Identifies pivot points on the RSI and draws bullish and bearish trend lines.
• Trend lines can be extended into the future or limited to the visible range.
• Includes options to display broken lines (trends that are no longer valid) and customize the style (solid or dashed).
5. Pivot Points:
• Displays the high and low pivot points on the chart for a better understanding of trend changes.
6. Advanced Customization:
• Adjust the pivot point period.
• Control the number of pivot points to consider for trend lines.
• Customize the line thickness and style.
How to Use the Indicator:
1. RSI Interpretation:
• Overbought Zone (RSI > 70): Indicates that the asset may be overvalued and could correct downward.
• Oversold Zone (RSI < 30): Suggests that the asset may be undervalued and could rebound.
• Centerline Crossover (50): A cross above 50 indicates bullish strength, while a cross below suggests weakness.
2. Trend Lines:
• Bullish Lines: Drawn when the RSI forms ascending low pivot points. These lines represent dynamic support.
• Bearish Lines: These are drawn when the RSI forms descending high pivot points. These lines represent dynamic resistance.
• Broken Lines: When a trend line becomes invalid (the RSI breaks the line), they are displayed in a dotted style to highlight the breakout.
3. Possible Trading Signals:
• Buy: When the RSI breaks an upward downtrend line.
• Sell: When the RSI breaks a downward uptrend line.
• Trend Confirmation: When the RSI stays within a valid trend line, it suggests that the current trend is strong.
4. A chart with the POC value:
• The point of control is a price level at which the highest trading volume occurs in a given time period. It is a key component of the Volume Profile indicator, which displays volume by price.
• Use of the POC in trading:
• The POC is used to identify areas of high interest and liquidity for trading.
• The POC provides information about the equilibrium point where buyers and sellers are most evenly matched.
• Therefore, it can be considered a zone of interest, meaning it can act as support or resistance.

iD EMARSI on ChartSCRIPT OVERVIEW
The EMARSI indicator is an advanced technical analysis tool that maps RSI values directly onto price charts. With adaptive scaling capabilities, it provides a unique visualization of momentum that flows naturally with price action, making it particularly valuable for FOREX and low-priced securities trading.
KEY FEATURES
1 PRICE MAPPED RSI VISUALIZATION
Unlike traditional RSI that displays in a separate window, EMARSI plots the RSI directly on the price chart, creating a flowing line that identifies momentum shifts within the context of price action:
// Map RSI to price chart with better scaling
mappedRsi = useAdaptiveScaling ?
median + ((rsi - 50) / 50 * (pQH - pQL) / 2 * math.min(1.0, 1/scalingFactor)) :
down == pQL ? pQH : up == pQL ? pQL : median - (median / (1 + up / down))
2 ADAPTIVE SCALING SYSTEM
The script features an intelligent scaling system that automatically adjusts to different market conditions and price levels:
// Calculate adaptive scaling factor based on selected method
scalingFactor = if scalingMethod == "ATR-Based"
math.min(maxScalingFactor, math.max(1.0, minTickSize / (atrValue/avgPrice)))
else if scalingMethod == "Price-Based"
math.min(maxScalingFactor, math.max(1.0, math.sqrt(100 / math.max(avgPrice, 0.01))))
else // Volume-Based
math.min(maxScalingFactor, math.max(1.0, math.sqrt(1000000 / math.max(volume, 100))))
3 MODIFIED RSI CALCULATION
EMARSI uses a specially formulated RSI calculation that works with an adaptive base value to maintain consistency across different price ranges:
// Adaptive RSI Base based on price levels to improve flow
adaptiveRsiBase = useAdaptiveScaling ? rsiBase * scalingFactor : rsiBase
// Calculate RSI components with adaptivity
up = ta.rma(math.max(ta.change(rsiSourceInput), adaptiveRsiBase), emaSlowLength)
down = ta.rma(-math.min(ta.change(rsiSourceInput), adaptiveRsiBase), rsiLengthInput)
// Improved RSI calculation with value constraint
rsi = down == 0 ? 100 : up == 0 ? 0 : 100 - (100 / (1 + up / down))
4 MOVING AVERAGE CROSSOVER SYSTEM
The indicator creates a smooth moving average of the RSI line, enabling a crossover system that generates trading signals:
// Calculate MA of mapped RSI
rsiMA = ma(mappedRsi, emaSlowLength, maTypeInput)
// Strategy entries
if ta.crossover(mappedRsi, rsiMA)
strategy.entry("RSI Long", strategy.long)
if ta.crossunder(mappedRsi, rsiMA)
strategy.entry("RSI Short", strategy.short)
5 VISUAL REFERENCE FRAMEWORK
The script includes visual guides that help interpret the RSI movement within the context of recent price action:
// Calculate pivot high and low
pQH = ta.highest(high, hlLen)
pQL = ta.lowest(low, hlLen)
median = (pQH + pQL) / 2
// Plotting
plot(pQH, "Pivot High", color=color.rgb(82, 228, 102, 90))
plot(pQL, "Pivot Low", color=color.rgb(231, 65, 65, 90))
med = plot(median, style=plot.style_steplinebr, linewidth=1, color=color.rgb(238, 101, 59, 90))
6 DYNAMIC COLOR SYSTEM
The indicator uses color fills to clearly visualize the relationship between the RSI and its moving average:
// Color fills based on RSI vs MA
colUp = mappedRsi > rsiMA ? input.color(color.rgb(128, 255, 0), '', group= 'RSI > EMA', inline= 'up') :
input.color(color.rgb(240, 9, 9, 95), '', group= 'RSI < EMA', inline= 'dn')
colDn = mappedRsi > rsiMA ? input.color(color.rgb(0, 230, 35, 95), '', group= 'RSI > EMA', inline= 'up') :
input.color(color.rgb(255, 47, 0), '', group= 'RSI < EMA', inline= 'dn')
fill(rsiPlot, emarsi, mappedRsi > rsiMA ? pQH : rsiMA, mappedRsi > rsiMA ? rsiMA : pQL, colUp, colDn)
7 REAL TIME PARAMETER MONITORING
A transparent information panel provides real-time feedback on the adaptive parameters being applied:
// Information display
var table infoPanel = table.new(position.top_right, 2, 3, bgcolor=color.rgb(0, 0, 0, 80))
if barstate.islast
table.cell(infoPanel, 0, 0, "Current Scaling Factor", text_color=color.white)
table.cell(infoPanel, 1, 0, str.tostring(scalingFactor, "#.###"), text_color=color.white)
table.cell(infoPanel, 0, 1, "Adaptive RSI Base", text_color=color.white)
table.cell(infoPanel, 1, 1, str.tostring(adaptiveRsiBase, "#.####"), text_color=color.white)
BENEFITS FOR TRADERS
INTUITIVE MOMENTUM VISUALIZATION
By mapping RSI directly onto the price chart, traders can immediately see the relationship between momentum and price without switching between different indicator windows.
ADAPTIVE TO ANY MARKET CONDITION
The three scaling methods (ATR-Based, Price-Based, and Volume-Based) ensure the indicator performs consistently across different market conditions, volatility regimes, and price levels.
PREVENTS EXTREME VALUES
The adaptive scaling system prevents the RSI from generating extreme values that exceed chart boundaries when trading low-priced securities or during high volatility periods.
CLEAR TRADING SIGNALS
The RSI and moving average crossover system provides clear entry signals that are visually reinforced through color changes, making it easy to identify potential trading opportunities.
SUITABLE FOR MULTIPLE TIMEFRAMES
The indicator works effectively across multiple timeframes, from intraday to daily charts, making it versatile for different trading styles and strategies.
TRANSPARENT PARAMETER ADJUSTMENT
The information panel provides real-time feedback on how the adaptive system is adjusting to current market conditions, helping traders understand why the indicator is behaving as it is.
CUSTOMIZABLE VISUALIZATION
Multiple visualization options including Bollinger Bands, different moving average types, and customizable colors allow traders to adapt the indicator to their personal preferences.
CONCLUSION
The EMARSI indicator represents a significant advancement in RSI visualization by directly mapping momentum onto price charts with adaptive scaling. This approach makes momentum shifts more intuitive to identify and helps prevent the scaling issues that commonly affect RSI-based indicators when applied to low-priced securities or volatile markets.

BBr1 Candle Range Volitility Gap IndicatorModified Candle Range Volatility Gap Indicator
1. Useful to analyze bars body and wicks and volatility of security.
2. Added a Percentage Option - easier to analyze across different securities.
2. Added a Standard Deviation ("1 std dev= 68.2%, 2 std dev=95.4%, 3 std dev=99.7%, etc") based upon user defined lookback period.
3. Added the ability to include Gaps in Analysis. (Gaps are when the prior closing cost does not equal opening price)
4. Possible Uses setting up stop losses, trailing entries/exits (inside range or outside range).
5. Use it with other indicators in determining if to make an entry or close entry.
Reposted Original Description by © ka66 Kamal Advani
Visually shows the Body Range (open to close) and Candle Range (high to low).
Semi-transparent overlapping area is the full Candle Range, and fully-opaque smaller area is the Body Range. For aesthetics and visual consistency, Candle Range follows the direction of the Body Range, even though technically it's always positive (high - low).
The different plots for each range type also means the UI will allow deselecting one or the other as needed. For example, some strategies may care only about the Body Range, rather than the entire Candle Range, so the latter can be hidden to reduce noise.
Threshold horizontal lines are plotted, so the trader can modify these high and low levels as needed through the user interface. These need to be configured to match the instrument's price range levels for the timeframe. The defaults are pretty arbitrary for +/- 0.0080 (80 pips in a 4-decimal place forex pair). Where a range reaches or exceeds a threshold, it's visually marked as well with a shape at the Body or Candle peak, to assist with quicker visual potential setup scanning, for example, to anticipate a following reversal or continuation.

Pso Volume Profile # Volume Profile with Dynamic Support and Resistance
## Overview
This Pine Script indicator for TradingView creates a comprehensive volume profile display with automatic support and resistance levels based on significant volume nodes. The indicator analyzes price action and volume data to identify key levels where trading activity has been concentrated, helping traders identify potential reversal or continuation zones.
## Key Features
### Volume Profile Analysis
- Displays a horizontal volume profile on the right side of the chart
- Divides volume into bid (buying) and ask (selling) components
- Color-codes bid and ask volumes differently for easy identification
- Customizable profile width, opacity, and placement
### Dynamic Support and Resistance Detection
- Automatically identifies significant price levels based on volume concentration
- Uses an adjustable percentile threshold to filter for the most important levels
- Color-codes support/resistance lines based on bid/ask dominance:
- Red lines: Bid-dominant levels (more buying pressure)
- Green lines: Ask-dominant levels (more selling pressure)
- Extends lines across the chart for clear visualization
### Customization Options
- Adjustable lookback period for volume analysis
- Configurable number of price divisions (bars)
- User-selectable volume percentile threshold (50-100%)
- Customizable colors for all elements
- Adjustable line length and position
## How It Works
1. The indicator divides the price range into a specified number of horizontal zones
2. It analyzes historical price and volume data within the lookback period
3. For each price zone, it calculates the total volume and separates bid/ask components
4. It identifies zones with volume exceeding the user-defined percentile threshold
5. It draws color-coded horizontal lines at these significant levels, extending across the chart
6. Lines are colored based on whether buying or selling was dominant at each level
## Usage Guidelines
- Higher percentile values (80-95%) will show fewer, but more significant levels
- Lower values (50-70%) will show more potential support/resistance zones
- Red lines often represent potential support levels (buyer-dominated)
- Green lines often represent potential resistance levels (seller-dominated)
- Areas where multiple lines cluster indicate highly significant zones
## Applications
- Identifying key price levels for entry and exit points
- Recognizing potential reversal zones
- Setting strategic stop-loss and take-profit levels
- Confirming support/resistance levels from other technical analysis methods
- Understanding the volume distribution and market structure
This indicator combines volume profile analysis with automatic support/resistance detection, providing traders with a powerful tool to identify significant price levels based on actual trading activity rather than just price patterns.

[COG]TMS Crossfire 🔍 TMS Crossfire: Guide to Parameters
📊 Core Parameters
🔸 Stochastic Settings (K, D, Period)
- **What it does**: These control how the first stochastic oscillator works. Think of it as measuring momentum speed.
- **K**: Determines how smooth the main stochastic line is. Lower values (1-3) react quickly, higher values (3-9) are smoother.
- **D**: Controls the smoothness of the signal line. Usually kept equal to or slightly higher than K.
- **Period**: How many candles are used to calculate the stochastic. Standard is 14 days, lower for faster signals.
- **For beginners**: Start with the defaults (K:3, D:3, Period:14) until you understand how they work.
🔸 Second Stochastic (K2, D2, Period2)
- **What it does**: Creates a second, independent stochastic for stronger confirmation.
- **How to use**: Can be set identical to the first one, or with slightly different values for dual confirmation.
- **For beginners**: Start with the same values as the first stochastic, then experiment.
🔸 RSI Length
- **What it does**: Controls the period for the RSI calculation, which measures buying/selling pressure.
- **Lower values** (7-9): More sensitive, good for short-term trading
- **Higher values** (14-21): More stable, better for swing trading
- **For beginners**: The default of 11 is a good balance between speed and reliability.
🔸 Cross Level
- **What it does**: The centerline where crosses generate signals (default is 50).
- **Traditional levels**: Stochastics typically use 20/80, but 50 works well for this combined indicator.
- **For beginners**: Keep at 50 to focus on trend following strategies.
🔸 Source
- **What it does**: Determines which price data is used for calculations.
- **Common options**:
- Close: Most common and reliable
- Open: Less common
- High/Low: Used for specialized indicators
- **For beginners**: Stick with "close" as it's most commonly used and reliable.
🎨 Visual Theme Settings
🔸 Bullish/Bearish Main
- **What it does**: Sets the overall color scheme for bullish (up) and bearish (down) movements.
- **For beginners**: Green for bullish and red for bearish is intuitive, but choose any colors that are easy for you to distinguish.
🔸 Bullish/Bearish Entry
- **What it does**: Colors for the entry signals shown directly on the chart.
- **For beginners**: Use bright, attention-grabbing colors that stand out from your chart background.
🌈 Line Colors
🔸 K1, K2, RSI (Bullish/Bearish)
- **What it does**: Controls the colors of each indicator line based on market direction.
- **For beginners**: Use different colors for each line so you can quickly identify which line is which.
⏱️ HTF (Higher Timeframe) Settings
🔸 HTF Timeframe
- **What it does**: Sets which higher timeframe to use for filtering (e.g., 240 = 4 hour chart).
- **How to choose**: Should be at least 4x your current chart timeframe (e.g., if trading on 15min, use 60min or higher).
- **For beginners**: Start with a timeframe 4x higher than your trading chart.
🔸 Use HTF Filter
- **What it does**: Toggles whether the higher timeframe filter is applied or not.
- **For beginners**: Keep enabled to reduce false signals, especially when learning.
🔸 HTF Confirmation Bars
- **What it does**: How many bars must confirm a trend change on higher timeframe.
- **Higher values**: More reliable but slower to react
- **Lower values**: Faster signals but more false positives
- **For beginners**: Start with 2-3 bars for a good balance.
📈 EMA Settings
🔸 Use EMA Filter
- **What it does**: Toggles price filtering with an Exponential Moving Average.
- **For beginners**: Keep enabled for better trend confirmation.
🔸 EMA Period
- **What it does**: Length of the EMA for filtering (shorter = faster reactions).
- **Common values**:
- 5-13: Short-term trends
- 21-50: Medium-term trends
- 100-200: Long-term trends
- **For beginners**: 5-10 is good for short-term trading, 21 for swing trading.
🔸 EMA Offset
- **What it does**: Shifts the EMA forward or backward on the chart.
- **For beginners**: Start with 0 and adjust only if needed for visual clarity.
🔸 Show EMA on Chart
- **What it does**: Toggles whether the EMA appears on your main price chart.
- **For beginners**: Keep enabled to see how price relates to the EMA.
🔸 EMA Color, Style, Width, Transparency
- **What it does**: Customizes how the EMA line looks on your chart.
- **For beginners**: Choose settings that make the EMA visible but not distracting.
🌊 Trend Filter Settings
🔸 Use EMA Trend Filter
- **What it does**: Enables a multi-EMA system that defines the overall market trend.
- **For beginners**: Keep enabled for stronger trend confirmation.
🔸 Show Trend EMAs
- **What it does**: Toggles visibility of the trend EMAs on your chart.
- **For beginners**: Enable to see how price moves relative to multiple EMAs.
🔸 EMA Line Thickness
- **What it does**: Controls how the thickness of EMA lines is determined.
- **Options**:
- Uniform: All EMAs have the same thickness
- Variable: Each EMA has its own custom thickness
- Hierarchical: Automatically sized based on period (longer periods = thicker)
- **For beginners**: "Hierarchical" is most intuitive as longer-term EMAs appear more dominant.
🔸 EMA Line Style
- **What it does**: Sets the line style (solid, dotted, dashed) for all EMAs.
- **For beginners**: "Solid" is usually clearest unless you have many lines overlapping.
🎭 Trend Filter Colors/Width
🔸 EMA Colors (8, 21, 34, 55)
- **What it does**: Sets the color for each individual trend EMA.
- **For beginners**: Use a logical progression (e.g., shorter EMAs brighter, longer EMAs darker).
🔸 EMA Width Settings
- **What it does**: Controls the thickness of each EMA line.
- **For beginners**: Thicker lines for longer EMAs make them easier to distinguish.
🔔 How These Parameters Work Together
The power of this indicator comes from how these components interact:
1. **Base Oscillator**: The stochastic and RSI components create the main oscillator
2. **HTF Filter**: The higher timeframe filter prevents trading against larger trends
3. **EMA Filter**: The EMA filter confirms signals with price action
4. **Trend System**: The multi-EMA system identifies the overall market environment
Think of it as multiple layers of confirmation, each adding more reliability to your trading signals.
💡 Tips for Beginners
1. **Start with defaults**: Use the default settings first and understand what each element does
2. **One change at a time**: When customizing, change only one parameter at a time
3. **Keep notes**: Write down how each change affects your results
4. **Backtest thoroughly**: Test any changes on historical data before trading real money
5. **Less is more**: Sometimes simpler settings work better than complicated ones
Remember, no indicator is perfect - always combine this with proper risk management and other forms of analysis!

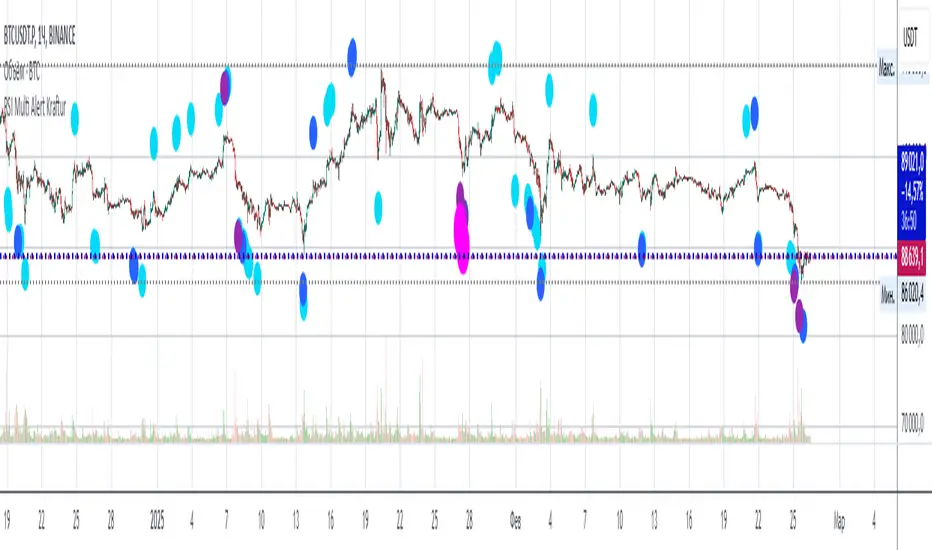
RSI Multi Alert KrafturRSI Multi Alert Kraftur
Description
The "RSI Multi-Level Signals" indicator is designed to help traders identify potential buy and sell opportunities based on RSI (Relative Strength Index) crossings of multiple customizable levels. Unlike traditional RSI indicators that focus on single overbought/oversold thresholds (e.g., 70/30), this script stands out by offering four distinct buy and sell levels for enhanced flexibility and precision. It plots signals directly on the price chart and provides real-time alerts when RSI crosses these levels, making it a powerful tool for spotting entry and exit points.
Key Features
Multi-Level RSI: Configurable buy levels (e.g., 30, 25, 20, 15) and sell levels (e.g., 70, 75, 80, 85) to capture varying degrees of overbought and oversold conditions.
Visual Signals: Buy signals are marked with circles below the bars, and sell signals above the bars, each color-coded for easy identification.
Real-Time Alerts: Generates alerts once per bar when RSI crosses a level, with a filter to prevent duplicate signals during oscillations.
Customizable: Adjustable RSI length, timeframe, and level colors to suit different trading strategies.
Recommended Usage
This indicator is best used as a scanning tool for finding entry points across multiple assets. Set up alerts for your entire watchlist of coins or stocks to detect when RSI crosses the configured levels in real time. It’s particularly effective in volatile markets or for traders employing multi-timeframe analysis. Combine it with other indicators (e.g., support/resistance or trend filters) to confirm signals and improve accuracy.
How to Use
Apply the indicator to your chart.
Customize the RSI length, timeframe, and signal levels to match your trading style.
Set up alerts for the indicator and apply them to your watchlist of assets.
Monitor the chart for buy (green) and sell (red) signals, or rely on alert notifications.
Perfect for scalpers, swing traders, or anyone looking to automate signal detection across a portfolio!
Intrabar Volume Distribution [BigBeluga]Intrabar Volume Distribution is an advanced volume and order flow indicator that visualizes the buy and sell volume distribution within each candlestick.
🔔 Before Use:
Turn off the background color of your candles for clear visibility.
Overlay the indicator on the top layout to ensure accurate alignment with the price chart.
🔵 Key Features:
Inside Bar Volume Visualization:
Each candlestick is divided into two columns:
Left column displays the sell % volume amount.
Right column displays the buy % volume amount.
Provides a clear representation of buyer-seller activity within individual bars.
Percentage Volume Labels:
Labels above each bar show the percentage share of sell and buy volume relative to the total (100%).
Quickly assess market sentiment and volume imbalances.
Point of Control (POC) Levels:
Orange dashed lines mark the POC inside each bar, indicating the price level with the highest traded volume.
Helps identify key liquidity zones within individual candlesticks.
Multi-Timeframe Volume Analysis:
The indicator automatically uses a timeframe 20-30 times lower than the current one to gather detailed volume data.
For each higher timeframe candle, it collects 20-30 bars of lower timeframe data for precise volume mapping.
Each bar is divided into 100 volume bins to capture detailed volume distribution across the price range.
Bins are filled based on the aggregated volume from the lower timeframe data.
Lookback Period:
Allows traders to select how many bars to display with delta and volume information.
The beginning of the selected lookback period is marked with a gray line and label for quick reference.
Indicator displays up to 80 bars back
🔵 Usage:
Order Flow Analysis: Monitor buy/sell volume distribution to spot potential reversals or continuations.
Liquidity Identification: Use POC levels to locate areas of strong market interest and potential support/resistance.
Volume Imbalance Detection: Pay attention to percentage labels for quick recognition of buyer or seller dominance.
Scalping & Intraday Trading: Ideal for traders seeking real-time insight into order flow and volume behavior.
Historical Analysis: Adjust the lookback period to analyze past price action and volume activity.
Intrabar Volume Distribution is a powerful tool for traders aiming to gain deeper insight into market sentiment through detailed volume analysis, allowing for more informed trading decisions based on real-time order flow dynamics.

Multi Asset & TF Stochastic
Multi Asset & TF Stochastic
This indicator allows you to compare the stochastic oscillator values of two different assets across multiple timeframes in a single pane. It’s designed for traders who want to analyse the momentum of one asset (by default, the chart’s asset) alongside a second asset of your choice (e.g., comparing EURUSD to the USD Index).
How It Works:
Main Asset:
The indicator automatically uses the chart’s asset for the primary stochastic calculation. You have the option to adjust the timeframe for this asset using a dropdown that includes TradingView’s standard timeframes, a "Chart" option (which automatically uses your chart’s timeframe), or a "Custom" option where you can type in any timeframe.
Second Asset:
You can enable the display of a second asset by toggling the “Display Second Asset” option. Choose the asset symbol (default is “DXY”) and select its timeframe from an identical dropdown. When enabled, the script calculates the stochastic oscillator for the second asset, allowing you to compare its momentum (%K and %D lines) with that of the main asset.
Stochastic Oscillator Settings:
Customize the %K length, the smoothing period for %K, and the smoothing period for %D. Both assets’ stochastic values are calculated using these parameters.
Visual Display:
The indicator plots the %K and %D lines for the main asset in prominent colours. If the second asset is enabled, its %K and %D lines are also plotted in different colours. Additionally, overbought (80) and oversold (20) levels are marked, with a midline at 50, making it easier to gauge market conditions at a glance.
%D line can be toggled off for a cleaner view if required:
Asset Information Table:
A table at the top-centre of the pane displays the active asset symbols—ensuring you always know which assets are being analysed.
How to Use:
Apply the Indicator:
Add the script to your chart. By default, it will use the chart’s current asset and timeframe for the primary stochastic oscillator.
Adjust the Main Asset Settings:
Use the “Main Asset Timeframe” dropdown to select a specific timeframe for the main asset or stick with the “Chart” option for automatic syncing with your current chart.
Enable and Configure the Second Asset (Optional):
Toggle on “Display Second Asset” if you wish to compare another asset. Select the desired symbol and adjust its timeframe using the provided dropdown. Choose “Custom” if you need a timeframe not listed by default.
Review the Plots and Table:
Observe the stochastic %K and %D lines for each asset. The overbought/oversold levels help indicate potential market turning points. Check the table at the top-centre to confirm the asset symbols being displayed.
This versatile tool is ideal for traders who rely on momentum analysis and need to quickly compare the stochastic signals of different markets or instruments. Enjoy seamless multi-asset analysis with complete control over your timeframe settings!

Multi-Indicator Signals with Selectable Options by DiGetMulti-Indicator Signals with Selectable Options
Script Overview
This Pine Script is a multi-indicator trading strategy designed to generate buy/sell signals based on combinations of popular technical indicators: RSI (Relative Strength Index) , CCI (Commodity Channel Index) , and Stochastic Oscillator . The script allows you to select which combination of signals to display, making it highly customizable and adaptable to different trading styles.
The primary goal of this script is to provide clear and actionable entry/exit points by visualizing buy/sell signals with arrows , labels , and vertical lines directly on the chart. It also includes input validation, dynamic signal plotting, and clutter-free line management to ensure a clean and professional user experience.
Key Features
1. Customizable Signal Types
You can choose from five signal types:
RSI & CCI : Combines RSI and CCI signals for confirmation.
RSI & Stochastic : Combines RSI and Stochastic signals.
CCI & Stochastic : Combines CCI and Stochastic signals.
RSI & CCI & Stochastic : Requires all three indicators to align for a signal.
All Signals : Displays individual signals from each indicator separately.
This flexibility allows you to test and use the combination that works best for your trading strategy.
2. Clear Buy/Sell Indicators
Arrows : Buy signals are marked with upward arrows (green/lime/yellow) below the candles, while sell signals are marked with downward arrows (red/fuchsia/gray) above the candles.
Labels : Each signal is accompanied by a label ("BUY" or "SELL") near the arrow for clarity.
Vertical Lines : A vertical line is drawn at the exact bar where the signal occurs, extending from the low to the high of the candle. This ensures you can pinpoint the exact entry point without ambiguity.
3. Dynamic Overbought/Oversold Levels
You can customize the overbought and oversold levels for each indicator:
RSI: Default values are 70 (overbought) and 30 (oversold).
CCI: Default values are +100 (overbought) and -100 (oversold).
Stochastic: Default values are 80 (overbought) and 20 (oversold).
These levels can be adjusted to suit your trading preferences or market conditions.
4. Input Validation
The script includes built-in validation to ensure that oversold levels are always lower than overbought levels for each indicator. If the inputs are invalid, an error message will appear, preventing incorrect configurations.
5. Clean Chart Design
To avoid clutter, the script dynamically manages vertical lines:
Only the most recent 50 buy/sell lines are displayed. Older lines are automatically deleted to keep the chart clean.
Labels and arrows are placed strategically to avoid overlapping with candles.
6. ATR-Based Offset
The vertical lines and labels are offset using the Average True Range (ATR) to ensure they don’t overlap with the price action. This makes the signals easier to see, especially during volatile market conditions.
7. Scalable and Professional
The script uses arrays to manage multiple vertical lines, ensuring scalability and performance even when many signals are generated.
It adheres to Pine Script v6 standards, ensuring compatibility and reliability.
How It Works
Indicator Calculations :
The script calculates the values of RSI, CCI, and Stochastic Oscillator based on user-defined lengths and smoothing parameters.
It then checks for crossover/crossunder conditions relative to the overbought/oversold levels to generate individual signals.
Combined Signals :
Depending on the selected signal type, the script combines the individual signals logically:
For example, a "RSI & CCI" buy signal requires both RSI and CCI to cross into their respective oversold zones simultaneously.
Signal Plotting :
When a signal is generated, the script:
Plots an arrow (upward for buy, downward for sell) at the corresponding bar.
Adds a label ("BUY" or "SELL") near the arrow for clarity.
Draws a vertical line extending from the low to the high of the candle to mark the exact entry point.
Line Management :
To prevent clutter, the script stores up to 50 vertical lines in arrays (buy_lines and sell_lines). Older lines are automatically deleted when the limit is exceeded.
Why Use This Script?
Versatility : Whether you're a scalper, swing trader, or long-term investor, this script can be tailored to your needs by selecting the appropriate signal type and adjusting the indicator parameters.
Clarity : The combination of arrows, labels, and vertical lines ensures that signals are easy to spot and interpret, even in fast-moving markets.
Customization : With adjustable overbought/oversold levels and multiple signal options, you can fine-tune the script to match your trading strategy.
Professional Design : The script avoids clutter by limiting the number of lines displayed and using ATR-based offsets for better visibility.
How to Use This Script
Add the Script to Your Chart :
Copy and paste the script into the Pine Editor in TradingView.
Save and add it to your chart.
Select Signal Type :
Use the "Signal Type" dropdown menu to choose the combination of indicators you want to use.
Adjust Parameters :
Customize the lengths of RSI, CCI, and Stochastic, as well as their overbought/oversold levels, to match your trading preferences.
Interpret Signals :
Look for green arrows and "BUY" labels for buy signals, and red arrows and "SELL" labels for sell signals.
Vertical lines will help you identify the exact bar where the signal occurred.
Tips for Traders
Backtest Thoroughly : Before using this script in live trading, backtest it on historical data to ensure it aligns with your strategy.
Combine with Other Tools : While this script provides reliable signals, consider combining it with other tools like support/resistance levels or volume analysis for additional confirmation.
Avoid Overloading the Chart : If you notice too many signals, try tightening the overbought/oversold levels or switching to a combined signal type (e.g., "RSI & CCI & Stochastic") for fewer but higher-confidence signals.
