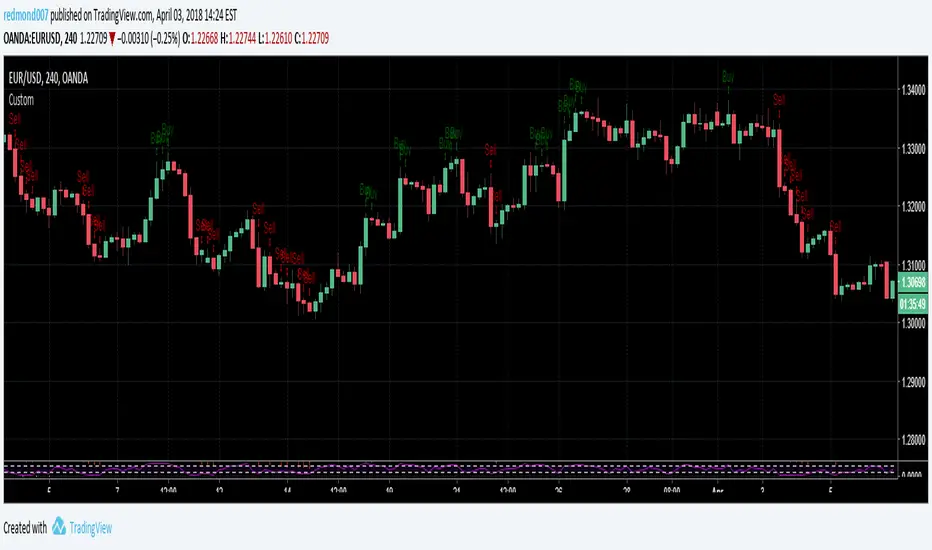
RSI buy/sell partitionsLook overbought and overbought to predict the time of the transaction.
RSI overbought:
- RSI = 21 to 30 (default configuration): The graph showing the letters 'Buy' and candles will have different colors.
- RSI < 21 (default configuration): The graph showing the letters 'Buy' displays bold and the candles will have high light background colors.
RSI oversold:
- RSI = 70 to 79 (default configuration): The chart that shows the word 'sell' and the candlestick will have different colors.
- RSI > 80 (default configuration): Display chart for 'Sell' displays bold and candles will have high light background colors.
在脚本中搜索"股价在8元左右净利润为正市值小于80亿的热门股票有哪些"

SMART RSISimilar to RSI in concept, but with a few enhancements!
Improvements over the standard RSI indicator?
1. Adaptive Decision Boundaries:
Who says 70-30 are the best decision boundaries to use for trading off of the RSI indicator? Why not 80-20, or another combination? Is 70-30 still the best when you shorten or lengthen the RSI indicator's look-back window? What about when you change the time frame? I wondered this for a while too, and thats what inspired me to create this indicator! Instead of using fixed lines for the boundaries, the boundaries are calculated based off of a user specified percentile. What this means is that the reference lines are calculated by looking at the values the RSI indicator took over some look back window, and calculating an upper and lower bound where the RSI actually stayed n% of the time over that look-back window. The default parameter given for this argument is 90. What that means is over the last n days, the RSI indicator spent 90% of it's time between the upper and lower bound.
2. Smoothing The RSI Indicator:
The RSI indicator on smaller time windows tends to be very noisy. However a simple linear regression over a short time period on the RSI indicator helps to cancel out this noise without losing too much information. This makes cross-overs more meaningful as they are less likely to happen due to small deviations. In addition, it also paints a smoothed picture of the price momentum that is easy and pleasant to read. The reference lines are also smoothed.
3. Color Coding Crosses When They Happen!
Wouldn't it be great if your software highlights cross overs when they happen for you so you would not have to go back over your chart and identify it for yourself? Well this software does! It paints red behind the indicator when the RSI indicator goes above the upper reference line, and paints blue when the RSI goes below the lower reference line.
The default parameters were selected based on what I feel is useful for daily candles on BTCUSD. However you are free to change the parameters as you see fit for different securities and time frames.

Simple profitable trading strategyThis strategy has three components.
Philakones EMAs are a sequence of five fibonacci EMAs. They range from 55 candles (green) to 8 candles (red) in length. A strong trend or breakout is marked by the emas appearing in sequence of their length from 8 to 55 or vice versa. These EMAs are also used to signal an exit. Only two EMAs are used for exit signals - when the 13 EMA crosses over/under the 55 EMA.
RSI gives a bullish signal when 40 > rsi > 70. Exit signals are oversold (30) or overbought (70)
Stochastics give a bullish signal when stoch < 80 and an exit signal when > 95.
Results include 3 ticks of slippage and taker fees of .002. Provides a pretty smooth equity curve with a 73% win rate and beats buy and hold by than 10x (returns about 60x overall) since start of 2017.

Double Stochastic Multi-TimeframeI personalized a double stochastic oscillator.
HOW IS IT USED ?
Everyone should adapt the parameters to its way of trading.
First you must have a confirmation of the trend.
In positive trend, a double stochastic > 20 can be used t enter long.
In negative trend, a double stochastic < 80 can be used t enter long.
Of course this is only one possibility that everyone should adapt.
I added the possibility to add on the chart a 2nd timeframe for confirmation.
If you found this script useful, a tip is always welcome... :)

RSI MACD EMA Stoch Custom IndicatorCopyright by RJ 3/2018
Buy when:
RSI period 3 greater than 50, Difference between MACD and MACD signal line is greater than 0 and also greater than that of previous candle,
Stochastic %D line is less than 80 and greater than that of previous candle, Closing price greater than EMA period 100.
Sell when:
RSI period 3 less than 50, Difference between MACD and MACD signal line is less than 0 and also less than that of
previous candle, Stochastic %D line is greater than 20 and less than that of previous candle, Closing price less than EMA
period 100.
Noro's Triple RSI Top/Bottom v1.1In 1.1 added:
+ Leverage-parameter
+ Indicators-parameter
Strategy
It is the indicator. Threefold RSI . 3 different RSI indicators are used:
1) The RSI indicator with the period 2
2) The RSI indicator with the period 7
3) The RSI indicator with the period 14
If at the same time RSI-2 < 10 and RSI-7 < 20 and RSI-14 < 30 = a bottom
If at the same time RSI-2 > 90 and RSI-7 > 80 and RSI-14 > 70 = a top
Parameter accuracy influences.
Strategy allows to measure indicator accuracy. To check whether this indicator is suitable for this pair and a timeframe, how exact.

Noro's Triple RSI Top/BottomIt is the indicator. Threefold RSI. 3 different RSI indicators are used:
1) The RSI indicator with the period 2
2) The RSI indicator with the period 7
3) The RSI indicator with the period 14
If at the same time RSI-2 < 10 and RSI-7 < 20 and RSI-14 < 30 = a bottom
If at the same time RSI-2 > 90 and RSI-7 > 80 and RSI-14 > 70 = a top
Parameter accuracy influences.
Strategy allows to measure indicator accuracy. To check whether this indicator is suitable for this pair and a timeframe, how exact.

XPloRR MA-Trailing-Stop StrategyXPloRR MA-Trailing-Stop Strategy
Long term MA-Trailing-Stop strategy with Adjustable Signal Strength to beat Buy&Hold strategy
None of the strategies that I tested can beat the long term Buy&Hold strategy. That's the reason why I wrote this strategy.
Purpose: beat Buy&Hold strategy with around 10 trades. 100% capitalize sold trade into new trade.
My buy strategy is triggered by the fast buy EMA (blue) crossing over the slow buy SMA curve (orange) and the fast buy EMA has a certain up strength.
My sell strategy is triggered by either one of these conditions:
the EMA(6) of the close value is crossing under the trailing stop value (green) or
the fast sell EMA (navy) is crossing under the slow sell SMA curve (red) and the fast sell EMA has a certain down strength.
The trailing stop value (green) is set to a multiple of the ATR(15) value.
ATR(15) is the SMA(15) value of the difference between the high and low values.
The scripts shows a lot of graphical information:
The close value is shown in light-green. When the close value is lower then the buy value, the close value is shown in light-red. This way it is possible to evaluate the virtual losses during the trade.
the trailing stop value is shown in dark-green. When the sell value is lower then the buy value, the last color of the trade will be red (best viewed when zoomed)(in the example, there are 2 trades that end in gain and 2 in loss (red line at end))
the EMA and SMA values for both buy and sell signals are shown as a line
the buy and sell(close) signals are labeled in blue
How to use this strategy?
Every stock has it's own "DNA", so first thing to do is tune the right parameters to get the best strategy values voor EMA , SMA, Strength for both buy and sell and the Trailing Stop (#ATR).
Look in the strategy tester overview to optimize the values Percent Profitable and Net Profit (using the strategy settings icon, you can increase/decrease the parameters)
Then keep using these parameters for future buy/sell signals only for that particular stock.
Do the same for other stocks.
Important : optimizing these parameters is no guarantee for future winning trades!
Here are the parameters:
Fast EMA Buy: buy trigger when Fast EMA Buy crosses over the Slow SMA Buy value (use values between 10-20)
Slow SMA Buy: buy trigger when Fast EMA Buy crosses over the Slow SMA Buy value (use values between 30-100)
Minimum Buy Strength: minimum upward trend value of the Fast SMA Buy value (directional coefficient)(use values between 0-120)
Fast EMA Sell: sell trigger when Fast EMA Sell crosses under the Slow SMA Sell value (use values between 10-20)
Slow SMA Sell: sell trigger when Fast EMA Sell crosses under the Slow SMA Sell value (use values between 30-100)
Minimum Sell Strength: minimum downward trend value of the Fast SMA Sell value (directional coefficient)(use values between 0-120)
Trailing Stop (#ATR): the trailing stop value as a multiple of the ATR(15) value (use values between 2-20)
Example parameters for different stocks (Start capital: 1000, Order=100% of equity, Period 1/1/2005 to now) compared to the Buy&Hold Strategy(=do nothing):
BEKB(Bekaert): EMA-Buy=12, SMA-Buy=44, Strength-Buy=65, EMA-Sell=12, SMA-Sell=55, Strength-Sell=120, Stop#ATR=20
NetProfit: 996%, #Trades: 6, %Profitable: 83%, Buy&HoldProfit: 78%
BAR(Barco): EMA-Buy=16, SMA-Buy=80, Strength-Buy=44, EMA-Sell=12, SMA-Sell=45, Strength-Sell=82, Stop#ATR=9
NetProfit: 385%, #Trades: 7, %Profitable: 71%, Buy&HoldProfit: 55%
AAPL(Apple): EMA-Buy=12, SMA-Buy=45, Strength-Buy=40, EMA-Sell=19, SMA-Sell=45, Strength-Sell=106, Stop#ATR=8
NetProfit: 6900%, #Trades: 7, %Profitable: 71%, Buy&HoldProfit: 2938%
TNET(Telenet): EMA-Buy=12, SMA-Buy=45, Strength-Buy=27, EMA-Sell=19, SMA-Sell=45, Strength-Sell=70, Stop#ATR=14
NetProfit: 129%, #Trade

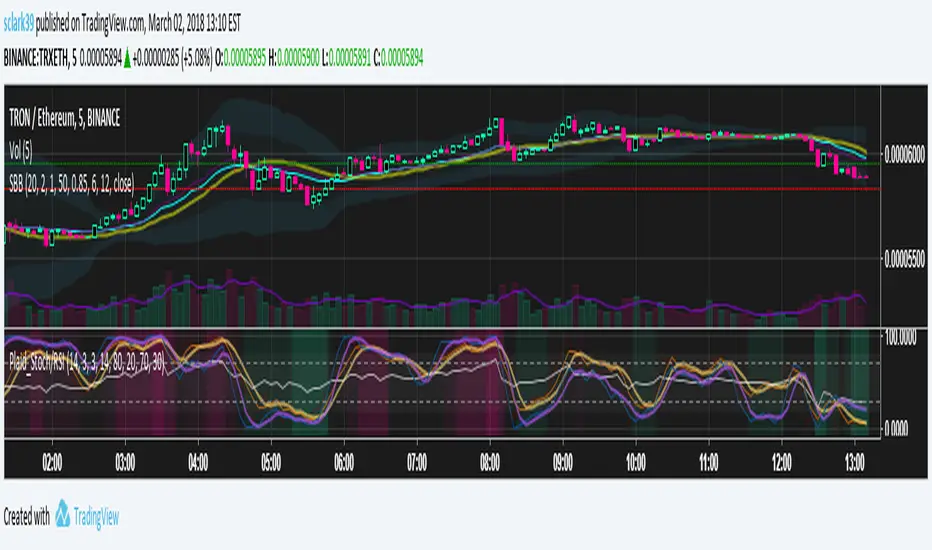
Plaid Stochastic / RSI Triple Combo Indicator [sclark39]Welcome to my "Plaid" Stochastic / RSI / StochRSI Combo indicator.
This shows the Fast and Slow Stochastic (orange and yellow), Relative Strength Index (white), and the Stochastic RSI (purple). As the lines cross the 80/20 and 70/30 lines, the background color changes to make it easy to see at a glance how many of the indicators have crossed their threshold. In the options you can change the period lengths and hide/show each of type of indicator to best fit your trading style.
Use this indicator for trades at your own risk, I made this for fun and it is not a trade recommendation.
That being said, if you like my work please tip me!
ETH: 0xf8E0Ea503B5c833fD4546E7fa2c70EcE42A27C8A
Please comment with feedback and requests!
XPloRR MA-Buy ATR-Trailing-Stop Long Term Strategy Beating B&HXPloRR MA-Buy ATR-MA-Trailing-Stop Strategy
Long term MA Trailing Stop strategy to beat Buy&Hold strategy
None of the strategies that I tested can beat the long term Buy&Hold strategy. That's the reason why I wrote this strategy.
Purpose: beat Buy&Hold strategy with around 10 trades. 100% capitalize sold trade into new trade.
My buy strategy is triggered by the EMA(blue) crossing over the SMA curve(orange).
My sell strategy is triggered by another EMA(lime) of the close value crossing the trailing stop(green) value.
The trailing stop value(green) is set to a multiple of the ATR(15) value.
ATR(15) is the SMA(15) value of the difference between high and low values.
Every stock has it's own "DNA", so first thing to do is find the right parameters to get the best strategy values voor EMA, SMA and Trailing Stop.
Then keep using these parameter for future buy/sell signals only for that particular stock.
Do the same for other stocks.
Here are the parameters:
Exponential MA: buy trigger when crossing over the SMA value (use values between 11-50)
Simple MA: buy trigger when EMA crosses over the SMA value (use values between 20 and 200)
Stop EMA: sell trigger when Stop EMA of close value crosses under the trailing stop value (use values between 8 and 16)
Trailing Stop #ATR: defines the trailing stop value as a multiple of the ATR(15) value
Example parameters for different stocks (Start capital: 1000, Order=100% of equity, Period 1/1/2005 to now):
BAR(Barco): EMA=11, SMA=82, StopEMA=12, Stop#ATR=9
Buy&HoldProfit: 45.82%, NetProfit: 294.7%, #Trades:8, %Profit:62.5%, ProfitFactor: 12.539
AAPL(Apple): EMA=12, SMA=45, StopEMA=12, Stop#ATR=6
Buy&HoldProfit: 2925.86%, NetProfit: 4035.92%, #Trades:10, %Profit:60%, ProfitFactor: 6.36
BEKB(Bekaert): EMA=12, SMA=42, StopEMA=12, Stop#ATR=7
Buy&HoldProfit: 81.11%, NetProfit: 521.37%, #Trades:10, %Profit:60%, ProfitFactor: 2.617
SOLB(Solvay): EMA=12, SMA=63, StopEMA=11, Stop#ATR=8
Buy&HoldProfit: 43.61%, NetProfit: 151.4%, #Trades:8, %Profit:75%, ProfitFactor: 3.794
PHIA(Philips): EMA=11, SMA=80, StopEMA=8, Stop#ATR=10
Buy&HoldProfit: 56.79%, NetProfit: 198.46%, #Trades:6, %Profit:83.33%, ProfitFactor: 23.07
I am very curious to see the parameters for your stocks and please make suggestions to improve this strategy.

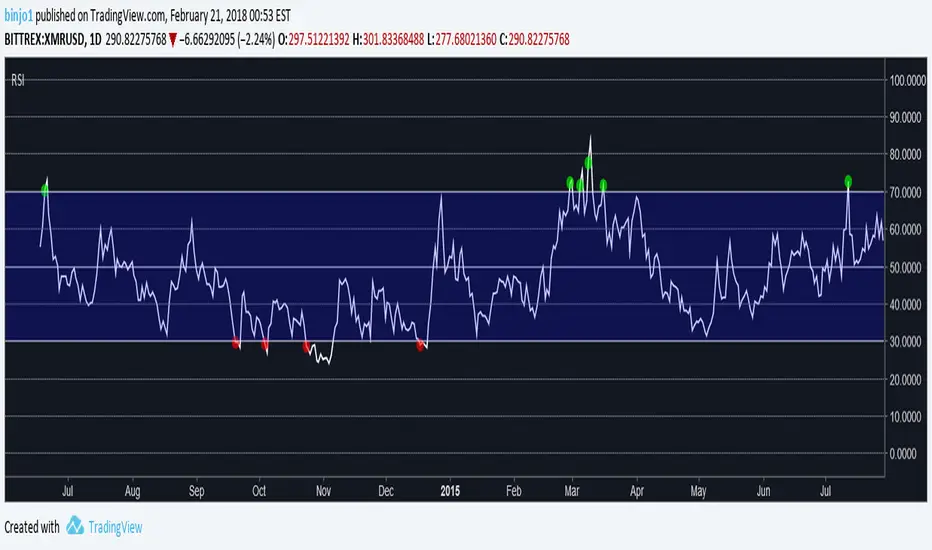
Better RSI0, 10, 20, 30, 40, 50, 60, 70, 80, 90, 100 lines drawn. Easier to see on dark theme. Added bubble indicators to show when price goes above 70 or below 30.
TKE INDICATOR by KıvanÇ fr3762TKE INDICATOR is created by Dr Yasar ERDINC (@yerdinc65 on twitter )
It's exactly the arithmetical mean of 7 most commonly used oscillators which are:
RSI
STOCHASTIC
ULTIMATE OSCILLATOR
MFI
WIILIAMS %R
MOMENTUM
CCI
the calculation is simple:
TKE=(RSI+STOCHASTIC+ULTIMATE OSCILLATOR+MFI+WIILIAMS %R+MOMENTUM+CCI)/7
Buy signal: when TKE crosses above 20 value
Oversold region: under 20 value
Overbought region: over 80 value
Another usage of TKE is with its EMA ,
You can add the EMA line of TKE in the settings menu by clicking the "Show EMA Line" button:
the default value is defined as 5 bars of EMA of the TKE line,
Go long: when TKE crosses above EMALine
Go short: when TKE crosses below EMALine

AJCrows RSIRelative Strength Index with indicator lines at 20, 30, 50, 70 and 80 marks. Use settings to show/hide these lines, and to choose appropriate colors.

Noro's DoubleRSI v1.0Recommended
Source = close
FastRSI = 2
SlowRSI = 14
How it works?
DoubleRSI = (FastRSI + SlowRSI ) / 2 = blue line
DoubleRSI > 80 = red bg color = sell?
DoubleRSI < 20 = lime bg color = buy?

Cowabunga System from babypips.comPlease do read the information below as well, especially if you are new to Forex.
The Cowabunga System is a type of Mechanical Trading System that filters trades based on the trend of the 4 hour chart with EMAs and some other familiar indicators (RSI, Stochastics and MACD) while entering trades base on 15 minute chart.
I have coded (quite amateurishly) the basic system onto a 15 minute chart (the 4 hour settings are coded as well). The author says the system is to be traded off the 15 minute chart with the 4 hour chart only as a reference for trend direction.
4 Hour Chart Settings
5 EMA
10 EMA
Stochastics (10,3,3)
RSI (9)
Then we move onto the 15 minute chart, where he gives us the trade entry rules.
15 Minute Chart Settings
5 EMA
10 EMA
Stochastics (10,3,3)
RSI (9)
MACD (12,26,9)
Entry Rules - long entry rules used, obviously reverse these for shorting.
1. EMA must cross above the 10 EMA.
2. RSI must be greater than 50 and not overbought.
3. Stochastic must be headed up and not be in overbought territory.
4. MACD histogram must go from negative to positive OR be negative and start to increase in value.
What I did.
1. Set the RSI and Stochastic levels to avoid entries when they indicate overbought conditions for long and oversold conditions for short (80 and 20 levels).
2. Users can input specific times they want to backtest.
3. User's can configure profit targets, trailing stops and stops. Default is set it to was 100 pips profit target with a 40 pip trailing stop. (Note, when you are changing these values, please note that each pip is worth 10, so 100 pips is entered as 1000.)
The Cowabunga System from babypips.com is another popular and active system. The author, Pip Surfer, continues to post wins and losses with this system. It shows there is a lot of honesty and integrity with this system if the author keeps up to date even 10 years later and is not afraid of sharing the times the system causes losses.
As an example of this, here is post he shared just last week . It's almost like a journal, he gives specific times and reasons why he entered, lets the readers know when he was stopped out, etc. I think that what he does is equally important as his system.
To read more about this system, visit the thread on babypips.com, click here.

Stochastic with False bar R2-2 by JustUncleLThis study project is an updated version of the implementation of the "Stochastic False BAR" indicator.
Description:
The standard Stochastic buy/sell indications come from Stochastic crosses about the standard overbought/oversold zones (80/20). This does not always work and you get stuck in the OB/OS zones with a trend continuation. Utilising a second much longer length Stochastic, the "False BAR" (Black) indicates when it is unsafe to take Stochastic cross over trades. Where the false bar does not appear (aqua, no background highlighing), the overbought / oversold conditions of the Stochastic can be considered higher-probability reversal areas and thus trading opportunities.
This Revision:
Added options to enable/disable False Bar lines and Stochastic trends.
Added options to modify upper and lower limits of false bar Stochastic and trading stochastic trend.
Added option to show the trading Stochastic as coloured Ribbon.
Added name titles for all plots
Added Background highlighting for False Bar.


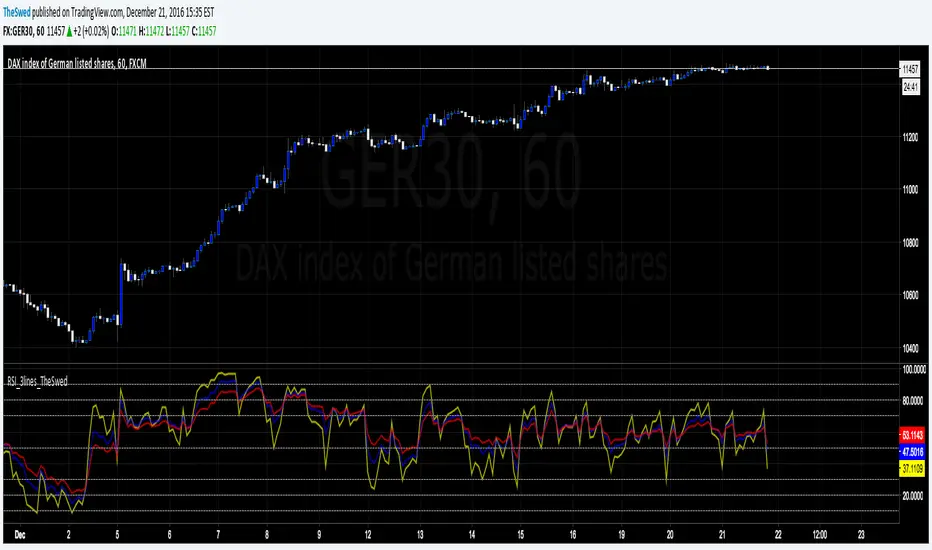
RSI_3lines_TheSwedRSI script with 3 lines. Also added lines: 90, 80, 20 and 10 to the script as I use this for trading.
MomentumBreak#1//condicion de compra: k>80
buycondition=crossover(k,oversold)
calculo de tamaño de la posicion segun el ultimo low dentro de lo n periodos anteriores, tambien usado como stop
salida por trailing stop

Vix FIX / StochRSI StrategyThis strategy is based off of Chris Moody's Vix Fix Indicator . I simply used his indicator and added some rules around it, specifically on entry and exits.
Rules :
Enter upon a filtered or aggressive entry
If there are multiple entry signals, allow pyramiding
Exit when there is Stochastic RSI crossover above 80
This works great on a number of stocks. I am keeping a list of stocks with decent Profit Factors and clean equity curves here .
Possible ways to use this:
Modify this script and setup alerts around the various entries
Use as is with different stocks or currency pairs
Modify entry / exit points to make it more profitable for even more symbols and currencies
