Double BB + Multi Ema Use this indicator to identify the market trend, possible dynamic Supports or Resistances and possible setbacks or corrections.
Take the Moving Averages (50,75,100,200) as a reference to identify if the market is bullish or bearish.
Have as reference the Moving Averages (8,15,20,25) as possible dynamic Supports or Resistances.
Have the BB as a reference, to identify possible setbacks or changes in trends.
在脚本中搜索"英国央行降息25个基点"

KINSKI RSI Short/LongExtends the display of the Relative Strength Index (RSI) by shorts and longs from Bitmex and shows them as a diagram.
How to interpret the display?
- blue line is the default Relative Strength Index
- red line means "oversold
- green line "overbought"
- grey dotted line up/down indicates the optimal range for up and down movements 30 to 70
- in general, the reaching or crossing of the thresholds in the direction of the mid-range is seen as a possible buy or sell signal
- RSI values (blue line) of over 70 percent are considered "overbought", values below 30 percent "oversold
Which settings can be made?
- Selection for the "Currency". Default value is "BTCUSD". Currently only the following currencies are supported "BTCUSD", "ETHUSD", "ETCUSD", "OMGUSD", "XLMUSD", "XTZUSD".
- Selection for calculation formula ("Calculation"). The default value is "hlc3".
- Field for the moving average value ("RSI Length"). The default value is 14, but values of 7, 9 or 25 are also common. The shorter the period under consideration, the more volatile the indicator is, but with longer periods, fewer signals are triggered.
- furthermore you can make layout adjustments via the "Style" menu

Buy/Sell IndicatorBased on logic from many top contributors here, the script utilizes LazyBear's WaveTrend Oscillator Indicator along with custom code to plot a few key components for daily trading;
Boundaries for entry and exit points which are based on a 6-day trend in OPEN/HIGH and OPEN/LOW prices.
Daily HIGH and LOW points to establish a good view of stock's movements
Entry and exit points with confidence levels. These can be treated as entry points for short to medium term investments
Entry points come in the colours of White and Lime, where white is slightly confident and lime is extremely confident
Exit points come in the colours of Maroon, and Red, where maroon is slightly confident and red is extremely confident
Each Entry and Exit point also comes without text, or with a M or H above it, where M indicates medium confidence on the point and an O indicates overconfidence.
Use Case:
The best possible use case is to enter a trade on a LIME point with O text, this means that is an overconfident entry point.
The trade should be exited on a RED point with O text, this means that is an overconfident exit point.
But you can do with the indicators as you please.
In addition to LazyBear's code, the following existing models and indicators are taken into account:
RSI of closing price over a period of 25
EMA of RSI

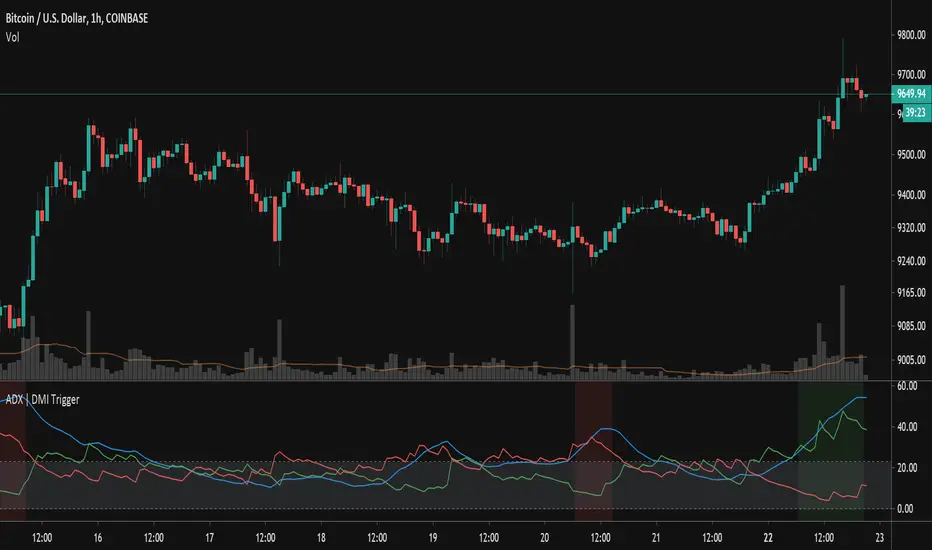
ADX TriggerThis script fires off a buy alert when the ADX is rising and above a user-defined value (default 25). It fires off a sell signal when ADX starts sloping downward. The lookback period to determine if it is sloping up/down (in bars) is also configurable by the user. The plot highlights green when there is a "go" signal. Thanks to @9e52f12edd034d28bdd5544e7ff92e for the idea.
Combing in MACD and MTFHi all, I'm trying to wedge in the MACD into a multiple timeframe. Scope is to create:
1) an alert when the MACD across all timeframes is positive,
2) an alert when the MACD across all timeframes is negative, and
3) one when neither of them is applicable.
Would anyone be so kind to give it some thoughts, please?
//@version=2
strategy(" Easy MTF Strategy", overlay=false)
TF_1_time = input("3", "Timeframe 1")
TF_2_time = input("5", "Timeframe 2")
TF_3_time = input("15", "Timeframe 3")
TF_4_time = input("30", "Timeframe 4")
fastLen = input(title="Fast Length", type=integer, defval=12)
slowLen = input(title="Slow Length", type=integer, defval=26)
sigLen = input(title="Signal Length", type=integer, defval=9)
= macd(close, fastLen, slowLen, sigLen)
width = 5
upcolor = green
downcolor = red
neutralcolor = blue
linestyle = line
TF_1 = security(tickerid, TF_1_time, open) < security(tickerid, TF_1_time, close) ? true:false
TF_1_color = TF_1 ? upcolor:downcolor
TF_2 = security(tickerid, TF_2_time, open) < security(tickerid, TF_2_time, close) ? true:false
TF_2_color = TF_2 ? upcolor:downcolor
TF_3 = security(tickerid, TF_3_time, open) < security(tickerid, TF_3_time, close) ? true:false
TF_3_color = TF_3 ? upcolor:downcolor
TF_4 = security(tickerid, TF_4_time, open) < security(tickerid, TF_4_time, close) ? true:false
TF_4_color = TF_4 ? upcolor:downcolor
TF_global = TF_1 and TF_2 and TF_3 and TF_4
TF_global_bear = TF_1 == false and TF_2 == false and TF_3 == false and TF_4 == false
TF_global_color = TF_global ? green : TF_global_bear ? red : white
TF_trigger_width = TF_global ? 6 : width
plot(1, style=linestyle, linewidth=width, color=TF_1_color)
plot(5, style=linestyle, linewidth=width, color=TF_2_color)
plot(10, style=linestyle, linewidth=width, color=TF_3_color)
plot(15, style=linestyle, linewidth=width, color=TF_4_color)
plot(25, style=linestyle, linewidth=4, color=TF_global_color)
exitCondition_Long = TF_global_bear
exitCondition_Short = TF_global
longCondition = TF_global
if (longCondition)
strategy.entry("MTF_Long", strategy.long)
shortCondition = TF_global_bear
if (shortCondition)
strategy.entry("MTF_Short", strategy.short)
strategy.close("MTF_Long", when=exitCondition_Long)
strategy.close("MTF_Short", when=exitCondition_Short)


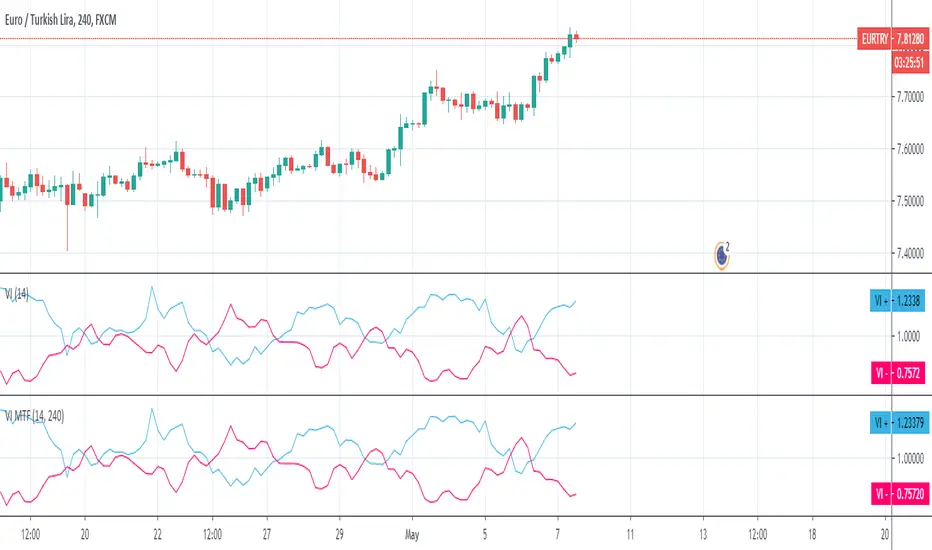
Vortex MTFUnderstanding Vortex Indicator (VI)
The vortex indicator was first developed by Etienne Botes and Douglas Siepman who introduced the concept in the January 2010 edition of “Technical Analysis of Stocks & Commodities.” The vortex indicator is based on two trendlines: VI+ and VI-.
What is the Vortex Indicator (VI)?
A vortex indicator (VI) is an indicator composed of two lines - an uptrend line (VI+) and a downtrend line (VI-). These lines are typically colored green and red respectively. A vortex indicator is used to spot trend reversals and confirm current trends.
Vortex Indicator Calculations
The calculation for the indicator is divided into four parts.
1. True range (TR) is the greatest of:
Current high minus current low
Current high minus previous close
Current low minus previous close
2. Uptrend and downtrend movement:
VM+ = Absolute value of current high minus prior low
VM- = Absolute value of current low minus prior high
3. Parameter length (n)
Decide on a parameter length (between 14 and 30 days is common)
Sum the last n period’s true range, VM+ and VM-:
Sum of the last n periods’ true range = SUM TRn
Sum of the last n periods’ VM+ = SUM VMn+
Sum of the last n periods’ VM- = SUM VMn−
4. Create the trendlines VI+ and VI-
SUM VMn+/SUM TRn = VIn+
SUM VMn-/SUM TRn = VIn−
Repeating this process daily forms the VI+ and VI- trendlines.
The traditional application of using VI- and VI+ crossovers can result in a number of false trade signals when price action is choppy. Increase the number of periods used in the indicator to reduce this, for example, using 25 periods instead of 14.
What is MTF?
Multiple Time Frame Analysis is the technique of analyzing several time frames of the same asset before entering a trade. This type of analysis is best done using a top-down approach, i.e. starting at a higher time frame and working your way down, via several lower time frames, until the execution time frame is reached where a trade could be entered. Traders who use this technique usually look at 3 or 4 different time frames to identify the general trend and find the best entries. They minimize their risk and improve the odds of success simply by taking the bigger picture into account. It can easily be combined with any trading strategy.
Time frames are usually several times apart. For example a day trader who trades hourly charts, could analyse the weekly (high time frame), the daily (7 times smaller), the 4 hour (6 times smaller) and finally the hourly time frame (execution time frame, 4 times smaller). TradingView has a chart layout feature with multiple charts per layout, so you can analyse an asset on multiple time frames under one tab in your browser.
Summary
With MTF, you can see the Vortex indicator values for a specific time period without changing the graph time period.
Ribbon_Arshiin this indicator
moving average 20-25-30-35-40-50-100-200 with fractal added to the chart.

Rate Of Change - Weekly SignalsRate of Change - Weekly Signals
This indicator gives a potential "buy signal" using Rate of Change of SPX and VIX together,
using the following criteria:
SPX Weekly ROC(10) has been BELOW -9 and now rises ABOVE -5
*PLUS*
VIX Weekly ROC(10) has been ABOVE +80 and now falls BELOW +10
The background will turn RED when ROC(SPX) is below -9 and ROC(VIX) is above +80.
The background will turn GREEN when ROC(SPX) is above -5 and ROC(VIX) is below +10.
So the potential "buy signal" is when you start to get GREEN BARS AFTER RED - usually with
some white/empty bars in between...but wait for the green. This indicates that the volatility
has settled down, and the market is starting to turn up.
This indicator gives excellent entry points, but be careful of the occasional false signals.
See Nov. 2001 and Nov. 2008, in both cases the market dropped another 25-30% before the final
bottom was formed. Always have an exit strategy, especially when buying in after a downtrend.
How I use this indicator, pretty much as shown in the preview. Weekly SPX as the main chart with
some medium/long moving averages to identify the trend, VIX added as a "Compare Symbol" in red,
and then the Weekly ROC signals below.
For the ROC graphs, you can show SPX+VIX together, SPX alone, or VIX alone. I prefer to display
them separately because they don't scale well together (VIX crowds out the SPX when it spikes).
Background color is still based on both SPX/VIX together, regardless of which graph is shown.
Note that there is no VIX data available on Trading View prior to 1990, so for those dates the
formula is using only ROC(SPX) and the assigned thresholds (-9 and -5, or whatever you choose).

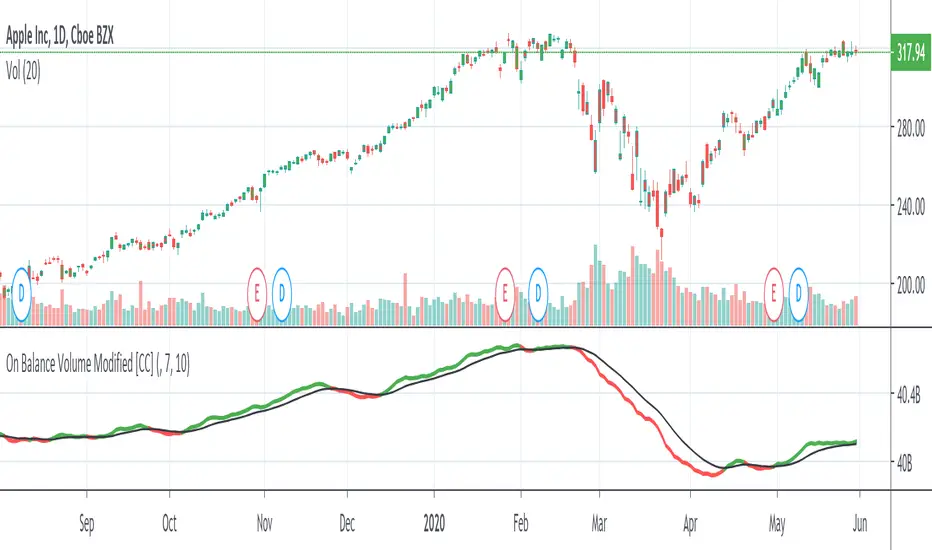
On Balance Volume ModifiedHere is a smoothed version of the classic OBV indicator with a signal line. You can use it to look for signal line crossovers and divergences. The signal line is a 10-day EMA of the OBVM line. Typically, the signal line can vary from 10 to 50.
This was just published by Vitali Apirine in the latest issue of Stocks & Commodities (April 2020) p22-25
Please let me know if you want me to publish any other indicators or if you have any questions!
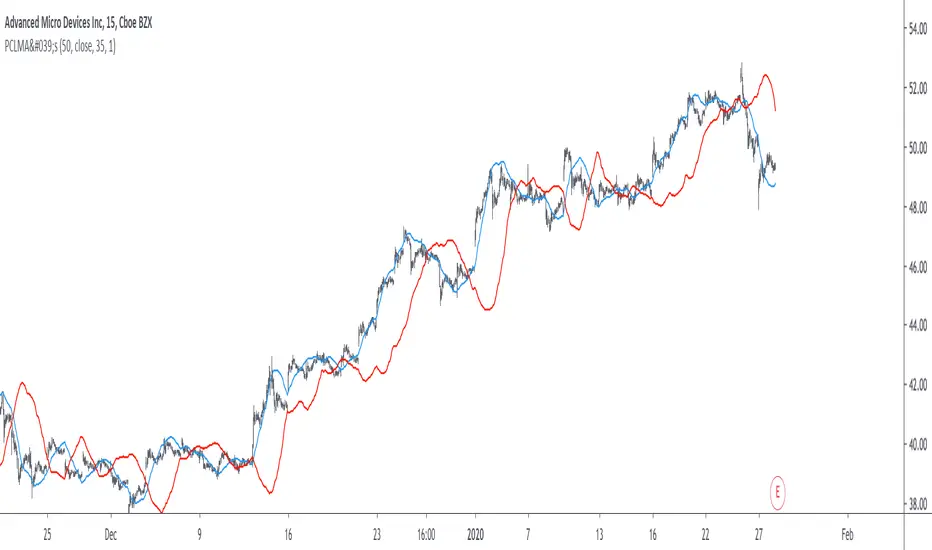
Overbought or Oversold? Check Distance From MAMoving averages are one of the most basic tools for technical analysts. They can be useful for both trend analysis and for mean reversion.
But how can you know when price is historically overbought or oversold relative to a moving average? Distance from MA can help.
This indicator calculates the distance from a moving average as a percentage and plots the result as an oscillator. Values above 0 appear in green, while negative readings are colored red.
This chart highlights the depth of the S&P 500's recent selloff. As you can see, the close dipped to 25 percent below its 50-day SMA on Monday. That was its most oversold condition since November 20, 2008 -- in the middle of the subprime financial crisis.
Distance from MA can handle five types of moving average. Simply change the "AvgType" input according to this key:
1 - Simple Moving Average
2 - Exponential Moving Average
3 - Hull Moving Average
4 - Weighted Moving Average
5 - Volume-Weighted Moving Average

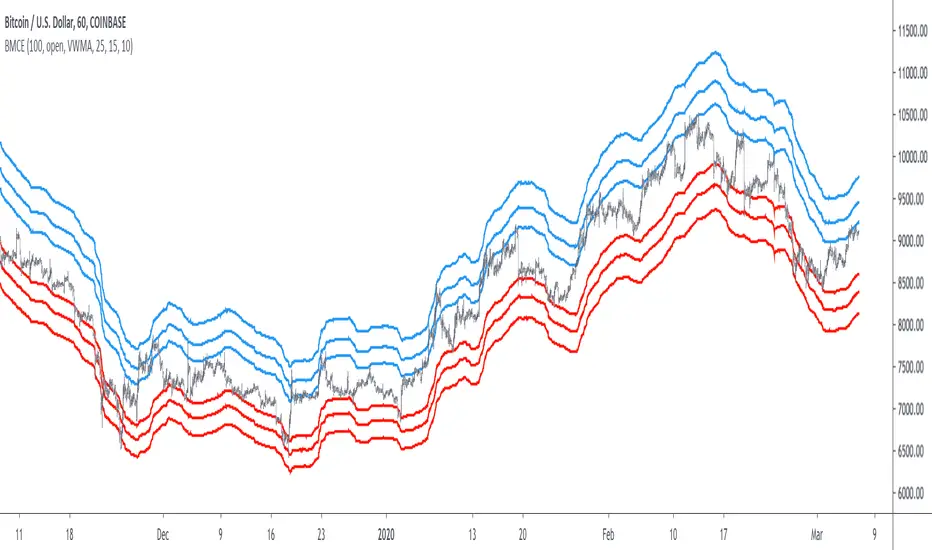
Bitcoin Margin Call Envelopes [saraphig & alexgrover]Bitcoin is the most well known digital currency, and allow two parties to make a transaction without the need of a central entity, this is why cryptocurrencies are said to be decentralized, there is no central unit in the transaction network, this can be achieved thanks to cryptography. Bitcoin is also the most traded cryptocurrency and has the largest market capitalization, this make it one of the most liquid cryptocurrency.
There has been tons of academic research studying the profitability of Bitcoin as well as its role as a safe heaven asset, with all giving mixed conclusions, some says that Bitcoin is to risky to be considered as an hedging instrument while others highlight similarities between Bitcoin and gold thus showing evidence on the usefulness of Bitcoin acting as an hedging instrument. Yet Bitcoin seems to attract more short term speculative investors rather than other ones that would use Bitcoin as an hedging instrument.
Once introduced, cryptocurrencies where of course heavily analyzed by technical analyst, and technical indicators where used by retail as well as institutional investors in order to forecast the future trends of bitcoin. I never really liked the idea of designing indicators that specifically worked for only one type of market and ever less on only one symbol. Yet the user @saraphig posted in Feb 20 an indicator called " Margin Call MovingAverage " who calculate liquidation price by using a volume weighted moving average. It took my attention and we decided to work together on a relatively more complete version that would include resistances levels.
I believe the proposed indicator might result useful to some users, the code also show a way to restrict the use of an indicator to only one symbol (line 9 to 16).
The Indicator
The indicator only work on BTCUSD, if you use another symbol you should see the following message:
The indicator plot 6 extremities, with 3 upper (resistance) extremities and 3 lower (support) extremities, each one based on the isolated margin mode liquidation price formula:
UPlp = MA/Leverage × (Leverage+1-(Leverage*0.005))
for upper extremities and:
DNlp = MA × Leverage/(Leverage+1-(Leverage*0.005))
for lower extremities.
Length control the period of the moving averages, with higher values of length increasing the probability of the price crossing an extremity. The Leverage's settings control how far away their associated extremities are from the price, with lower values of Leverage making the extremity farther away from the price, Leverage 3 control Up3 and Dn3, Leverage 2 control Up2 and Dn2, Leverage 1 control Up1 and Dn1, @saraphig recommend values for Leverage of either : 25, 20, 15, 10 ,5.
You can select 3 different types of moving average, the default moving average is the volume weighted moving average (VWMA), you can also choose a simple moving average (SMA) and the Kaufman adaptive moving average (KAMA).
Based on my understanding (which could be wrong) the original indicator aim to highlight points where margin calls might have occurred, hence the name of the indicator.
If you want a more "DSP" like description then i would say that each extremity represent a low-pass filter with a passband greater than 1 for upper extremities and lower than 1 for lower extremities, unlike bands indicators made by adding/subtracting a volatility indicator from another moving average this allow to conserve the original shape of the moving average, the downside of it being the inability to show properly on different scales.
here length = 200, on a 1h tf, each extremities are able to detect short-terms tops and bottoms. The extremity become wider when using lower time-frames.
You would then need to increase the Leverages settings, i recommend a time frame of 1h.
Conclusion
I'am not comfortable enough to make a conclusion, as i don't know the indicator that well, however i liked the original indicator posted by @saraphig and was curious about the idea behind it, studying the effect of margin calls on market liquidity as well as making indicators based on it might result a source of inspiration for other traders.
A big thanks to @saraphig who shared a lot of information about the original indicator and allowed me to post this one. I don't exclude working with him/her in the future, i invite you to follow him/her:
www.tradingview.com
Thx for reading and have a nice weekend! :3
FRAMA - Supertrend strategyFRAMA Strategy
I found this strategy on internet, in a well-known forex forum.
I have translated the two indicators mentioned in that strategy (originally in mq4) in pine script.
Thanks to Fractured and Shizaru for the FRAMA snippets, to mejialucas for Supertrend snippet, to JayRogers for trade management snippet and to Trost for backtesting snippet.
I also added some code to have FRAME with a deiiferent timeframe
Indicators set-up:
FRAMA period 24 (it was originally 25 but it's better to use an even number)
FRAMA timefarme lower then chart timeframe (e.g. daily chart and weekly FRAMA)
Supertrend indicator as it is.
Of course, it is better to adapt above setting to traded instrument.
Long/Buy rules:
1 - Enter at crossover between FRAMA and its signal
2 - Option to filter entries based on supertrend signal
3 - Exit when Supertrend change direction;
4 - Exit long when short signal occurs;
Short/Sell rules:
1 - Enter at crossunder between FRAMA and its signal
2 - Option to filter entries based on supertrend signal
3 - Exit when Supertrend change direction;
4 - Exit short when long signal occurs;
VERY IMPORTANT NOTE: this is a trend following strategy, so the target is to stay in the trade as much as possible (drawdown my be high). If your trading style is more focused on scalping and/or pullbaks, this strategy is not for you.
Credits to who developed this startegy (google it).
Thanks to all pinescripters mentined in the code for their snippets.
I have also a study with alerts.
Please use comment section for any feedback or contact me if you need support.

BO - RSI - M5 BacktestingBO - RSI - M5 Backtesting -Rule of Strategy
A. Data
1. Chart M5 IDC
2. Symbol: EURJPY
B. Indicator
1. RSI
2. Length: 12 (adjustable)
3. Extreme Top: 75 (adjustable)
4. Extreme Bottom: 25 (adjustable)
C. Rule of Signal
1. Put Signal
* Rsi create a temporary peak over Extreme Top
row61: peak_rsi= rsi >rsi and rsi >rsi and rsi rsi_top
2. Call Signal
* Rsi create a temporary bottom under Extreme Bottom
row62: bott_rsi= rsi rsi and rsi

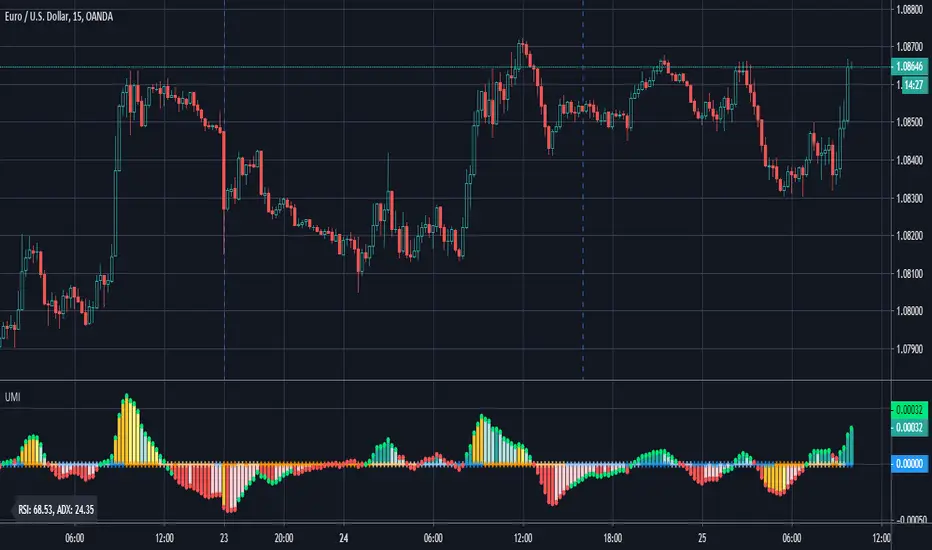
Ultimate Momentum IndicatorThis is an indicator I've been playing with for a while, based on my previous MACD w/ RSI Warning indicator. This one takes it a step further, including information from MACD, RSI, ADX, and Parabolic SAR. These four indicators are represented in this indicator as follows:
MACD: The histogram itself is a normal MACD histogram. Nothing strange about it, and you can adjust the settings for it just as you would a normal MACD.
RSI: Any time the RSI is outside of normal ranges (which can be adjusted in the settings), the bar on the histogram will turn amber to warn you. The actual RSI value is also shown in a label to the left side of the indicator.
ADX: Crosses are drawn along the 0 line to indicate ADX. Blue means the ADX is below the trending level (adjustable in the settings), and orange means it is above that level. Darker colors indicate the ADX has gone up since the previous bar, while lighter colors indicate it has gone down. The actual ADX value is also shown in the label to the left side of the indicator.
Parabolic SAR: At the outside point of each bar in the histogram, a colored dot is drawn. If the dot is green, the Parabolic SAR (settings adjustable) is currently below the closing price. If the dot is red, the SAR is above the closing price.
I must stress that this indicator is not a replacement for any one of the indicators it includes, as it's really only pulling small bits of information from each. The point of this indicator is to give a cohesive picture of momentum at a quick glance. I encourage you to continue to use the normal versions of whichever of the basic indicators you already use, especially if those indicators are a key part of your strategy. This indicator is designed purely as a way to get a bird's eye view of the momentum.
Pretty much every normally adjustable value can be adjusted in the settings for each of the base indicators. You can also set:
The RSI warning levels (30 and 70 by default)
The ADX Crossover, i.e. the point at which you consider the ADX value to indicate a strong trend (25 by default)
The offset for the label which shows the actual RSI & ADX values (109 by default, which happens to line up with my chart layout--yours will almost certainly need to be different to look clean)
All of the colors, naturally
As always, I am open to suggestions on how I might make the indicator look cleaner, or even other indicators I might try to include in the data this indicator produces. My choice of indicators to base this one from is entirely based on the ones I use and know, but I'm sure there are other great indicators that may improve this combination indicator even more!
ATA v4 StrategyAta strategy is include 3 different time frame = MTF
2 different moving average =MA
Oversold/overbought for relative strength index =RSI
Strategy exit for trailing stop loss %2 =TSL
MTF like 1 day, 4h and 5 min, between 2 moving averages like fibo numbers 21 and 34. Also strategy test for oversold up to 60 and overbought under the 25 with RSI. Stratefy exit include trailing stop loss %2 persantage for max. gain. It was created by XMAXPRO. This system is open to development.

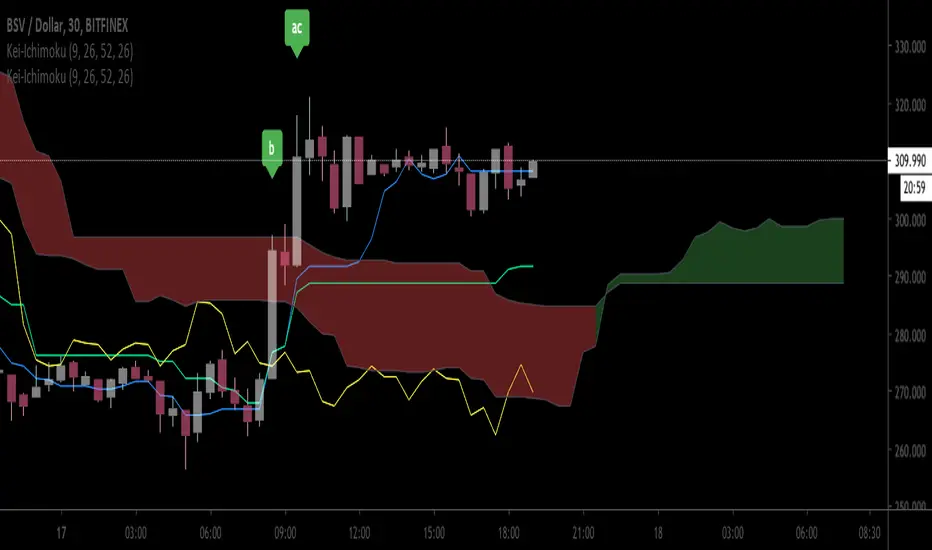
Ichimoku Cloud by Wei V1.3Label Sanyaku events, green for Gold and red for dead
- a: Tenkan sen Kijun Sen cross
- b: Chiko Span Cross Candle
- c: Kumo breakout
I also added a input option to draw chiko span differently. Original Chiko to draw Chiko as originally designed, and false to draw price at 25 bars earlier at current as "chiko span"
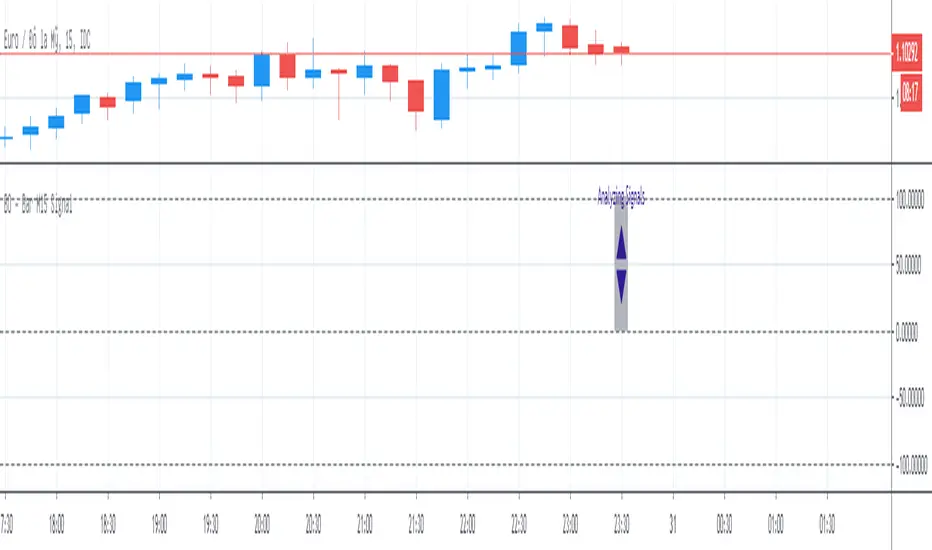
BO - Bar M15 Signal* This script show the signal base on volatility of previous bar M15 to trade Binary Option.
* Rule of Signal is below:
A. Rule 1: Wait for prices created temporary peak and bottom
Row 18: 10 minutes till close
B. Rule 2: Reversal previous bar's direction
1. Put Signal - Row 22 - 25:
- Delay 5' after bar M15 open
- previous bar's direction is upward
- price less than previous close
- temporary bottom greater than previous open
2. Call Signal - Row 29 - 32:
- Delay 5' after bar M15 open
- previous bar's direction is downward
- price greater than previous close
- temporary peak less than previous open
C. Rule 3: Follow previous bar's direction
1. Put Signal - Row 37 - 40:
- Delay 5' after bar M15 open
- previous bar's direction is downward
- price greater than previous open
- temporary peak less than previous peak
2. Call Signal - Row 43 - 46:
- Delay 5' after bar M15 open
- previous bar's direction is upward
- price less than previous open
- temporary bottom greater than previous bottom
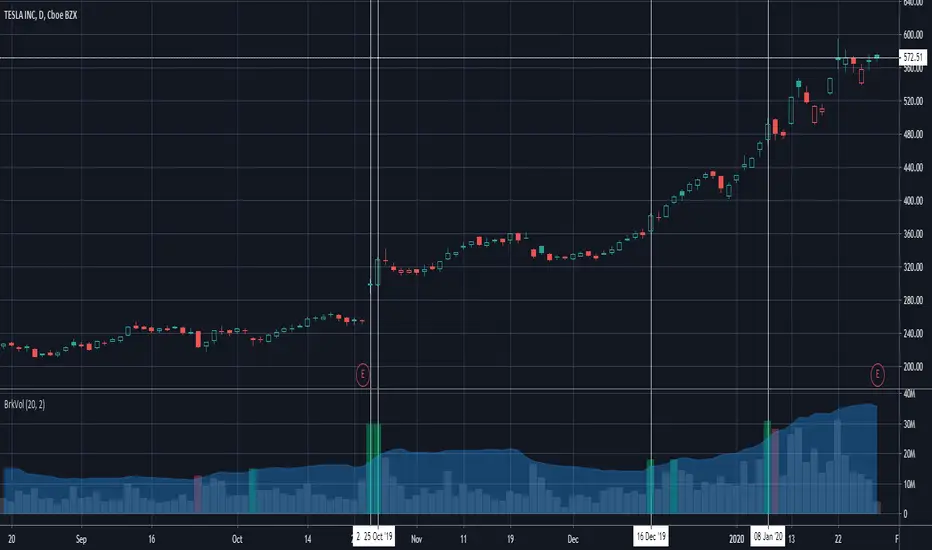
Breakout Volume Can Help Confirm Other SignalsVolume can help confirm signals we might discover using other methods of technical analysis.
This indicator tracks volume intelligently. Its logic spots above-average turnover and then tests against the price change. BrkVol highlights sessions with heavy volume and directional moves. This can help take out the noise and help confirm the trend.
Tesla is a classic example of this, with the stock rallying after showing heavy-volume gains on October 24- 25, December 16 and January 8.
Parametric Corrective Linear Moving AveragesImpulse responses can fully describe their associated systems, for example a linearly weighted moving average (WMA) has a linearly decaying impulse response, therefore we can deduce that lag is reduced since recent values are the ones with the most weights, the Blackman moving average (or Blackman filter) has a bell shaped impulse response, that is mid term values are the ones with the most weights, we can deduce that such moving average is pretty smooth, the least squares moving average has negative weights, we can therefore deduce that it aim to heavily reduce lag, and so on. We could even estimate the lag of a moving average by looking at its impulse response (calculating the lag of a moving average is the aim of my next article with Pinescripters) .
Today a new moving average is presented, such moving average use a parametric rectified linear unit function as weighting function, we will see that such moving average can be used as a low lag moving average as well as a signal moving average, thus creating a moving average crossover system. Finally we will estimate the LSMA using the proposed moving average.
Correctivity And The Parametric Rectified Linear Unit Function
Lot of terms are used, each representing one thing, lets start with the easiest one,"corrective". In some of my posts i may have used the term "underweighting", which refer to the process of attributing negative weights to the input of a moving average, a corrective moving average is simply a moving average underweighting oldest values of the input, simply put most of the low lag moving averages you'll find are corrective. This term was used by Aistis Raudys in its paper "Optimal Negative Weight Moving Average for Stock Price Series Smoothing" and i felt like it was a more elegant term to use instead of "low-lag".
Now we will describe the parametric rectified linear unit function (PReLU), this function is the one used as weighting function and is not that complex. This function has two inputs, alpha , and x , in short if x is greater than 0, x remain unchanged, however if x is lower than 0, then the function output is alpha × x , if alpha is equal to 1 then the function is equivalent to an identity function, if alpha is equal to 0 then the function is equivalent to a rectified unit function.
PReLU is mostly used in neural network design as an activation function, i wont explain to you how neural networks works but remember that neural networks aim to mimic the neural networks in the brain, and the activation function mimic the process of neuron firing. Its a super interesting topic because activation functions regroup many functions that can be used for technical indicators, one example being the inverse fisher RSI who make use of the hyperbolic tangent function.
Finally the term parametric used here refer to the ability of the user to change the aspect of the weighting function thanks to certain settings, thinking about it, it isn't a common things for moving averages indicators to let the user modify the characteristics of the weighting function, an exception being the Arnaud Legoux moving average (ALMA) which weighting function is a gaussian function, the user can control the peak and width of the function.
The Indicator
The indicator has two moving averages displayed on the chart, a trigger moving average (in blue) and a signal moving average (in red), their crosses can generate signals. The length parameter control the filter length, with higher values of length filtering longer term price fluctuations.
The percentage of negative weights parameter aim to determine the percentage of negative weights in the weighting function, note that the signal moving average won't use the same amount and will use instead : 100 - Percentage , this allow to reverse the weighting function thus creating a more lagging output for signal. Note that this parameter is caped at 50, this is because values higher than 50 would make the trigger moving average become the signal moving average, in short it inverse the role of the moving averages, that is a percentage of 25 would be the same than 75.
In red the moving average using 25% of negative weights, in blue the same moving average using 14% percent of negative weights. In theory, more negative weights = less lag = more overshoots.
Here the trigger MA in blue has 0% of negative weights, the trigger MA in green has however 35% of negative weights, the difference in lag can be clearly seen. In the case where there is 0% of negative weights the trigger become a simple WMA while the signal one become a moving average with linearly increasing weights.
The corrective factor is the same as alpha in PReLU, and determine the steepness of the negative weights line, this parameter is constrained in a range of (0,1), lower values will create a less steep negative weights line, this parameter is extremely useful when we want to reduce overshoots, an example :
here the corrective factor is equal to 1 (so the weighting function is an identity function) and we use 45% of negative weights, this create lot of overshoots, however a corrective factor of 0.5 reduce them drastically :
Center Of Linearity
The impulse response of the signal moving average is inverse to the impulse response of the trigger moving average, if we where to show them together we would see that they would crosses at a point, denoted center of linearity, therefore the crosses of each moving averages correspond to the cross of the center of linearity oscillator and 0 of same period.
This is also true with the center of gravity oscillator, linear covariance oscillator and linear correlation oscillator. Of course the center of linearity oscillator is way more efficient than the proposed indicator, and if a moving average crossover system is required, then the wma/sma pair is equivalent and way more efficient, who would know that i would propose something with more efficient alternatives ? xD
Estimating A Least Squares Moving Average
I guess...yeah...but its not my fault you know !!! Its a linear weighting function ! What can i do about it ?
The least squares moving average is corrective, its weighting function is linearly decreasing and posses negative weights with an amount of negative weights inferior to 50%, now we only need to find the exact percentage amount of negative weights. How to do it ? Well its not complicated if we recall the estimation with the WMA/SMA combination.
So, an LSMA of period p is equal to : 3WMA(p) - 2SMA(p) , each coefficient of the combination can give us this percentage, that is 2/3*100 = 33.333 , so there are 33.33% percent of negative weights in the weighting function of the least squares moving average.
In blue the trigger moving average with percentage of negative values et to 33.33, and in green the lsma of both period 50.
Conclusion
Altho inefficient, the proposed moving averages remain extremely interesting. They make use of the PReLU function as weighting function and allow the user to have a more accurate control over the characteristics of the moving averages output such as lag and overshoot amount, such parameters could even be made adaptive.
We have also seen how to estimate the least squares moving average, we have seen that the lsma posses 33.333...% of negative weights in its weighting function, another useful information.
The lsma is always behind me, not letting me focus on cryptobot super profit indicators using massive amount of labels, its like each time i make an indicator, the lsma come back, like a jealous creature, she want the center of attention, but you know well that the proposed indicator is inefficient ! Inefficient elegance (effect of the meds) .
Thanks for reading !
HatiKO EnvelopesPublished source code is subject to the terms of the GNU Affero General Public License v3.0
This script describes and provides backtesting functionality to internal strategy of algorithmic crypto trading software "HatiKO bot".
Suitable for backtesting any Cryptocurrency Pair on any Exchange/Platform, any Timeframe.
Core Mechanics of this strategy are based on theory of price always returning to Moving Average + Envelopes indicator (Moving_average_envelope from Wiki)
Developement of this script and trading software is inspired by:
"Essential Technical Analysis: Tools and Techniques to Spot Market Trends" by Leigh Stevens (published on 12th of April 2002)
"Moving Average Envelopes" by ChartSchool, StockCharts platform (published on 13th of April 2015 or earlier)
"Коля Колеснік" from Crypto Times channel ("Метод сетка", published on 19th of August 2018)
"3 ways to use Moving Average Envelopes" by Rich Fitton, published on Trader's Nest (published on 28st of November 2018 or earlier)
noro's "Robot WhiteBox ShiftMA" strategy v1 script, published on TradingView platform (published on 29th of August 2018)
"Moving Average Envelopes: A Popular Trading Tool" Investopedia article (published 25th of June 2019)
and KROOL1980's blogpost on Argolabs ("Гридерство или Сетка как источник прибыли на форекс", published on 27th of February 2015)
Core Features:
1) Up to 4 Envelopes in each direction (Long/Short)
2) Use any of 6 different basis MAs, optionally use different MAs for Opening and Closure
3) Use different Timeframes for MA calculation, without any repainting and lookahead bias.
4) Fixed order size, not Martingale strategy
5) Close open position earlier by using Deviation parameter
6) PineScript v4 code
Options description:
Lot - % from your initial balance to use for order size calculation
Timeframe Short - Timeframe to use for Short Opening MA calculation, can be chosen from dropdown list, default is Current Graph Timeframe
MA Type Short - Type of MA to use for Short Opening MA calculation, can be chosen from dropdown list, default is SMA
Data Short - Source of Price for Short Opening MA calculation, can be chosen from dropdown list, default is OHLC4
MA Length Short - Period used for Short Opening MA calculation, should be >=1, default is 3
MA offset Short - Offset for MA value used for Short Envelopes calculation, should be >= 0, default is 0
Timeframe Long - Timeframe to use for Long Opening MA calculation, can be chosen from dropdown list, default is Current Graph Timeframe
MA Type Long - Type of MA to use for Long Opening MA calculation, can be chosen from dropdown list, default is SMA
Data Long - Source of Price for Long Opening MA calculation, can be chosen from dropdown list, default is OHLC4
MA Length Long - Period used for Long Opening MA calculation, should be >=1, default is 3
MA offset Long - Offset for MA value used for Long Envelopes calculation, should be >= 0, default is 0
Mode close MA Short - Enable different MA for Short position Closure, default is "false". If false, Closure MA = Opening MA
Timeframe Short Close - Timeframe to use for Short Position Closure MA calculation, can be chosen from dropdown list, default is Current Graph Timeframe
MA Type Close Short - Type of MA to use for Short Position Closure MA calculation, can be chosen from dropdown list, default is SMA
Data Short Close - Source of Price for Short Closure MA calculation, can be chosen from dropdown list, default is OHLC4
MA Length Short Close - Period used for Short Opening MA calculation, should be >=1, default is 3
Short Deviation - % to move from MA value, used to close position above or beyond MA, can be negative, default is 0
MA offset Short Close - Offset for MA value used for Short Position Closure calculation, should be >= 0, default is 0
Mode close MA Long - Enable different MA for Long position Closure, default is "false". If false, Closure MA = Opening MA
Timeframe Long Close - Timeframe to use for Long Position Closure MA calculation, can be chosen from dropdown list, default is Current Graph Timeframe
MA Type Close Long - Type of MA to use for Long Position Closure MA calculation, can be chosen from dropdown list, default is SMA
Data Long Close - Source of Price for Long Closure MA calculation, can be chosen from dropdown list, default is OHLC4
MA Length Long Close - Period used for Long Opening MA calculation, should be >=1, default is 3
Long Deviation - % to move from MA value, used to close position above or beyond MA, can be negative, default is 0
MA offset Long Close - Offset for MA value used for Long Position Closure calculation, should be >= 0, default is 0
Short Shift 1..4 - % from MA value to put Envelopes at, for Shorts numbers should be positive, the higher is number, the higher should be Shift position, example: "Shift 1 = 1, shift 2 = 2, etc."
Long Shift 1..4 - % from MA value to put Envelopes at, for Longs numbers should be negative, the lower is number, the lower should be Shift position, example: "Shift 1 = -1, shift 2 = -2, etc."
From Year 20XX - Backtesting Starting Year number, only 20xx supported as script is cryptocurrency-oriented.
To Year 20XX - Backtesting Final Year number, only 20xx supported as script is cryptocurrency-oriented.
From Month - Years starting Month, optional tweaking, changing not recommended
To Month - Years ending Month, optional tweaking, changing not recommended
From day - Months starting day, optional tweaking, changing not recommended
To day - Months ending day, optional tweaking, changing not recommended
Graph notes:
Green lines - Long Envelopes.
Red lines - Short Envelopes.
Orange line - MA for closing of Short positions.
Lime line - MA for closing of Long positions.
**************************************************************************************************************************************************************************************************************
Опубликованный исходный код регулируется Условиями Стандартной Общественной Лицензии GNU Affero v3.0
Этот скрипт описывает и предоставляет функции бектеста для внутренней стратегии алгоритмического программного обеспечения "HatiKO bot".
Подходит для тестирования любой криптовалютной пары на любой бирже/платформе, на любом таймфрейме.
Кор-механика этой стратегии основана на теории всегда возвращающейся к значению МА цены с использованием индикатора Envelopes (Moving_average_envelope from Wiki)
Разработка этого скрипта и программного обеспечения для торговли вдохновлена следующими источниками:
Книга "Essential Technical Analysis: Tools and Techniques to Spot Market Trends" Ли Стивенса (опубликовано 12 апреля 2002 года)
«Moving Average Envelopes» от ChartSchool, платформа StockCharts (опубликовано 13 апреля 2015 года или раньше)
«Коля Колеснік» с канала Crypto Times («Метод сетка», опубликовано 19 августа 2018 года)
«3 ways to use Moving Average Envelopes» Рича Фиттона, опубликованные в «Trader's Nest» (опубликовано 28 ноября 2018 года или раньше)
Скрипт стратегии noro "Robot WhiteBox ShiftMA" v1, опубликованный на платформе TradingView(опубликовано 29 августа 2018 года)
«Moving Average Envelopes: A Popular Trading Tool», статья Investopedia (опубликовано 25 июня 2019 года)
Блог KROOL1980 из Argolabs («Гридерство или Сетка как источник прибыли на форекс», опубликовано 27 февраля 2015 года)
Основные особенности:
1) До 4-х Ордеров в каждом из направлении (Лонг / Шорт)
2) Выбор из 6-ти разных базовых МА, опционально используйте разные МА для открытия и закрытия.
3) Используйте разные таймфреймы для расчета MA, без перерисовки и "эффекта стеклянного шара".
4) Фиксированный размер ордера, а не стратегия Мартингейла
5) Возможность закрытия открытой позиции заблаговременно, используя параметр Deviation
6) Код реализован на PineScript v4
Описание параметров:
Lot - % от вашего первоначального баланса, используется при расчете размера Ордера
Timeframe Short - таймфрейм, используемый для расчета МА Открытия Шорт позиций, может быть выбран из списка, по умолчанию - таймфрейм текущего графика
MA Type Short - тип MA, используемый для расчета МА Открытия Шорт позиций, может быть выбран из списка, по умолчанию SMA
Data Short - источник цены для расчета МА Открытия Шорт позиций, может быть выбран из списка, по умолчанию OHLC4
MA Length Short - период, используемый для расчета МА Открытия Шорт позиций, должен быть >= 1, по умолчанию 3
MA Offset Short - смещение значения MA, используемого для расчета Шорт Ордеров, должно быть >= 0, по умолчанию 0
Timeframe Long - таймфрейм, используемый для расчета МА Открытия Лонг позиций, может быть выбран из списка, по умолчанию - таймфрейм текущего графика
MA Type Long - тип MA, используемый для расчета МА Открытия Лонг позиций, может быть выбран из списка, по умолчанию SMA
Data Long - источник цены для расчета МА Открытия Лонг позиций, может быть выбран из списка, по умолчанию OHLC4
MA Length Long - период, используемый для расчета МА Открытия Лонг позиций, должен быть >= 1, по умолчанию 3
MA Offset Long - смещение значения MA, используемого для расчета Лонг Ордеров, должно быть >= 0, по умолчанию 0
Mode close MA Short - Включает отдельное MA для закрытия Шорт позиции, по умолчанию «false». Если false, MA Закрытия = MA Открытия
Timeframe Short Close - таймфрейм, используемый для расчета МА Закрытия Шорт позиций, может быть выбран из списка, по умолчанию - таймфрейм текущего графика
MA Type Close Short - тип MA, используемый при расчете МА Закрытия Шорт позиции. Mожно выбрать из списка, по умолчанию SMA
Data Short Close - источник цены для расчета МА Закрытия Шорт позиций, может быть выбран из списка, по умолчанию OHLC4
MA Length Short Close - период, используемый для расчета МА Закрытия Шорт позиции, должен быть >= 1, по умолчанию 3
Short Deviation - % отклонения от значения MA, используется для закрытия позиции выше или ниже рассчитанного значения MA, может быть отрицательным, по умолчанию 0
MA Offset Short Close - смещение значения MA, используемого для расчета закрытия Шорт позиции, должно быть >= 0, по умолчанию 0
Mode close MA Long - Включает разные MA для закрытия Лонг позиции, по умолчанию «false». Если false, MA Закрытия = MA Открытия
Timeframe Long Close - таймфрейм, используемый для расчета МА Закрытия Лонг позиций, может быть выбран из списка, по умолчанию - таймфрейм текущего графика
MA Type Close Long - тип MA, используемый при расчете МА Закрытия Лонг позиции. Mожно выбрать из списка, по умолчанию SMA
Data Long Close - источник цены для расчета МА Закрытия Лонг позиций, может быть выбран из списка, по умолчанию OHLC4
MA Length Long Close - период, используемый для расчета МА Закрытия Лонг позиции, должен быть >= 1, по умолчанию 3
Long Deviation -% для перехода от значения MA, используется для закрытия позиции выше или ниже рассчитанного значения MA, может быть отрицательным, по умолчанию 0
MA Offset Long Close - смещение значения MA, используемого для расчета закрытия Лонг позиции, должно быть >= 0, по умолчанию 0
Short Shift 1..4 - % от значения MA для размещения Ордеров, для Шорт Ордеров должен быть положительным, чем выше номер, тем выше должна располагаться позиция Shift, например: «Shift 1 = 1, Shift 2 = 2 и т.д. "
Long Shift 1..4 - % от значения MA для размещения Ордеров, для Лонг Ордеров должно быть отрицательным, чем ниже число, тем ниже должна располагаться позиция Shift, например: «Shift 1 = -1, Shift 2 = -2, и т.д."
From Year 20XX - Год начала тестирования, из-за ориентированности на криптовалюты поддерживаются только значения формата 20хх.
To Year 20XX - Год окончания тестирования, из-за ориентированности на криптовалюты поддерживаются только значения формата 20хх.
From Month - Начальный месяц, опционально, менять не рекомендуется
To Month - Конечный месяц, опционально, менять не рекомендуется
From day - Начальный день месяца, опционально, менять не рекомендуется
To day - Конечный день месяца, опционально, менять не рекомендуется
Пояснения к графику:
Зеленые линии - Лонг Ордера.
Красные линии - Шорт Ордера.
Оранжевая линия - MA Закрытия Шорт позиций.
Лаймовая линия - MA Закрытия Лонг позиций.

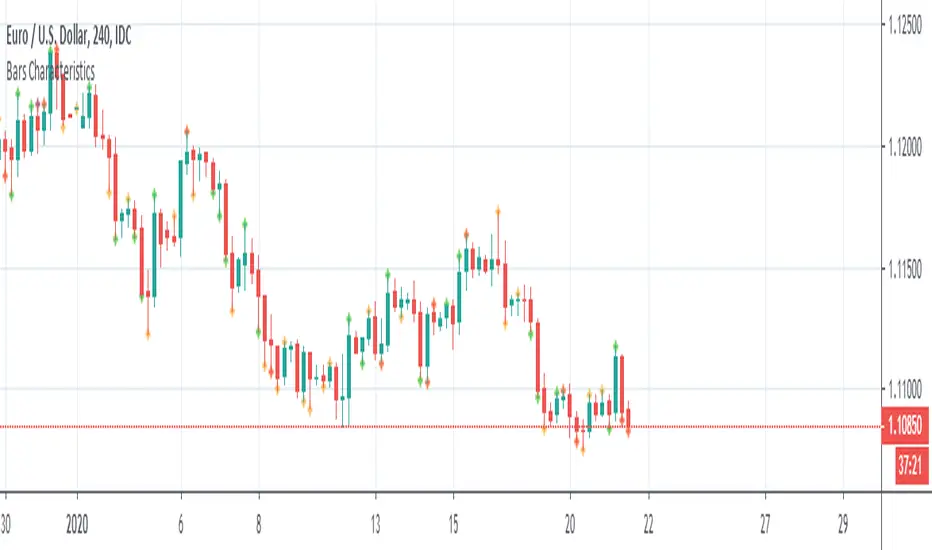
Bars CharacteristicsThis code is for defining or explaining market conditions via micro trend and the characterized bars.
lines 5,6: show the conditions for a normal trend, means market can go in the direction that it has in the past.
lines 11,12: show the conditions for kind of the trend having cumulative energy itself, mean market can go in the same direction.
lines 18,19: show the conditions for kind of the trend having overbought/sold concept, means it's better exit from the market or to look for the other clues.
lines 24,25: show some kind of noise not a stable trend, it's better not to enter the market.
ORB 15 Min By EquityDurai#Let the index/stock trade for the first fifteen minutes and then use the high and low of this "fifteen minute range" as support and resistance levels.
#A buy signal is given when price exceeds the high of the 15 minute range after an up gap.
#A sell signal is given when price moves below the low of the 15 minute range after a down gap.
#It's a simple technique that works like a charm in many cases.
>If you use this technique, though, a few caveats are in order to avoid whipsaws and other market traps.
>The most common whipsaw is a trading range that lasts longer than 15 minutes.
>If an obvious range builds in 20, 25 or even 30 minutes , use those to define your support and resistance levels.
>Also consider the higher noise level in the morning.
>A breakout that extends only a tick or two can be easily reversed and trap you in a sudden loss.
>So let others take the bait at these levels, while you find pullbacks and narrow range bars for trade execution.
