Range Lattice## RangeLattice
RangeLattice constructs a higher-timeframe scaffolding on any intraday chart, locking in structural highs/lows, mid/quarter grids, VWAP confluence, and live acceptance/break analytics. It provides a non-repainting overlay that turns range management into a disciplined process.
HOW IT WORKS
Structure Harvesting – Using request.security() , the script samples highs/lows from a user-selected timeframe (default 240 minutes) over a configurable lookback to establish the dominant range.
Grid Construction – Midpoint and quarter levels are derived mathematically, mirroring how institutional traders map distribution/accumulation zones.
Acceptance Detection – Consecutive closes inside the range flip an acceptance flag and darken the cloud, signaling balanced auction conditions.
Break Confirmation – Multi-bar closes outside the structure raise break labels and alerts, filtering the countless fake-outs that plague breakout traders.
VWAP Fan Overlay – Session VWAP plus ATR-based bands provide a live measure of flow centering relative to the lattice.
HOW TO USE IT
Range Plays : Fade taps of the outer rails only when acceptance is active and VWAP sits inside the grid—this is where mean-reversion works best.
Breakout Plays : Wait for confirmed break labels before entering expansion trades; the dashboard's Width/ATR metric tells you if the expansion has enough fuel.
Market Prep : Carry the same lattice from pre-market into regular trading hours by keeping the structure timeframe fixed; alerts keep you notified even when managing multiple tickers.
VISUAL FEATURES
Range Tap and Mid Pivot markers provide a tape-reading breadcrumb trail for journaling.
Cloud fill opacity tightens when acceptance persists, visually signaling balance compressions ready to break.
Dashboard displays absolute width, ATR-normalized width, and current state (Balanced vs Transitional) so you can glance across charts quickly.
Acceptance Flag toggle: Keep the repeated acceptance squares hidden until you need to audit balance.
PARAMETERS
Structure Timeframe (default: 240): Choose the timeframe whose ranges matter most (4H for indices, Daily for stocks).
Structure Lookback (default: 60): Bars sampled on the structure timeframe.
Acceptance Bars (default: 8): How many consecutive bars inside the range confirm balance.
Break Confirmation Bars (default: 3): Bars required outside the range to validate a breakout.
ATR Reference (default: 14): ATR period for width normalization.
Show Midpoint Grid (default: enabled): Display the midpoint and quarter levels.
Show Adaptive VWAP Fan (default: enabled): Toggle the VWAP channel for assets where volume distribution matters most.
Show Acceptance Flags (default: disabled): Turn the acceptance markers on/off for maximum visual control.
Show Range Dashboard (default: enabled): Disable if screen space is limited, re-enable during prep sessions.
ALERTS
The indicator includes five alert conditions:
Range High Tap: Price interacted with the RangeLattice high
Range Low Tap: Price interacted with the RangeLattice low
Range Mid Tap: Price interacted with the RangeLattice mid
Range Break Up: Confirmed upside breakout
Range Break Down: Confirmed downside breakout
Where it works best
This indicator works best on liquid instruments with clear structural levels. On very low timeframes (1-minute and below), the structure may update too frequently to be useful. The acceptance/break confirmation system requires patience—faster traders may find the multi-bar confirmation too slow for scalping. The VWAP fan is session-based and resets daily, which may not suit all trading styles.
在脚本中搜索"西班牙人VS奥萨苏纳"

Institutional VWAP Suite (Lite Compatible)The **Institutional VWAP Suite (Lite Compatible)** brings true institutional volume-weighted price analysis to every trader — even on TradingView Lite/Free accounts where standard VWAP tools are restricted.
This script recreates the most important VWAP models used by banks, funds, and high-frequency desks, including:
• **Daily VWAP** (exchange-accurate)
• **Weekly VWAP** (manually accumulated)
• **Monthly VWAP** (manually accumulated)
• **Rolling Window VWAP** (array-based, fully Lite-compatible)
All calculations avoid blocked functions like `ta.sum` or session-restricted VWAP calls. Everything is built manually from volume and price to ensure accuracy across all accounts and all markets.
### Features
• Multi-timeframe VWAPs (Daily/Weekly/Monthly)
• Manual Rolling VWAP with adjustable length
• Optional VWAP bands (Lite-safe)
• Clean visuals with color-coded levels
• Optimized arrays for fast, stable performance
• Free-tier compatible — no premium functions required
This tool is designed for traders who want institutional structure, premium-level VWAP calculations, and consistent execution regardless of plan level. Perfect for scalpers, day traders, futures traders, and anyone who uses intraday volume profiles.
### Recommended Use
• Map directional bias using Daily vs Weekly VWAP
• Use Monthly VWAP for macro trend context
• Track intraday mean reversion with Rolling VWAP
• Use VWAP bands as dynamic support/resistance zones
A simple, powerful, no-restrictions VWAP engine — built for everyone.

Ultimate RSI [captainua]Ultimate RSI
Overview
This indicator combines multiple RSI calculations with volume analysis, divergence detection, and trend filtering to provide a comprehensive RSI-based trading system. The script calculates RSI using three different periods (6, 14, 24) and applies various smoothing methods to reduce noise while maintaining responsiveness. The combination of these features creates a multi-layered confirmation system that reduces false signals by requiring alignment across multiple indicators and timeframes.
The script includes optimized configuration presets for instant setup: Scalping, Day Trading, Swing Trading, and Position Trading. Simply select a preset to instantly configure all settings for your trading style, or use Custom mode for full manual control. All settings include automatic input validation to prevent configuration errors and ensure optimal performance.
Configuration Presets
The script includes preset configurations optimized for different trading styles, allowing you to instantly configure the indicator for your preferred trading approach. Simply select a preset from the "Configuration Preset" dropdown menu:
- Scalping: Optimized for fast-paced trading with shorter RSI periods (4, 7, 9) and minimal smoothing. Noise reduction is automatically disabled, and momentum confirmation is disabled to allow faster signal generation. Designed for quick entries and exits in volatile markets.
- Day Trading: Balanced configuration for intraday trading with moderate RSI periods (6, 9, 14) and light smoothing. Momentum confirmation is enabled for better signal quality. Ideal for day trading strategies requiring timely but accurate signals.
- Swing Trading: Configured for medium-term positions with standard RSI periods (14, 14, 21) and moderate smoothing. Provides smoother signals suitable for swing trading timeframes. All noise reduction features remain active.
- Position Trading: Optimized for longer-term trades with extended RSI periods (24, 21, 28) and heavier smoothing. Filters are configured for highest-quality signals. Best for position traders holding trades over multiple days or weeks.
- Custom: Full manual control over all settings. All input parameters are available for complete customization. This is the default mode and maintains full backward compatibility with previous versions.
When a preset is selected, it automatically adjusts RSI periods, smoothing lengths, and filter settings to match the trading style. The preset configurations ensure optimal settings are applied instantly, eliminating the need for manual configuration. All settings can still be manually overridden if needed, providing flexibility while maintaining ease of use.
Input Validation and Error Prevention
The script includes comprehensive input validation to prevent configuration errors:
- Cross-Input Validation: Smoothing lengths are automatically validated to ensure they are always less than their corresponding RSI period length. If you set a smoothing length greater than or equal to the RSI length, the script automatically adjusts it to (RSI Length - 1). This prevents logical errors and ensures valid configurations.
- Input Range Validation: All numeric inputs have minimum and maximum value constraints enforced by TradingView's input system, preventing invalid parameter values.
- Smart Defaults: Preset configurations use validated default values that are tested and optimized for each trading style. When switching between presets, all related settings are automatically updated to maintain consistency.
Core Calculations
Multi-Period RSI:
The script calculates RSI using the standard Wilder's RSI formula: RSI = 100 - (100 / (1 + RS)), where RS = Average Gain / Average Loss over the specified period. Three separate RSI calculations run simultaneously:
- RSI(6): Uses 6-period lookback for high sensitivity to recent price changes, useful for scalping and early signal detection
- RSI(14): Standard 14-period RSI for balanced analysis, the most commonly used RSI period
- RSI(24): Longer 24-period RSI for trend confirmation, provides smoother signals with less noise
Each RSI can be smoothed using EMA, SMA, RMA (Wilder's smoothing), WMA, or Zero-Lag smoothing. Zero-Lag smoothing uses the formula: ZL-RSI = RSI + (RSI - RSI ) to reduce lag while maintaining signal quality. You can apply individual smoothing lengths to each RSI period, or use global smoothing where all three RSIs share the same smoothing length.
Dynamic Overbought/Oversold Thresholds:
Static thresholds (default 70/30) are adjusted based on market volatility using ATR. The formula: Dynamic OB = Base OB + (ATR × Volatility Multiplier × Base Percentage / 100), Dynamic OS = Base OS - (ATR × Volatility Multiplier × Base Percentage / 100). This adapts to volatile markets where traditional 70/30 levels may be too restrictive. During high volatility, the dynamic thresholds widen, and during low volatility, they narrow. The thresholds are clamped between 0-100 to remain within RSI bounds. The ATR is cached for performance optimization, updating on confirmed bars and real-time bars.
Adaptive RSI Calculation:
An adaptive RSI adjusts the standard RSI(14) based on current volatility relative to average volatility. The calculation: Adaptive Factor = (Current ATR / SMA of ATR over 20 periods) × Volatility Multiplier. If SMA of ATR is zero (edge case), the adaptive factor defaults to 0. The adaptive RSI = Base RSI × (1 + Adaptive Factor), clamped to 0-100. This makes the indicator more responsive during high volatility periods when traditional RSI may lag. The adaptive RSI is used for signal generation (buy/sell signals) but is not plotted on the chart.
Overbought/Oversold Fill Zones:
The script provides visual fill zones between the RSI line and the threshold lines when RSI is in overbought or oversold territory. The fill logic uses inclusive conditions: fills are shown when RSI is currently in the zone OR was in the zone on the previous bar. This ensures complete coverage of entry and exit boundaries. A minimum gap of 0.1 RSI points is maintained between the RSI plot and threshold line to ensure reliable polygon rendering in TradingView. The fill uses invisible plots at the threshold levels and the RSI value, with the fill color applied between them. You can select which RSI (6, 14, or 24) to use for the fill zones.
Divergence Detection
Regular Divergence:
Bullish divergence: Price makes a lower low (current low < lowest low from previous lookback period) while RSI makes a higher low (current RSI > lowest RSI from previous lookback period). Bearish divergence: Price makes a higher high (current high > highest high from previous lookback period) while RSI makes a lower high (current RSI < highest RSI from previous lookback period). The script compares current price/RSI values to the lowest/highest values from the previous lookback period using ta.lowest() and ta.highest() functions with index to reference the previous period's extreme.
Pivot-Based Divergence:
An enhanced divergence detection method that uses actual pivot points instead of simple lowest/highest comparisons. This provides more accurate divergence detection by identifying significant pivot lows/highs in both price and RSI. The pivot-based method uses a tolerance-based approach with configurable constants: 1% tolerance for price comparisons (priceTolerancePercent = 0.01) and 1.0 RSI point absolute tolerance for RSI comparisons (pivotTolerance = 1.0). Minimum divergence threshold is 1.0 RSI point (minDivergenceThreshold = 1.0). It looks for two recent pivot points and compares them: for bullish divergence, price makes a lower low (at least 1% lower) while RSI makes a higher low (at least 1.0 point higher). This method reduces false divergences by requiring actual pivot points rather than just any low/high within a period. When enabled, pivot-based divergence replaces the traditional method for more accurate signal generation.
Strong Divergence:
Regular divergence is confirmed by an engulfing candle pattern. Bullish engulfing requires: (1) Previous candle is bearish (close < open ), (2) Current candle is bullish (close > open), (3) Current close > previous open, (4) Current open < previous close. Bearish engulfing is the inverse: previous bullish, current bearish, current close < previous open, current open > previous close. Strong divergence signals are marked with visual indicators (🐂 for bullish, 🐻 for bearish) and have separate alert conditions.
Hidden Divergence:
Continuation patterns that signal trend continuation rather than reversal. Bullish hidden divergence: Price makes a higher low (current low > lowest low from previous period) but RSI makes a lower low (current RSI < lowest RSI from previous period). Bearish hidden divergence: Price makes a lower high (current high < highest high from previous period) but RSI makes a higher high (current RSI > highest RSI from previous period). These patterns indicate the trend is likely to continue in the current direction.
Volume Confirmation System
Volume threshold filtering requires current volume to exceed the volume SMA multiplied by the threshold factor. The formula: Volume Confirmed = Volume > (Volume SMA × Threshold). If the threshold is set to 0.1 or lower, volume confirmation is effectively disabled (always returns true). This allows you to use the indicator without volume filtering if desired.
Volume Climax is detected when volume exceeds: Volume SMA + (Volume StdDev × Multiplier). This indicates potential capitulation moments where extreme volume accompanies price movements. Volume Dry-Up is detected when volume falls below: Volume SMA - (Volume StdDev × Multiplier), indicating low participation periods that may produce unreliable signals. The volume SMA is cached for performance, updating on confirmed and real-time bars.
Multi-RSI Synergy
The script generates signals when multiple RSI periods align in overbought or oversold zones. This creates a confirmation system that reduces false signals. In "ALL" mode, all three RSIs (6, 14, 24) must be simultaneously above the overbought threshold OR all three must be below the oversold threshold. In "2-of-3" mode, any two of the three RSIs must align in the same direction. The script counts how many RSIs are in each zone: twoOfThreeOB = ((rsi6OB ? 1 : 0) + (rsi14OB ? 1 : 0) + (rsi24OB ? 1 : 0)) >= 2.
Synergy signals require: (1) Multi-RSI alignment (ALL or 2-of-3), (2) Volume confirmation, (3) Reset condition satisfied (enough bars since last synergy signal), (4) Additional filters passed (RSI50, Trend, ADX, Volume Dry-Up avoidance). Separate reset conditions track buy and sell signals independently. The reset condition uses ta.barssince() to count bars since the last trigger, returning true if the condition never occurred (allowing first signal) or if enough bars have passed.
Regression Forecasting
The script uses historical RSI values to forecast future RSI direction using four methods. The forecast horizon is configurable (1-50 bars ahead). Historical data is collected into an array, and regression coefficients are calculated based on the selected method.
Linear Regression: Calculates the least-squares fit line (y = mx + b) through the last N RSI values. The calculation: meanX = sumX / horizon, meanY = sumY / horizon, denominator = sumX² - horizon × meanX², m = (sumXY - horizon × meanX × meanY) / denominator, b = meanY - m × meanX. The forecast projects this line forward: forecast = b + m × i for i = 1 to horizon.
Polynomial Regression: Fits a quadratic curve (y = ax² + bx + c) to capture non-linear trends. The system of equations is solved using Cramer's rule with a 3×3 determinant. If the determinant is too small (< 0.0001), the system falls back to linear regression. Coefficients are calculated by solving: n×c + sumX×b + sumX²×a = sumY, sumX×c + sumX²×b + sumX³×a = sumXY, sumX²×c + sumX³×b + sumX⁴×a = sumX²Y. Note: Due to the O(n³) computational complexity of polynomial regression, the forecast horizon is automatically limited to a maximum of 20 bars when using polynomial regression to maintain optimal performance. If you set a horizon greater than 20 bars with polynomial regression, it will be automatically capped at 20 bars.
Exponential Smoothing: Applies exponential smoothing with adaptive alpha = 2/(horizon+1). The smoothing iterates from oldest to newest value: smoothed = alpha × series + (1 - alpha) × smoothed. Trend is calculated by comparing current smoothed value to an earlier smoothed value (at 60% of horizon): trend = (smoothed - earlierSmoothed) / (horizon - earlierIdx). Forecast: forecast = base + trend × i.
Moving Average: Uses the difference between short MA (horizon/2) and long MA (horizon) to estimate trend direction. Trend = (maShort - maLong) / (longLen - shortLen). Forecast: forecast = maShort + trend × i.
Confidence bands are calculated using RMSE (Root Mean Squared Error) of historical forecast accuracy. The error calculation compares historical values with forecast values: RMSE = sqrt(sumSquaredError / count). If insufficient data exists, it falls back to calculating standard deviation of recent RSI values. Confidence bands = forecast ± (RMSE × confidenceLevel). All forecast values and confidence bands are clamped to 0-100 to remain within RSI bounds. The regression functions include comprehensive safety checks: horizon validation (must not exceed array size), empty array handling, edge case handling for horizon=1 scenarios, division-by-zero protection, and bounds checking for all array access operations to prevent runtime errors.
Strong Top/Bottom Detection
Strong buy signals require three conditions: (1) RSI is at its lowest point within the bottom period: rsiVal <= ta.lowest(rsiVal, bottomPeriod), (2) RSI is below the oversold threshold minus a buffer: rsiVal < (oversoldThreshold - rsiTopBottomBuffer), where rsiTopBottomBuffer = 2.0 RSI points, (3) The absolute difference between current RSI and the lowest RSI exceeds the threshold value: abs(rsiVal - ta.lowest(rsiVal, bottomPeriod)) > threshold. This indicates a bounce from extreme levels with sufficient distance from the absolute low.
Strong sell signals use the inverse logic: RSI at highest point, above overbought threshold + rsiTopBottomBuffer (2.0 RSI points), and difference from highest exceeds threshold. Both signals also require: volume confirmation, reset condition satisfied (separate reset for buy vs sell), and all additional filters passed (RSI50, Trend, ADX, Volume Dry-Up avoidance).
The reset condition uses separate logic for buy and sell: resetCondBuy checks bars since isRSIAtBottom, resetCondSell checks bars since isRSIAtTop. This ensures buy signals reset based on bottom conditions and sell signals reset based on top conditions, preventing incorrect signal blocking.
Filtering System
RSI(50) Filter: Only allows buy signals when RSI(14) > 50 (bullish momentum) and sell signals when RSI(14) < 50 (bearish momentum). This filter ensures you're buying in uptrends and selling in downtrends from a momentum perspective. The filter is optional and can be disabled. Recommended to enable for noise reduction.
Trend Filter: Uses a long-term EMA (default 200) to determine trend direction. Buy signals require price above EMA, sell signals require price below EMA. The EMA slope is calculated as: emaSlope = ema - ema . Optional EMA slope filter additionally requires the EMA to be rising (slope > 0) for buy signals or falling (slope < 0) for sell signals. This provides stronger trend confirmation by requiring both price position and EMA direction.
ADX Filter: Uses the Directional Movement Index (calculated via ta.dmi()) to measure trend strength. Signals only fire when ADX exceeds the threshold (default 20), indicating a strong trend rather than choppy markets. The ADX calculation uses separate length and smoothing parameters. This filter helps avoid signals during sideways/consolidation periods.
Volume Dry-Up Avoidance: Prevents signals during periods of extremely low volume relative to average. If volume dry-up is detected and the filter is enabled, signals are blocked. This helps avoid unreliable signals that occur during low participation periods.
RSI Momentum Confirmation: Requires RSI to be accelerating in the signal direction before confirming signals. For buy signals, RSI must be consistently rising (recovering from oversold) over the lookback period. For sell signals, RSI must be consistently falling (declining from overbought) over the lookback period. The momentum check verifies that all consecutive changes are in the correct direction AND the cumulative change is significant. This filter ensures signals only fire when RSI momentum aligns with the signal direction, reducing false signals from weak momentum.
Multi-Timeframe Confirmation: Requires higher timeframe RSI to align with the signal direction. For buy signals, current RSI must be below the higher timeframe RSI by at least the confirmation threshold. For sell signals, current RSI must be above the higher timeframe RSI by at least the confirmation threshold. This ensures signals align with the larger trend context, reducing counter-trend trades. The higher timeframe RSI is fetched using request.security() from the selected timeframe.
All filters use the pattern: filterResult = not filterEnabled OR conditionMet. This means if a filter is disabled, it always passes (returns true). Filters can be combined, and all must pass for a signal to fire.
RSI Centerline and Period Crossovers
RSI(50) Centerline Crossovers: Detects when the selected RSI source crosses above or below the 50 centerline. Bullish crossover: ta.crossover(rsiSource, 50), bearish crossover: ta.crossunder(rsiSource, 50). You can select which RSI (6, 14, or 24) to use for these crossovers. These signals indicate momentum shifts from bearish to bullish (above 50) or bullish to bearish (below 50).
RSI Period Crossovers: Detects when different RSI periods cross each other. Available pairs: RSI(6) × RSI(14), RSI(14) × RSI(24), or RSI(6) × RSI(24). Bullish crossover: fast RSI crosses above slow RSI (ta.crossover(rsiFast, rsiSlow)), indicating momentum acceleration. Bearish crossover: fast RSI crosses below slow RSI (ta.crossunder(rsiFast, rsiSlow)), indicating momentum deceleration. These crossovers can signal shifts in momentum before price moves.
StochRSI Calculation
Stochastic RSI applies the Stochastic oscillator formula to RSI values instead of price. The calculation: %K = ((RSI - Lowest RSI) / (Highest RSI - Lowest RSI)) × 100, where the lookback is the StochRSI length. If the range is zero, %K defaults to 50.0. %K is then smoothed using SMA with the %K smoothing length. %D is calculated as SMA of smoothed %K with the %D smoothing length. All values are clamped to 0-100. You can select which RSI (6, 14, or 24) to use as the source for StochRSI calculation.
RSI Bollinger Bands
Bollinger Bands are applied to RSI(14) instead of price. The calculation: Basis = SMA(RSI(14), BB Period), StdDev = stdev(RSI(14), BB Period), Upper = Basis + (StdDev × Deviation Multiplier), Lower = Basis - (StdDev × Deviation Multiplier). This creates dynamic zones around RSI that adapt to RSI volatility. When RSI touches or exceeds the bands, it indicates extreme conditions relative to recent RSI behavior.
Noise Reduction System
The script includes a comprehensive noise reduction system to filter false signals and improve accuracy. When enabled, signals must pass multiple quality checks:
Signal Strength Requirement: RSI must be at least X points away from the centerline (50). For buy signals, RSI must be at least X points below 50. For sell signals, RSI must be at least X points above 50. This ensures signals only trigger when RSI is significantly in oversold/overbought territory, not just near neutral.
Extreme Zone Requirement: RSI must be deep in the OB/OS zone. For buy signals, RSI must be at least X points below the oversold threshold. For sell signals, RSI must be at least X points above the overbought threshold. This ensures signals only fire in extreme conditions where reversals are more likely.
Consecutive Bar Confirmation: The signal condition must persist for N consecutive bars before triggering. This reduces false signals from single-bar spikes or noise. The confirmation checks that the signal condition was true for all bars in the lookback period.
Zone Persistence (Optional): Requires RSI to remain in the OB/OS zone for N consecutive bars, not just touch it. This ensures RSI is truly in an extreme state rather than just briefly touching the threshold. When enabled, this provides stricter filtering for higher-quality signals.
RSI Slope Confirmation (Optional): Requires RSI to be moving in the expected signal direction. For buy signals, RSI should be rising (recovering from oversold). For sell signals, RSI should be falling (declining from overbought). This ensures momentum is aligned with the signal direction. The slope is calculated by comparing current RSI to RSI N bars ago.
All noise reduction filters can be enabled/disabled independently, allowing you to customize the balance between signal frequency and accuracy. The default settings provide a good balance, but you can adjust them based on your trading style and market conditions.
Alert System
The script includes separate alert conditions for each signal type: buy/sell (adaptive RSI crossovers), divergence (regular, strong, hidden), crossovers (RSI50 centerline, RSI period crossovers), synergy signals, and trend breaks. Each alert type has its own alertcondition() declaration with a unique title and message.
An optional cooldown system prevents alert spam by requiring a minimum number of bars between alerts of the same type. The cooldown check: canAlert = na(lastAlertBar) OR (bar_index - lastAlertBar >= cooldownBars). If the last alert bar is na (first alert), it always allows the alert. Each alert type maintains its own lastAlertBar variable, so cooldowns are independent per signal type. The default cooldown is 10 bars, which is recommended for noise reduction.
Higher Timeframe RSI
The script can display RSI from a higher timeframe using request.security(). This allows you to see the RSI context from a larger timeframe (e.g., daily RSI on an hourly chart). The higher timeframe RSI uses RSI(14) calculation from the selected timeframe. This provides context for the current timeframe's RSI position relative to the larger trend.
RSI Pivot Trendlines
The script can draw trendlines connecting pivot highs and lows on RSI(6). This feature helps visualize RSI trends and identify potential trend breaks.
Pivot Detection: Pivots are detected using a configurable period. The script can require pivots to have minimum strength (RSI points difference from surrounding bars) to filter out weak pivots. Lower minPivotStrength values detect more pivots (more trendlines), while higher values detect only stronger pivots (fewer but more significant trendlines). Pivot confirmation is optional: when enabled, the script waits N bars to confirm the pivot remains the extreme, reducing repainting. Pivot confirmation functions (f_confirmPivotLow and f_confirmPivotHigh) are always called on every bar for consistency, as recommended by TradingView. When pivot bars are not available (na), safe default values are used, and the results are then used conditionally based on confirmation settings. This ensures consistent calculations and prevents calculation inconsistencies.
Trendline Drawing: Uptrend lines connect confirmed pivot lows (green), and downtrend lines connect confirmed pivot highs (red). By default, only the most recent trendline is shown (old trendlines are deleted when new pivots are confirmed). This keeps the chart clean and uncluttered. If "Keep Historical Trendlines" is enabled, the script preserves up to N historical trendlines (configurable via "Max Trendlines to Keep", default 5). When historical trendlines are enabled, old trendlines are saved to arrays instead of being deleted, allowing you to see multiple trendlines simultaneously for better trend analysis. The arrays are automatically limited to prevent memory accumulation.
Trend Break Detection: Signals are generated when RSI breaks above or below trendlines. Uptrend breaks (RSI crosses below uptrend line) generate buy signals. Downtrend breaks (RSI crosses above downtrend line) generate sell signals. Optional trend break confirmation requires the break to persist for N bars and optionally include volume confirmation. Trendline angle filtering can exclude flat/weak trendlines from generating signals (minTrendlineAngle > 0 filters out weak/flat trendlines).
How Components Work Together
The combination of multiple RSI periods provides confirmation across different timeframes, reducing false signals. RSI(6) catches early moves, RSI(14) provides balanced signals, and RSI(24) confirms longer-term trends. When all three align (synergy), it indicates strong consensus across timeframes.
Volume confirmation ensures signals occur with sufficient market participation, filtering out low-volume false breakouts. Volume climax detection identifies potential reversal points, while volume dry-up avoidance prevents signals during unreliable low-volume periods.
Trend filters align signals with the overall market direction. The EMA filter ensures you're trading with the trend, and the EMA slope filter adds an additional layer by requiring the trend to be strengthening (rising EMA for buys, falling EMA for sells).
ADX filter ensures signals only fire during strong trends, avoiding choppy/consolidation periods. RSI(50) filter ensures momentum alignment with the trade direction.
Momentum confirmation requires RSI to be accelerating in the signal direction, ensuring signals only fire when momentum is aligned. Multi-timeframe confirmation ensures signals align with higher timeframe trends, reducing counter-trend trades.
Divergence detection identifies potential reversals before they occur, providing early warning signals. Pivot-based divergence provides more accurate detection by using actual pivot points. Hidden divergence identifies continuation patterns, useful for trend-following strategies.
The noise reduction system combines multiple filters (signal strength, extreme zone, consecutive bars, zone persistence, RSI slope) to significantly reduce false signals. These filters work together to ensure only high-quality signals are generated.
The synergy system requires alignment across all RSI periods for highest-quality signals, significantly reducing false positives. Regression forecasting provides forward-looking context, helping anticipate potential RSI direction changes.
Pivot trendlines provide visual trend analysis and can generate signals when RSI breaks trendlines, indicating potential reversals or continuations.
Reset conditions prevent signal spam by requiring a minimum number of bars between signals. Separate reset conditions for buy and sell signals ensure proper signal management.
Usage Instructions
Configuration Presets (Recommended): The script includes optimized preset configurations for instant setup. Simply select your trading style from the "Configuration Preset" dropdown:
- Scalping Preset: RSI(4, 7, 9) with minimal smoothing. Noise reduction disabled, momentum confirmation disabled for fastest signals.
- Day Trading Preset: RSI(6, 9, 14) with light smoothing. Momentum confirmation enabled for better signal quality.
- Swing Trading Preset: RSI(14, 14, 21) with moderate smoothing. Balanced configuration for medium-term trades.
- Position Trading Preset: RSI(24, 21, 28) with heavier smoothing. Optimized for longer-term positions with all filters active.
- Custom Mode: Full manual control over all settings. Default behavior matches previous script versions.
Presets automatically configure RSI periods, smoothing lengths, and filter settings. You can still manually adjust any setting after selecting a preset if needed.
Getting Started: The easiest way to get started is to select a configuration preset matching your trading style (Scalping, Day Trading, Swing Trading, or Position Trading) from the "Configuration Preset" dropdown. This instantly configures all settings for optimal performance. Alternatively, use "Custom" mode for full manual control. The default configuration (Custom mode) shows RSI(6), RSI(14), and RSI(24) with their default smoothing. Overbought/oversold fill zones are enabled by default.
Customizing RSI Periods: Adjust the RSI lengths (6, 14, 24) based on your trading timeframe. Shorter periods (6) for scalping, standard (14) for day trading, longer (24) for swing trading. You can disable any RSI period you don't need.
Smoothing Selection: Choose smoothing method based on your needs. EMA provides balanced smoothing, RMA (Wilder's) is traditional, Zero-Lag reduces lag but may increase noise. Adjust smoothing lengths individually or use global smoothing for consistency. Note: Smoothing lengths are automatically validated to ensure they are always less than the corresponding RSI period length. If you set smoothing >= RSI length, it will be auto-adjusted to prevent invalid configurations.
Dynamic OB/OS: The dynamic thresholds automatically adapt to volatility. Adjust the volatility multiplier and base percentage to fine-tune sensitivity. Higher values create wider thresholds in volatile markets.
Volume Confirmation: Set volume threshold to 1.2 (default) for standard confirmation, higher for stricter filtering, or 0.1 to disable volume filtering entirely.
Multi-RSI Synergy: Use "ALL" mode for highest-quality signals (all 3 RSIs must align), or "2-of-3" mode for more frequent signals. Adjust the reset period to control signal frequency.
Filters: Enable filters gradually to find your preferred balance. Start with volume confirmation, then add trend filter, then ADX for strongest confirmation. RSI(50) filter is useful for momentum-based strategies and is recommended for noise reduction. Momentum confirmation and multi-timeframe confirmation add additional layers of accuracy but may reduce signal frequency.
Noise Reduction: The noise reduction system is enabled by default with balanced settings. Adjust minSignalStrength (default 3.0) to control how far RSI must be from centerline. Increase requireConsecutiveBars (default 1) to require signals to persist longer. Enable requireZonePersistence and requireRsiSlope for stricter filtering (higher quality but fewer signals). Start with defaults and adjust based on your needs.
Divergence: Enable divergence detection and adjust lookback periods. Strong divergence (with engulfing confirmation) provides higher-quality signals. Hidden divergence is useful for trend-following strategies. Enable pivot-based divergence for more accurate detection using actual pivot points instead of simple lowest/highest comparisons. Pivot-based divergence uses tolerance-based matching (1% for price, 1.0 RSI point for RSI) for better accuracy.
Forecasting: Enable regression forecasting to see potential RSI direction. Linear regression is simplest, polynomial captures curves, exponential smoothing adapts to trends. Adjust horizon based on your trading timeframe. Confidence bands show forecast uncertainty - wider bands indicate less reliable forecasts.
Pivot Trendlines: Enable pivot trendlines to visualize RSI trends and identify trend breaks. Adjust pivot detection period (default 5) - higher values detect fewer but stronger pivots. Enable pivot confirmation (default ON) to reduce repainting. Set minPivotStrength (default 1.0) to filter weak pivots - lower values detect more pivots (more trendlines), higher values detect only stronger pivots (fewer trendlines). Enable "Keep Historical Trendlines" to preserve multiple trendlines instead of just the most recent one. Set "Max Trendlines to Keep" (default 5) to control how many historical trendlines are preserved. Enable trend break confirmation for more reliable break signals. Adjust minTrendlineAngle (default 0.0) to filter flat trendlines - set to 0.1-0.5 to exclude weak trendlines.
Alerts: Set up alerts for your preferred signal types. Enable cooldown to prevent alert spam. Each signal type has its own alert condition, so you can be selective about which signals trigger alerts.
Visual Elements and Signal Markers
The script uses various visual markers to indicate signals and conditions:
- "sBottom" label (green): Strong bottom signal - RSI at extreme low with strong buy conditions
- "sTop" label (red): Strong top signal - RSI at extreme high with strong sell conditions
- "SyBuy" label (lime): Multi-RSI synergy buy signal - all RSIs aligned oversold
- "SySell" label (red): Multi-RSI synergy sell signal - all RSIs aligned overbought
- 🐂 emoji (green): Strong bullish divergence detected
- 🐻 emoji (red): Strong bearish divergence detected
- 🔆 emoji: Weak divergence signals (if enabled)
- "H-Bull" label: Hidden bullish divergence
- "H-Bear" label: Hidden bearish divergence
- ⚡ marker (top of pane): Volume climax detected (extreme volume) - positioned at top for visibility
- 💧 marker (top of pane): Volume dry-up detected (very low volume) - positioned at top for visibility
- ↑ triangle (lime): Uptrend break signal - RSI breaks below uptrend line
- ↓ triangle (red): Downtrend break signal - RSI breaks above downtrend line
- Triangle up (lime): RSI(50) bullish crossover
- Triangle down (red): RSI(50) bearish crossover
- Circle markers: RSI period crossovers
All markers are positioned at the RSI value where the signal occurs, using location.absolute for precise placement.
Signal Priority and Interpretation
Signals are generated independently and can occur simultaneously. Higher-priority signals generally indicate stronger setups:
1. Multi-RSI Synergy signals (SyBuy/SySell) - Highest priority: Requires alignment across all RSI periods plus volume and filter confirmation. These are the most reliable signals.
2. Strong Top/Bottom signals (sTop/sBottom) - High priority: Indicates extreme RSI levels with strong bounce conditions. Requires volume confirmation and all filters.
3. Divergence signals - Medium-High priority: Strong divergence (with engulfing) is more reliable than regular divergence. Hidden divergence indicates continuation rather than reversal.
4. Adaptive RSI crossovers - Medium priority: Buy when adaptive RSI crosses below dynamic oversold, sell when it crosses above dynamic overbought. These use volatility-adjusted RSI for more accurate signals.
5. RSI(50) centerline crossovers - Medium priority: Momentum shift signals. Less reliable alone but useful when combined with other confirmations.
6. RSI period crossovers - Lower priority: Early momentum shift indicators. Can provide early warning but may produce false signals in choppy markets.
Best practice: Wait for multiple confirmations. For example, a synergy signal combined with divergence and volume climax provides the strongest setup.
Chart Requirements
For proper script functionality and compliance with TradingView requirements, ensure your chart displays:
- Symbol name: The trading pair or instrument name should be visible
- Timeframe: The chart timeframe should be clearly displayed
- Script name: "Ultimate RSI " should be visible in the indicator title
These elements help traders understand what they're viewing and ensure proper script identification. The script automatically includes this information in the indicator title and chart labels.
Performance Considerations
The script is optimized for performance:
- ATR and Volume SMA are cached using var variables, updating only on confirmed and real-time bars to reduce redundant calculations
- Forecast line arrays are dynamically managed: lines are reused when possible, and unused lines are deleted to prevent memory accumulation
- Calculations use efficient Pine Script functions (ta.rsi, ta.ema, etc.) which are optimized by TradingView
- Array operations are minimized where possible, with direct calculations preferred
- Polynomial regression automatically caps the forecast horizon at 20 bars (POLYNOMIAL_MAX_HORIZON constant) to prevent performance degradation, as polynomial regression has O(n³) complexity. This safeguard ensures optimal performance even with large horizon settings
- Pivot detection includes edge case handling to ensure reliable calculations even on early bars with limited historical data. Regression forecasting functions include comprehensive safety checks: horizon validation (must not exceed array size), empty array handling, edge case handling for horizon=1 scenarios, and division-by-zero protection in all mathematical operations
The script should perform well on all timeframes. On very long historical data, forecast lines may accumulate if the horizon is large; consider reducing the forecast horizon if you experience performance issues. The polynomial regression performance safeguard automatically prevents performance issues for that specific regression type.
Known Limitations and Considerations
- Forecast lines are forward-looking projections and should not be used as definitive predictions. They provide context but are not guaranteed to be accurate.
- Dynamic OB/OS thresholds can exceed 100 or go below 0 in extreme volatility scenarios, but are clamped to 0-100 range. This means in very volatile markets, the dynamic thresholds may not widen as much as the raw calculation suggests.
- Volume confirmation requires sufficient historical volume data. On new instruments or very short timeframes, volume calculations may be less reliable.
- Higher timeframe RSI uses request.security() which may have slight delays on some data feeds.
- Regression forecasting requires at least N bars of history (where N = forecast horizon) before it can generate forecasts. Early bars will not show forecast lines.
- StochRSI calculation requires the selected RSI source to have sufficient history. Very short RSI periods on new charts may produce less reliable StochRSI values initially.
Practical Use Cases
The indicator can be configured for different trading styles and timeframes:
Swing Trading: Select the "Swing Trading" preset for instant optimal configuration. This preset uses RSI periods (14, 14, 21) with moderate smoothing. Alternatively, manually configure: Use RSI(24) with Multi-RSI Synergy in "ALL" mode, combined with trend filter (EMA 200) and ADX filter. This configuration provides high-probability setups with strong confirmation across multiple RSI periods.
Day Trading: Select the "Day Trading" preset for instant optimal configuration. This preset uses RSI periods (6, 9, 14) with light smoothing and momentum confirmation enabled. Alternatively, manually configure: Use RSI(6) with Zero-Lag smoothing for fast signal detection. Enable volume confirmation with threshold 1.2-1.5 for reliable entries. Combine with RSI(50) filter to ensure momentum alignment. Strong top/bottom signals work well for day trading reversals.
Trend Following: Enable trend filter (EMA) and EMA slope filter for strong trend confirmation. Use RSI(14) or RSI(24) with ADX filter to avoid choppy markets. Hidden divergence signals are useful for trend continuation entries.
Reversal Trading: Focus on divergence detection (regular and strong) combined with strong top/bottom signals. Enable volume climax detection to identify capitulation moments. Use RSI(6) for early reversal signals, confirmed by RSI(14) and RSI(24).
Forecasting and Planning: Enable regression forecasting with polynomial or exponential smoothing methods. Use forecast horizon of 10-20 bars for swing trading, 5-10 bars for day trading. Confidence bands help assess forecast reliability.
Multi-Timeframe Analysis: Enable higher timeframe RSI to see context from larger timeframes. For example, use daily RSI on hourly charts to understand the larger trend context. This helps avoid counter-trend trades.
Scalping: Select the "Scalping" preset for instant optimal configuration. This preset uses RSI periods (4, 7, 9) with minimal smoothing, disables noise reduction, and disables momentum confirmation for faster signals. Alternatively, manually configure: Use RSI(6) with minimal smoothing (or Zero-Lag) for ultra-fast signals. Disable most filters except volume confirmation. Use RSI period crossovers (RSI(6) × RSI(14)) for early momentum shifts. Set volume threshold to 1.0-1.2 for less restrictive filtering.
Position Trading: Select the "Position Trading" preset for instant optimal configuration. This preset uses extended RSI periods (24, 21, 28) with heavier smoothing, optimized for longer-term trades. Alternatively, manually configure: Use RSI(24) with all filters enabled (Trend, ADX, RSI(50), Volume Dry-Up avoidance). Multi-RSI Synergy in "ALL" mode provides highest-quality signals.
Practical Tips and Best Practices
Getting Started: The fastest way to get started is to select a configuration preset that matches your trading style. Simply choose "Scalping", "Day Trading", "Swing Trading", or "Position Trading" from the "Configuration Preset" dropdown to instantly configure all settings optimally. For advanced users, use "Custom" mode for full manual control. The default configuration (Custom mode) is balanced and works well across different markets. After observing behavior, customize settings to match your trading style.
Reducing Repainting: All signals are based on confirmed bars, minimizing repainting. The script uses confirmed bar data for all calculations to ensure backtesting accuracy.
Signal Quality: Multi-RSI Synergy signals in "ALL" mode provide the highest-quality signals because they require alignment across all three RSI periods. These signals have lower frequency but higher reliability. For more frequent signals, use "2-of-3" mode. The noise reduction system further improves signal quality by requiring multiple confirmations (signal strength, extreme zone, consecutive bars, optional zone persistence and RSI slope). Adjust noise reduction settings to balance signal frequency vs. accuracy.
Filter Combinations: Start with volume confirmation, then add trend filter for trend alignment, then ADX filter for trend strength. Combining all three filters significantly reduces false signals but also reduces signal frequency. Find your balance based on your risk tolerance.
Volume Filtering: Set volume threshold to 0.1 or lower to effectively disable volume filtering if you trade instruments with unreliable volume data or want to test without volume confirmation. Standard confirmation uses 1.2-1.5 threshold.
RSI Period Selection: RSI(6) is most sensitive and best for scalping or early signal detection. RSI(14) provides balanced signals suitable for day trading. RSI(24) is smoother and better for swing trading and trend confirmation. You can disable any RSI period you don't need to reduce visual clutter.
Smoothing Methods: EMA provides balanced smoothing with moderate lag. RMA (Wilder's smoothing) is traditional and works well for RSI. Zero-Lag reduces lag but may increase noise. WMA gives more weight to recent values. Choose based on your preference for responsiveness vs. smoothness.
Forecasting: Linear regression is simplest and works well for trending markets. Polynomial regression captures curves and works better in ranging markets. Exponential smoothing adapts to trends. Moving average method is most conservative. Use confidence bands to assess forecast reliability.
Divergence: Strong divergence (with engulfing confirmation) is more reliable than regular divergence. Hidden divergence indicates continuation rather than reversal, useful for trend-following strategies. Pivot-based divergence provides more accurate detection by using actual pivot points instead of simple lowest/highest comparisons. Adjust lookback periods based on your timeframe: shorter for day trading, longer for swing trading. Pivot divergence period (default 5) controls the sensitivity of pivot detection.
Dynamic Thresholds: Dynamic OB/OS thresholds automatically adapt to volatility. In volatile markets, thresholds widen; in calm markets, they narrow. Adjust the volatility multiplier and base percentage to fine-tune sensitivity. Higher values create wider thresholds in volatile markets.
Alert Management: Enable alert cooldown (default 10 bars, recommended) to prevent alert spam. Each alert type has its own cooldown, so you can set different cooldowns for different signal types. For example, use shorter cooldown for synergy signals (high quality) and longer cooldown for crossovers (more frequent). The cooldown system works independently for each signal type, preventing spam while allowing different signal types to fire when appropriate.
Technical Specifications
- Pine Script Version: v6
- Indicator Type: Non-overlay (displays in separate panel below price chart)
- Repainting Behavior: Minimal - all signals are based on confirmed bars, ensuring accurate backtesting results
- Performance: Optimized with caching for ATR and volume calculations. Forecast arrays are dynamically managed to prevent memory accumulation.
- Compatibility: Works on all timeframes (1 minute to 1 month) and all instruments (stocks, forex, crypto, futures, etc.)
- Edge Case Handling: All calculations include safety checks for division by zero, NA values, and boundary conditions. Reset conditions and alert cooldowns handle edge cases where conditions never occurred or values are NA.
- Reset Logic: Separate reset conditions for buy signals (based on bottom conditions) and sell signals (based on top conditions) ensure logical correctness.
- Input Parameters: 60+ customizable parameters organized into logical groups for easy configuration. Configuration presets available for instant setup (Scalping, Day Trading, Swing Trading, Position Trading, Custom).
- Noise Reduction: Comprehensive noise reduction system with multiple filters (signal strength, extreme zone, consecutive bars, zone persistence, RSI slope) to reduce false signals.
- Pivot-Based Divergence: Enhanced divergence detection using actual pivot points for improved accuracy.
- Momentum Confirmation: RSI momentum filter ensures signals only fire when RSI is accelerating in the signal direction.
- Multi-Timeframe Confirmation: Optional higher timeframe RSI alignment for trend confirmation.
- Enhanced Pivot Trendlines: Trendline drawing with strength requirements, confirmation, and trend break detection.
Technical Notes
- All RSI values are clamped to 0-100 range to ensure valid oscillator values
- ATR and Volume SMA are cached for performance, updating on confirmed and real-time bars
- Reset conditions handle edge cases: if a condition never occurred, reset returns true (allows first signal)
- Alert cooldown handles na values: if no previous alert, cooldown allows the alert
- Forecast arrays are dynamically sized based on horizon, with unused lines cleaned up
- Fill logic uses a minimum gap (0.1) to ensure reliable polygon rendering in TradingView
- All calculations include safety checks for division by zero and boundary conditions. Regression functions validate that horizon doesn't exceed array size, and all array access operations include bounds checking to prevent out-of-bounds errors
- The script uses separate reset conditions for buy signals (based on bottom conditions) and sell signals (based on top conditions) for logical correctness
- Background coloring uses a fallback system: dynamic color takes priority, then RSI(6) heatmap, then monotone if both are disabled
- Noise reduction filters are applied after accuracy filters, providing multiple layers of signal quality control
- Pivot trendlines use strength requirements to filter weak pivots, reducing noise in trendline drawing. Historical trendlines are stored in arrays and automatically limited to prevent memory accumulation when "Keep Historical Trendlines" is enabled
- Volume climax and dry-up markers are positioned at the top of the pane for better visibility
- All calculations are optimized with conditional execution - features only calculate when enabled (performance optimization)
- Input Validation: Automatic cross-input validation ensures smoothing lengths are always less than RSI period lengths, preventing configuration errors
- Configuration Presets: Four optimized preset configurations (Scalping, Day Trading, Swing Trading, Position Trading) for instant setup, plus Custom mode for full manual control
- Constants Management: Magic numbers extracted to documented constants for improved maintainability and easier tuning (pivot tolerance, divergence thresholds, fill gap, etc.)
- TradingView Function Consistency: All TradingView functions (ta.crossover, ta.crossunder, ta.atr, ta.lowest, ta.highest, ta.lowestbars, ta.highestbars, etc.) and custom functions that depend on historical results (f_consecutiveBarConfirmation, f_rsiSlopeConfirmation, f_rsiZonePersistence, f_applyAllFilters, f_rsiMomentum, f_forecast, f_confirmPivotLow, f_confirmPivotHigh) are called on every bar for consistency, as recommended by TradingView. Results are then used conditionally when needed. This ensures consistent calculations and prevents calculation inconsistencies.

FluxPulse Beacon## FluxPulse Beacon
FluxPulse Beacon applies a microstructure lens to every bar, combining directional thrust, realized volatility, and multi-timeframe liquidity checks to decide whether the tape is being pushed by real sponsorship or just noise. The oscillator's color-coded columns and adaptive burst thresholds transform complex flow dynamics into a single actionable flux score for futures and equities traders.
HOW IT WORKS
Momentum Extraction – Price differentials over a configurable pulse distance are smoothed using exponential moving averages to isolate directional thrust without reacting to single prints.
Volatility + Liquidity Normalization – The momentum stream is divided by realized volatility and multiplied by both local and higher-timeframe EMA volume ratios, ensuring pulses only appear when volatility and liquidity align.
Adaptive Thresholding – A volatility-derived standard deviation of flux is blended with the base threshold so bursts scale automatically between low-volatility and high-volatility market conditions.
Divergence Engine – Linear regression slopes compare price vs. flux to tag bullish/bearish divergences, highlighting stealth accumulation or distribution zones.
HOW TO USE IT
Continuation Entries : Go with the trend when histogram bars stay above the adaptive threshold, the signal line confirms, and trend bias agrees—this is where liquidity-backed follow-through lives.
Fade Plays : Watch for divergence alerts and shrinking compression values; when flux prints below zero yet price grinds higher, hidden selling pressure often precedes rollovers.
Session Filter : Compression percentage in the diagnostics table instantly tells you whether to trade thin overnight sessions—low compression means stand down.
VISUAL FEATURES
Dynamic background heat maps flux magnitude, while threshold lines provide a quick read on whether a pulse is statistically significant.
Diagnostics table displays live flux, signal, adaptive threshold, and compression for quick reference.
Alert-first workflow: The surface is intentionally clean—bursts and divergences are delivered via alerts instead of on-chart clutter.
PARAMETERS
Trend EMA Length (default: 34): Defines the macro bias anchor; increase for higher-timeframe confirmation.
Pulse Distance (default: 8): Controls how sensitive momentum extraction becomes.
Volatility Window (default: 21): Sample window for realized volatility normalization.
Liquidity Window (default: 55): Volume smoothing window that proxies liquidity expansion.
Liquidity Reference TF (default: 60): Select a higher timeframe to cross-check whether current volume matches institutional flows.
Adaptive Threshold (default: enabled): Disable for fixed thresholds on slower markets; enable for high-volatility assets.
Base Burst Threshold (default: 1.25): Minimum flux magnitude that qualifies as an actionable pulse.
ALERTS
The indicator includes four alert conditions:
Bull Burst: Detects upside liquidity pulses
Bear Burst: Detects downside liquidity pulses
Bull Divergence: Flags bullish delta divergence
Bear Divergence: Flags bearish delta divergence
LIMITATIONS
This indicator is designed for liquid futures and equity markets. Performance may degrade in low-volume or highly illiquid instruments. The adaptive threshold system works best on timeframes where sufficient volatility history exists (typically 15-minute charts and above). Divergence signals are probabilistic and should be confirmed with price action.
INSERT_CHART_SNAPSHOT_URL_HERE
---
## RangeLattice Mapper
RangeLattice Mapper constructs a higher-timeframe scaffolding on any intraday chart, locking in structural highs/lows, mid/quarter grids, VWAP confluence, and live acceptance/break analytics. It provides a non-repainting overlay that turns range management into a disciplined process.
HOW IT WORKS
Structure Harvesting – Using request.security() , the script samples highs/lows from a user-selected timeframe (default 240 minutes) over a configurable lookback to establish the dominant range.
Grid Construction – Midpoint and quarter levels are derived mathematically, mirroring how institutional traders map distribution/accumulation zones.
Acceptance Detection – Consecutive closes inside the range flip an acceptance flag and darken the cloud, signaling balanced auction conditions.
Break Confirmation – Multi-bar closes outside the structure raise break labels and alerts, filtering the countless fake-outs that plague breakout traders.
VWAP Fan Overlay – Session VWAP plus ATR-based bands provide a live measure of flow centering relative to the lattice.
HOW TO USE IT
Range Plays : Fade taps of the outer rails only when acceptance is active and VWAP sits inside the grid—this is where mean-reversion works best.
Breakout Plays : Wait for confirmed break labels before entering expansion trades; the dashboard's Width/ATR metric tells you if the expansion has enough fuel.
Market Prep : Carry the same lattice from pre-market into regular trading hours by keeping the structure timeframe fixed; alerts keep you notified even when managing multiple tickers.
VISUAL FEATURES
Range Tap and Mid Pivot markers provide a tape-reading breadcrumb trail for journaling.
Cloud fill opacity tightens when acceptance persists, visually signaling balance compressions ready to break.
Dashboard displays absolute width, ATR-normalized width, and current state (Balanced vs Transitional) so you can glance across charts quickly.
Acceptance Flag toggle: Keep the repeated acceptance squares hidden until you need to audit balance.
PARAMETERS
Structure Timeframe (default: 240): Choose the timeframe whose ranges matter most (4H for indices, Daily for stocks).
Structure Lookback (default: 60): Bars sampled on the structure timeframe.
Acceptance Bars (default: 8): How many consecutive bars inside the range confirm balance.
Break Confirmation Bars (default: 3): Bars required outside the range to validate a breakout.
ATR Reference (default: 14): ATR period for width normalization.
Show Midpoint Grid (default: enabled): Display the midpoint and quarter levels.
Show Adaptive VWAP Fan (default: enabled): Toggle the VWAP channel for assets where volume distribution matters most.
Show Acceptance Flags (default: disabled): Turn the acceptance markers on/off for maximum visual control.
Show Range Dashboard (default: enabled): Disable if screen space is limited, re-enable during prep sessions.
ALERTS
The indicator includes five alert conditions:
Range High Tap: Price interacted with the RangeLattice high
Range Low Tap: Price interacted with the RangeLattice low
Range Mid Tap: Price interacted with the RangeLattice mid
Range Break Up: Confirmed upside breakout
Range Break Down: Confirmed downside breakout
LIMITATIONS
This indicator works best on liquid instruments with clear structural levels. On very low timeframes (1-minute and below), the structure may update too frequently to be useful. The acceptance/break confirmation system requires patience—faster traders may find the multi-bar confirmation too slow for scalping. The VWAP fan is session-based and resets daily, which may not suit all trading styles.
---

WSMR v3.9 — WhaleSplash → Mean Reversal
# WSMR v3.9 — WhaleSplash → Mean Reversal
*A Non-Repainting Impulse‑Reversal Engine for Systematic Futures Trading*
## Overview
WSMR v3.9 is a complete impulse → exhaustion → mean‑reversion framework designed for systematic intraday trading. It identifies high‑energy displacement events (“WhaleSplashes”), measures volatility structure, tracks VWAP deviation, and confirms reversals using RSI divergence, Z‑Score resets, SMA20 reclaim, and pivot-based structure.
All signals are non‑repainting and alerts fire on bar close.
---
## Core Components
### 1. WhaleSplash (Short Impulse Event)
Triggered when a candle meets displacement conditions:
- Large bar range vs ATR
- Minimum % move
- Volume expansion
- VWAP deviation (tick-based)
- Z‑Score oversold / RSI exhaustion
- Volatility-gated
### 2. Mean Reversal Long (MR)
Requires:
- RSI bullish divergence
- Z‑Score reset
- SMA20 reclaim
- Higher-low confirmation
### 3. First-Candle Confirmation (Optional)
- MR Confirm → first green after MR
- WS Confirm → first red after WS
- TTL window configurable
### 4. Asia Session Filter
Optional restriction to:
**23:00 → 09:00 UTC**
### 5. Volatility Monitor
Detects:
- Normal
- Wicky
- Spiky
- Extreme
### 6. WS Frequency Analytics
Rolling frequency calculation across:
- Bars / Days / Weeks / Months
---
## Status Panel (Top-Right)
Shows:
- Mode (Global / Asia-only)
- Timeframe + TTL
- WS frequency
- Volatility state
---
## Alerts
- WhaleSplash SHORT
- WhaleSplash LONG (MR)
- MR Confirm LONG
- WS Confirm SHORT
- Volatility Warning
---
## Notes
- Fully non‑repainting
- Stable bar-close logic
- Optimised for 1m–5m
- Works on futures, indices, metals, FX

Impulse Trend Suite (LITE) — V1.4+ Plu🚀 Impulse Trend Suite (LITE) — v1.4+
Smart trend visualization with precise flip arrows. A lightweight, momentum-filtered trend tool designed to stay clean, avoid repeated signals, and keep you focused only on real market direction.
FULL PRO VERSION --> fxsharerobots.com
✨ What’s New in v1.4+
Minor upgrades mostly visual
Added Blue fill between MA lines
clearer labels
📌 Core Features
Trend flip arrows (no spam, 1 signal per turn)
Continuous background zones (gap-free trend shading)
Adaptive Baseline + ATR structure channel
RSI + MACD momentum filter (suppresses weak signals)
Trend Status Panel (UP, DOWN, NEUTRAL)
🔍 Quick Guide
BUY setup = green arrow + green background
SELL setup = red arrow + red background
Stay in the move while color doesn’t change
ATR channel helps avoid chasing overextended candles
🆚 LITE vs PRO
========================================================
Feature LITE PRO
--------------------- -------- ------------------------------
Trend shading + arrows ✔ ✔ + confirmations
Neutral trend state ✔ ✔ enhanced
Alerts ✖ ✔ full suite
Reversal Zones ✖ ✔ predictive boxes
HTF Filter ✖ ✔ smarter trend bias
Included strategies ✖ ✔ + PDF training
🔓 Upgrade to PRO
Reversal Zones • Alerts • HTF Filter • Trend Continuation Strategy
👉 FULL PRO VERSION --> fxsharerobots.com
📈 Works on Forex, Stocks, Crypto, Indices, Metals
⌚ Scalping • Intraday • Swing • Long-term
==========================================================
🌠FULL PRO VERSION --> fxsharerobots.com/impulse-trend-pro/
💾 ALL DOWNLOADS --> fxsharerobots.com/downloads/
Happy trading! — FxShareRobots Team

Multi Timeframe Traffic LightsMonthly, Weekly, Daily, Hourly previous candle range vs current price. Inside = orange, above = green, below = red

RS Rating Multi-TimeframeRS Rating Multi-Timeframe (IBD-Style Relative Strength)
Short Description:
IBD-style Relative Strength Rating (1-99) comparing any stock's performance vs the S&P 500 across multiple timeframes.
Full Description:
Overview
This indicator calculates an IBD-style Relative Strength (RS) Rating that measures a stock's price performance relative to the S&P 500 over the past 12 months. The rating scale ranges from 1 (weakest) to 99 (strongest), telling you how a stock ranks against all other stocks in terms of relative performance.
How It Works
The RS Rating uses a weighted formula based on quarterly performance:
Last 63 days (1 quarter): 40% weight
Last 126 days (2 quarters): 20% weight
Last 189 days (3 quarters): 20% weight
Last 252 days (4 quarters): 20% weight
This weighting emphasizes recent performance while still accounting for longer-term strength.
Rating Interpretation
90-99 (Elite): Top 10% of all stocks - exceptional relative strength
80-89 (Excellent): Top 20% - strong leadership candidates
50-79 (Average): Middle of the pack
30-49 (Below Average): Underperforming the market
1-29 (Weak): Bottom 30% - avoid or consider shorting
Features
Multi-Timeframe: Works on any timeframe from 1-hour to weekly (always uses daily data for calculation)
Moving Average: Optional EMA or SMA of the RS Rating to smooth signals
Visual Zones: Color-coded zones for quick identification of strength/weakness
Signal Markers: Triangles appear when RS crosses key levels (80 and 30)
Info Table: Displays current RS Rating, change, MA value, and raw score
Alerts: Built-in alerts for key crossover events
Settings
Show Moving Average: Toggle MA line on/off
MA Length: Period for the moving average (default: 10)
MA Type: Choose between EMA or SMA
Benchmark Index: Change the comparison index (default: SP:SPX)
Show Rating Table: Toggle the info table on/off
How To Use
Buy candidates: Look for stocks with RS Rating above 80, ideally rising
Avoid: Stocks with RS Rating below 30 or falling rapidly
Confirmation: Use RS above its moving average as additional confirmation
Divergence: Watch for RS making new highs before price (bullish) or new lows before price (bearish)
Credits
RS Rating calculation methodology inspired by Investor's Business Daily (IBD) and adapted from Fred6724's RS Rating script. Percentile calibration based on analysis of ~6,600 US stocks.
Tags: relative strength, RS rating, IBD, momentum, CAN SLIM, benchmark, SPX, market leaders, stock ranking
Category: Relative Strength

V2 BUY LOW, BUY MORE, SELL HIGH Strategy w Buffett Meter-LITE__________________________________________________________________________
V2 Buy Low, Buy More, Sell High With Buffett Meter (LITE – JTMarketAI)
__________________________________________________________________________
Category: Quantitative Momentum & Liquidity Flow
Author: JTMarketAI
Architecture: Non-Repainting
This strategy accumulates into validated pullbacks during fear cycles, scales intelligently as price declines into liquidity support, and exits when momentum weakens after meaningful run-ups. It uses synthetic higher-timeframe OHLC data (non-repainting), liquidity imbalance confirmation, adaptive KAMA trend logic, RSI validation, and a live Buffett macro valuation gauge.
This is a patient, conviction-based accumulation engine designed for equities.
It is not a scalp bot.
__________________________________________________________________________
Core Features
__________________________________________________________________________
Non-repainting (confirmed bars only)
Synthetic HTF OHLC (no lookahead)
Dynamic trailing exit preserves ~80–87% of peak profit
Bull vs Bear liquidity dominance and flow imbalance
Rolling lowest-low tracking (LLL)
NY-session alignment (default)
Buffett Macro Meter integration
Technical Highlights
Flow-confidence derived from volume-order pressure
Adaptive KAMA smoothing for lower-lag confirmation
Daily > Weekly > Monthly synthetic aggregation
LLL progression display for trend exhaustion
Fully profiler-optimized
Supports averaging down when pyramiding enabled
__________________________________________________________________________
Why It Does Not Repaint
__________________________________________________________________________
All state updates occur only on confirmed bars
All trades are recorded and remembered to not disappear
Synthetic HTFs built without lookahead
Persistent arrays freeze historical values
Trailing highs updated only after confirmation
No forward-reference to future bars
__________________________________________________________________________
Lite Edition Notes
__________________________________________________________________________
Manual trading focused
Live trades (Dark Blue) Preview period trades (aqua entries)
On strategy start date, if preview trades are profitable, live trades begin.
Buffett Meter enabled. Nice for monitoring volume bar-by-bar for day trading.
Visual dashboard included
No alerts, automation, or webhooks (PRO unlocks TradersPost.io auto-trading)
__________________________________________________________________________
Limitations
__________________________________________________________________________
Best on intraday equities (1m–4h) V2 uses virtual volume to enable Daily Charts.
Designed for stock market tickers only.
High-resource if full visuals enabled
Avoid extremely low-volume tickers. Nice cyclical wave tickers like TSLA are best.
Does not guard against after-hours gaps or major news moves
Does not prevent tickers from racing towards 0.
__________________________________________________________________________
Warnings
__________________________________________________________________________
Contrarian scaling requires discipline and patience
Expect longer-duration trades, not rapid scalps
Use on quality tickers unlikely to permanently collapse
Confirm price behavior outside cash session
Test manually before automating anything
Not suitable for every market environment or asset
Notes on Philosophy
This strategy attempts to accumulate when markets overshoot lower, and distribute after recovery momentum fades. It reflects a patient, value-driven approach built on the principle of buying fear and reducing exposure into strength.
__________________________________________________________________________
Disclaimer
__________________________________________________________________________
For research and educational use only. Not financial advice. Past performance does not guarantee future results. Test thoroughly and use appropriate risk management.

TF7 Option vs Index Change RatioOverview
This indicator helps traders visualise the strength and direction of an option's price movement compared to its underlying index (NIFTY or SENSEX).
It calculates a Change Ratio, which is the percentage move in the option compared to the index movement during the same bar. This is especially useful for intraday traders looking for signs of momentum, divergence, or unusual strength/weakness in option pricing.
How It Works
The ratio is calculated as:
(Option LTP − Option Open) / (Index Close − Index Open)
The value is capped between −10 and +10 to filter out extreme or invalid spikes.
The ratio is displayed as a color-coded column chart:
🟩 Green bars: Option is moving in the same direction as the index.
🟥 Red bars: Option is underperforming or moving opposite to the index.
A compact table shows the last 5 bars of:
Option price change (with +/− sign)
Index price change
Calculated ratio (also color-coded)
You can toggle the table visibility in the settings.
Inputs & Features
Select underlying index: NIFTY or SENSEX
Toggle the data table display
Clean formatting with signed values and conditional color highlights
⚠️ Disclaimer
This is a visual analysis tool, not a buy/sell signal. Always validate with your trading strategy and risk management
#OptionsTrading, #NIFTY, #SENSEX, #ChangeRatio, #IndexAnalysis, #Momentum, #Divergence, #Intraday

Impulse Trend Suite (LITE) — v1.4🚀 Impulse Trend Suite (LITE) — v1.4
Smart trend visualization with precise flip arrows. A lightweight, momentum-filtered trend tool designed to stay clean, avoid repeated signals, and keep you focused only on real market direction.
✨ What’s New in v1.4
Minor upgrades mostly visual
Added Blue fill between MA lines
clearer labels
📌 Core Features
Trend flip arrows (no spam, 1 signal per turn)
Continuous background zones (gap-free trend shading)
Adaptive Baseline + ATR structure channel
RSI + MACD momentum filter (suppresses weak signals)
Trend Status Panel (UP, DOWN, NEUTRAL)
🔍 Quick Guide
BUY setup = green arrow + green background
SELL setup = red arrow + red background
Stay in the move while color doesn’t change
ATR channel helps avoid chasing overextended candles
🆚 LITE vs PRO
Feature LITE PRO
--------------------- -------- ------------------------------
Trend shading + arrows ✔ ✔ + confirmations
Neutral trend state ✔ ✔ enhanced
Alerts ✖ ✔ full suite
Reversal Zones ✖ ✔ predictive boxes
HTF Filter ✖ ✔ smarter trend bias
Included strategies ✖ ✔ + PDF training
========================================================
🔓 Upgrade to PRO
Reversal Zones • Alerts • HTF Filter • Trend Continuation Strategy
👉 fxsharerobots.com/impulse-trend-pro/
📈 Works on Forex, Stocks, Crypto, Indices, Metals
⌚ Scalping • Intraday • Swing • Long-term
==========================================================
⚠️ LITE - Educational tool. Backtest before trading live.
Visit us for Full Trading Tools Collection here:
fxsharerobots.com/downloads/
Happy trading! — FxShareRobots Team

Impulse Trend Suite (LITE) — v1.4 source🚀 Impulse Trend Suite (LITE) — v1.4
Smart trend visualization with precise flip arrows. A lightweight, momentum-filtered trend tool designed to stay clean, avoid repeated signals, and keep you focused only on real market direction.
✨ What’s New in v1.4
Minor upgrades mostly visual
Added Blue fill between MA lines
clearer labels
📌 Core Features
Trend flip arrows (no spam, 1 signal per turn)
Continuous background zones (gap-free trend shading)
Adaptive Baseline + ATR structure channel
RSI + MACD momentum filter (suppresses weak signals)
Trend Status Panel (UP, DOWN, NEUTRAL)
🔍 Quick Guide
BUY setup = green arrow + green background
SELL setup = red arrow + red background
Stay in the move while color doesn’t change
ATR channel helps avoid chasing overextended candles
🆚 LITE vs PRO
Feature LITE PRO
--------------------- -------- ------------------------------
Trend shading + arrows ✔ ✔ + confirmations
Neutral trend state ✔ ✔ enhanced
Alerts ✖ ✔ full suite
Reversal Zones ✖ ✔ predictive boxes
HTF Filter ✖ ✔ smarter trend bias
Included strategies ✖ ✔ + PDF training
========================================================
🔓 Upgrade to PRO
Reversal Zones • Alerts • HTF Filter • Trend Continuation Strategy
👉 fxsharerobots.com/impulse-trend-pro/
📈 Works on Forex, Stocks, Crypto, Indices, Metals
⌚ Scalping • Intraday • Swing • Long-term
==========================================================
⚠️ LITE - Educational tool. Backtest before trading live.
Visit us for Full Trading Tools Collection here:
fxsharerobots.com/downloads/
Happy trading! — FxShareRobots Team
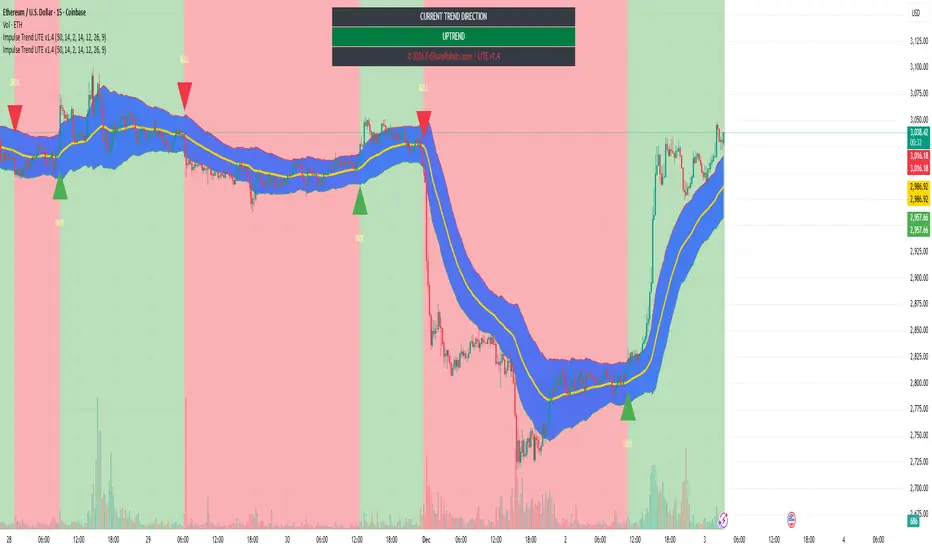
ADX_RDADX_RD - Average Directional Index (Ryan DeBraal)
This script plots a refined version of the **ADX (Average Directional Index)**,
used to measure trend strength regardless of trend direction. It includes
custom smoothing, modified DM (Directional Movement) logic, dynamic coloring,
and a built-in 20-level threshold.
FEATURES
- Calculates +DI, –DI, and ADX using standard Wilder smoothing (RMA).
- Signal color turns **white** when ADX < 20 (low-trend or choppy conditions).
- Signal color turns **blue** when ADX >= 20 (trend strengthening).
- Horizontal dotted reference line at **20**, a widely used threshold:
ADX < 20 → weak or ranging market
ADX > 20 → strengthening trend
- Works on all timeframes, supports custom smoothing lengths.
PURPOSE
This indicator helps identify when a market is trending vs when it is flat.
It does not indicate direction by itself — only the strength of the move —
making it ideal for confirming breakout setups, trend-following entries,
and filtering out low-probability trades during chop.

MACD_RDMACD_RD - Moving Average Convergence Divergence (Ryan DeBraal)
This indicator plots a standard MACD along with a color-adaptive histogram and
integrated momentum-shift alerts. It preserves the normal MACD structure while
improving visual clarity and signal recognition.
FEATURES
-----------------------------------------------------------------------------
• Standard MACD Calculation
- Fast MA (12 by default)
- Slow MA (26)
- Signal line (9)
- Choice between SMA/EMA for both MACD and Signal smoothing
• Color-Changing Histogram
- Green shades for positive momentum
- Red shades for negative momentum
- Lighter/darker tones depending on whether momentum is increasing or fading
- 50% opacity for improved readability
• Crossover-Based MACD Line Coloring
- MACD line turns green on bullish cross (MACD > Signal)
- MACD line turns red on bearish cross (MACD < Signal)
- Default blue when no crossover occurs
• Momentum-Shift Alerts
- Alerts when histogram flips direction
PURPOSE
-----------------------------------------------------------------------------
This MACD version emphasizes momentum shifts and trend transitions by
highlighting subtle histogram changes and providing clean crossover visuals.
Ideal for:
• Identifying early momentum reversals
• Filtering breakout/trend setups
• Confirming trend continuation vs exhaustion

BTC Price Prediction Model [Global PMI]V2🇺🇸 English Guide
1. Introduction
This indicator was created by GW Capital using Gemini Vibe Coding technology. It leverages advanced AI coding capabilities to reconstruct complex macroeconomic models into actionable trading tools.
2. Credits
Special thanks to the original model author, Marty Kendall. His research into the correlation between Bitcoin's price and macroeconomic factors lays the foundation for this algorithm.
3. Model Principles & Formula
This model calculates the "Fair Value" of Bitcoin based on four key macroeconomic pillars. It assumes that Bitcoin's price is a function of Global Liquidity, Network Security, Risk Appetite, and the Economic Cycle.
💡 Unique Insight: PMI & The 4-Year Cycle
A key distinguishing feature of this model is the hypothesis that Bitcoin's famous "4-Year Halving Cycle" may be intrinsically linked to the Global Business Cycle (PMI), rather than just supply shocks.
Therefore, the model incorporates PMI as a valuation "Amplifier".
Note: Due to TradingView data limitations, US PMI is currently used as the proxy for the global cycle.
The Formula
$$\ln(BTC) = \alpha + (1 + \beta \cdot PMI_{z}) \times $$
Global Liquidity (M2): Sum of M2 supply from US, China, Eurozone, and Japan (converted to USD). Represents the pool of fiat money available to flow into assets.
Network Security (Hashrate): Bitcoin's hashrate, representing the physical security and utility of the network.
Risk Appetite (S&P 500): Used as a proxy for global risk sentiment.
Economic Cycle (PMI Z-Score): US Manufacturing PMI is used to amplify or dampen the valuation based on where we are in the business cycle (Expansion vs. Contraction).
4. How to Use
The indicator plots the Fair Value (White Line) and four sentiment bands based on statistical deviation (Z-Score).
Sentiment Zones
🚨 Extreme Greed (Red Zone): Price > +0.3 StdDev. Historically indicates a market top or overheated sentiment.
⚠️ Greed (Orange Zone): Price > +0.15 StdDev. Bullish momentum is strong but caution is advised.
⚖️ Fair Value (White Line): The theoretical "correct" price based on macro data.
😨 Fear (Teal Zone): Price < -0.15 StdDev. Undervalued territory.
💎 Extreme Fear (Green Zone): Price < -0.3 StdDev. Historically a generational buying opportunity.
Sentiment Score (0-100)
100: Maximum Greed (Top)
50: Fair Value
0: Maximum Fear (Bottom)
5. Usage Recommendations
Timeframe: Daily (1D) or Weekly (1W) ONLY.
Reason: The underlying data sources (M2, PMI) are updated monthly. The S&P 500 and Hashrate are daily. Using this indicator on intraday charts (e.g., 15m, 1h, 4h) adds no value because the fundamental data does not change that fast.
Long-Term View: This is a macro-cycle indicator designed for identifying cycle tops and bottoms over months and years, not for day trading.
6. Disclaimer
This indicator is for educational and informational purposes only. It does not constitute financial advice. The model relies on historical correlations which may not hold true in the future. All trading involves risk. GW Capital and the creators assume no responsibility for any trading losses.
7. Support Us ❤️
If you find this indicator useful, please Boost 👍, Comment, and add it to your Favorites! Your support keeps us going.
🇨🇳 中文说明 (Chinese Version)
1. 简介
本指标由 GW Capital 使用 Gemini Vibe Coding 技术制作。利用先进的 AI 编程能力,将复杂的宏观经济模型重构为可执行的交易工具。
2. 致谢
特别感谢模型原作者 Marty Kendall。他对这一算法的研究奠定了基础,揭示了比特币价格与宏观经济因素之间的深层联系。
3. 模型原理与公式
该模型基于四大宏观经济支柱计算比特币的“公允价值”。它假设比特币的价格是全球流动性、网络安全性、风险偏好和经济周期的函数。
💡 独家洞察:PMI 与 4年周期
本模型的一个核心独特之处在于:我们认为比特币著名的“4年减半周期”背后的真正驱动力,可能与全球商业周期 (PMI) 高度同步,而不仅仅是供应减半。
因此,模型特别引入 PMI 作为估值的“放大器” (Amplifier)。
注:由于 TradingView 数据源限制,目前采用历史数据最详尽的美国 PMI 作为全球周期的代理指标。
模型公式
$$\ln(BTC) = \alpha + (1 + \beta \cdot PMI_{z}) \times $$
全球流动性 (M2): 美、中、欧、日四大经济体的 M2 总量(折算为美元)。代表可流入资产的法币资金池。
网络安全性 (Hashrate): 比特币全网算力,代表网络的物理安全性和实用价值。
风险偏好 (S&P 500): 作为全球风险情绪的代理指标。
经济周期 (PMI Z-Score): 美国制造业 PMI 用于根据商业周期(扩张 vs 收缩)来放大或抑制估值。
4. 指标用法
指标会在图表上绘制 公允价值 (白线) 以及基于统计偏差 (Z-Score) 的四条情绪带。
情绪区间
🚨 极度贪婪 (红色区域): 价格 > +0.3 标准差。历史上通常预示市场顶部或情绪过热。
⚠️ 一般贪婪 (橙色区域): 价格 > +0.15 标准差。多头动能强劲,但需谨慎。
⚖️ 公允价值 (白线): 基于宏观数据的理论“正确”价格。
😨 一般恐惧 (青色区域): 价格 < -0.15 标准差。进入低估区域。
💎 极度恐惧 (绿色区域): 价格 < -0.3 标准差。历史上通常是代际级别的买入机会。
情绪评分 (0-100)
100: 极度贪婪 (顶部)
50: 公允价值
0: 极度恐惧 (底部)
5. 使用建议
周期: 仅限日线 (1D) 或周线 (1W)。
原因: 底层数据源(M2, PMI)是月度更新的。标普500和算力是日度更新的。在日内图表(如15分钟、1小时、4小时)上使用此指标没有任何意义,因为基本面数据不会变化得那么快。
长期视角: 这是一个宏观周期指标,旨在识别数月甚至数年的周期顶部和底部,而非用于日内交易。
6. 免责声明
本指标仅供教育和参考使用,不构成任何财务建议。该模型依赖于历史相关性,未来可能不再适用。所有交易均涉及风险。GW Capital 及制作者不对任何交易损失承担责任。

BTC Price Prediction Model [Global PMI]🇨🇳 中文说明 (Chinese Version)
1. 简介
本指标由 GW Capital 使用 Gemini Vibe Coding 技术制作。利用先进的 AI 编程能力,将复杂的宏观经济模型重构为可执行的交易工具。
2. 致谢
特别感谢模型原作者 Marty Kendall。他对这一算法的研究奠定了基础,揭示了比特币价格与宏观经济因素之间的深层联系。
3. 模型原理与公式
该模型基于四大宏观经济支柱计算比特币的“公允价值”。它假设比特币的价格是全球流动性、网络安全性、风险偏好和经济周期的函数。
模型公式
$$\ln(BTC) = \alpha + (1 + \beta \cdot PMI_{z}) \times $$
全球流动性 (M2): 美、中、欧、日四大经济体的 M2 总量(折算为美元)。代表可流入资产的法币资金池。
网络安全性 (Hashrate): 比特币全网算力,代表网络的物理安全性和实用价值。
风险偏好 (S&P 500): 作为全球风险情绪的代理指标。
经济周期 (PMI Z-Score): 美国制造业 PMI 用于根据商业周期(扩张 vs 收缩)来放大或抑制估值。
4. 指标用法
指标会在图表上绘制 公允价值 (白线) 以及基于统计偏差 (Z-Score) 的四条情绪带。
情绪区间
🚨 极度贪婪 (红色区域): 价格 > +0.3 标准差。历史上通常预示市场顶部或情绪过热。
⚠️ 一般贪婪 (橙色区域): 价格 > +0.15 标准差。多头动能强劲,但需谨慎。
⚖️ 公允价值 (白线): 基于宏观数据的理论“正确”价格。
😨 一般恐惧 (青色区域): 价格 < -0.15 标准差。进入低估区域。
💎 极度恐惧 (绿色区域): 价格 < -0.3 标准差。历史上通常是代际级别的买入机会。
情绪评分 (0-100)
100: 极度贪婪 (顶部)
50: 公允价值
0: 极度恐惧 (底部)
5. 使用建议
周期: 仅限日线 (1D) 或周线 (1W)。
原因: 底层数据源(M2, PMI)是月度更新的。标普500和算力是日度更新的。在日内图表(如15分钟、1小时、4小时)上使用此指标没有任何意义,因为基本面数据不会变化得那么快。
长期视角: 这是一个宏观周期指标,旨在识别数月甚至数年的周期顶部和底部,而非用于日内交易。
6. 免责声明
本指标仅供教育和参考使用,不构成任何财务建议。该模型依赖于历史相关性,未来可能不再适用。所有交易均涉及风险。GW Capital 及制作者不对任何交易损失承担责任。
🇺🇸 English Guide (英文说明)
1. Introduction
This indicator was created by GW Capital using Gemini Vibe Coding technology. It leverages advanced AI coding capabilities to reconstruct complex macroeconomic models into actionable trading tools.
2. Credits
Special thanks to the original model author, Marty Kendall. His research into the correlation between Bitcoin's price and macroeconomic factors lays the foundation for this algorithm.
3. Model Principles & Formula
This model calculates the "Fair Value" of Bitcoin based on four key macroeconomic pillars. It assumes that Bitcoin's price is a function of Global Liquidity, Network Security, Risk Appetite, and the Economic Cycle.
The Formula
$$\ln(BTC) = \alpha + (1 + \beta \cdot PMI_{z}) \times $$
Global Liquidity (M2): Sum of M2 supply from US, China, Eurozone, and Japan (converted to USD). Represents the pool of fiat money available to flow into assets.
Network Security (Hashrate): Bitcoin's hashrate, representing the physical security and utility of the network.
Risk Appetite (S&P 500): Used as a proxy for global risk sentiment.
Economic Cycle (PMI Z-Score): US Manufacturing PMI is used to amplify or dampen the valuation based on where we are in the business cycle (Expansion vs. Contraction).
4. How to Use
The indicator plots the Fair Value (White Line) and four sentiment bands based on statistical deviation (Z-Score).
Sentiment Zones
🚨 Extreme Greed (Red Zone): Price > +0.3 StdDev. Historically indicates a market top or overheated sentiment.
⚠️ Greed (Orange Zone): Price > +0.15 StdDev. Bullish momentum is strong but caution is advised.
⚖️ Fair Value (White Line): The theoretical "correct" price based on macro data.
😨 Fear (Teal Zone): Price < -0.15 StdDev. Undervalued territory.
💎 Extreme Fear (Green Zone): Price < -0.3 StdDev. Historically a generational buying opportunity.
Sentiment Score (0-100)
100: Maximum Greed (Top)
50: Fair Value
0: Maximum Fear (Bottom)
5. Usage Recommendations
Timeframe: Daily (1D) or Weekly (1W) ONLY.
Reason: The underlying data sources (M2, PMI) are updated monthly. The S&P 500 and Hashrate are daily. Using this indicator on intraday charts (e.g., 15m, 1h, 4h) adds no value because the fundamental data does not change that fast.
Long-Term View: This is a macro-cycle indicator designed for identifying cycle tops and bottoms over months and years, not for day trading.
6. Disclaimer
This indicator is for educational and informational purposes only. It does not constitute financial advice. The model relies on historical correlations which may not hold true in the future. All trading involves risk. GW Capital and the creators assume no responsibility for any trading losses.

Impulse Trend Suite (LITE) — v1.3🚀 Impulse Trend Suite (LITE) — v1.3
Smart trend visualization with precise flip arrows. A lightweight, momentum-filtered trend tool designed to stay clean, avoid repeated signals, and keep you focused only on real market direction.
✨ What’s New in v1.3
Minor upgrades mostly visual
Added Blue fill between MA lines
clearer labels
📌 Core Features
Trend flip arrows (no spam, 1 signal per turn)
Continuous background zones (gap-free trend shading)
Adaptive Baseline + ATR structure channel
RSI + MACD momentum filter (suppresses weak signals)
Trend Status Panel (UP, DOWN, NEUTRAL)
🔍 Quick Guide
BUY setup = green arrow + green background
SELL setup = red arrow + red background
Stay in the move while color doesn’t change
ATR channel helps avoid chasing overextended candles
🆚 LITE vs PRO
Feature LITE PRO
--------------------- -------- ------------------------------
Trend shading + arrows ✔ ✔ + confirmations
Neutral trend state ✔ ✔ enhanced
Alerts ✖ ✔ full suite
Reversal Zones ✖ ✔ predictive boxes
HTF Filter ✖ ✔ smarter trend bias
Included strategies ✖ ✔ + PDF training
========================================================
🔓 Upgrade to PRO
Reversal Zones • Alerts • HTF Filter • Trend Continuation Strategy
👉 fxsharerobots.com/impulse-trend-pro/
📈 Works on Forex, Stocks, Crypto, Indices, Metals
⌚ Scalping • Intraday • Swing • Long-term
==========================================================
⚠️ LITE - Educational tool. Backtest before trading live.
Visit us for Full Trading Tools Collection here:
fxsharerobots.com/downloads/
Happy trading! — FxShareRobots Team

IU Momentum OscillatorDESCRIPTION:
The IU Momentum Oscillator is a specialized trend-following tool designed to visualize the raw "energy" of price action. Unlike traditional oscillators that rely solely on closing prices relative to a range (like RSI), this indicator calculates momentum based on the ratio of bullish candles over a specific lookback period.
This "Neon Edition" has been engineered with a focus on visual clarity and aesthetic depth. It utilizes "Shadow Plotting" to create a glowing effect and dynamic "Trend Clouds" to highlight the strength of the move. The result is a clean, modern interface that allows traders to instantly gauge market sentiment—whether the bulls or bears are in control—without cluttering the chart with complex lines.
USER INPUTS:
- Momentum Length (Default: 20): The number of past candles analyzed to count bullish occurrences.
- Momentum Smoothing (Default: 20): An SMA filter applied to the raw data to reduce noise and provide a cleaner wave.
- Signal Line Length (Default: 5): The length of the EMA signal line used to generate crossover signals and the "Trend Cloud."
- Overbought / Oversold Levels (Default: 60 / 40): Thresholds that define extreme market conditions.
- Colors: Fully customizable Neon Cyan (Bullish) and Neon Magenta (Bearish) inputs to match your chart theme.
LONG CONDITION:
- Signal: A Buy signal is indicated by a small Cyan Circle.
- Logic: Occurs when the Main Momentum Line (Glowing) crosses ABOVE the Grey Signal Line.
- Visual Confirmation: The "Trend Cloud" turns Cyan and expands, indicating that bullish momentum is accelerating relative to the recent average.
SHORT CONDITIONS:
- Signal: A Sell signal is indicated by a small Magenta Circle.
- Logic: Occurs when the Main Momentum Line (Glowing) crosses BELOW the Grey Signal Line.
- Visual Confirmation: The "Trend Cloud" turns Magenta, indicating that bearish pressure is increasing.
WHY IT IS UNIQUE:
1. Candle-Count Logic: Most oscillators calculate price distance. This indicator calculates price participation (how many candles were actually green vs red). This offers a different perspective on trend sustainability.
2. Optimized Performance: The script uses math.sum functions rather than heavy for loops, ensuring it loads instantly and runs smoothly on all timeframes.
3. Visual Hierarchy: It uses dynamic gradients and transparency (Alpha channels) to create a "Glow" and "Cloud" effect. This makes the chart easier to read at a glance compared to flat, single-line oscillators.
HOW USER CAN BENEFIT FROM IT:
- Trend Confirmation: Traders can use the "Trend Cloud" to stay in trades longer. As long as the cloud is thick and colored, the trend is strong.
- Divergence Spotting: Because this calculates momentum differently than RSI, it can often show divergences (price goes up, but the count of bullish candles goes down) earlier than standard tools.
- Scalping: The crisp crossover signals (Circles) provide excellent entry triggers for scalpers on lower timeframes when combined with key support/resistance levels.
DISCLAIMER:
This source code and the information presented here are for educational and informational purposes only. It does not constitute financial, investment, or trading advice.
Trading in financial markets involves a high degree of risk and may not be suitable for all investors. You should not rely solely on this indicator to make trading decisions. Always perform your own due diligence, manage your risk appropriately, and consult with a qualified financial advisor before executing any trades.

Volatility Regime NavigatorA guide to understanding VIX, VVIX, VIX9D, VVIX/VIX, and the Composite Risk Score
1. Purpose of the Indicator
This dashboard summarizes short-term market volatility conditions using four core volatility metrics.
It produces:
• Individual readings
• A combined Regime classification
• A Composite Risk Score (0–100)
• A simplified Risk Bucket (Bullish → Stress)
Use this to evaluate market fragility, drift potential, tail-risk, and overall risk-on/off conditions.
This is especially useful for intraday ES/NQ trading, expected-move context, and understanding when breakouts or fades have edge.
2. The Four Core Volatility Inputs
(1) VIX — Baseline Equity Volatility
• < 16: Complacent (easy drift-up, but watch for fragility)
• 16–22: Healthy, normal volatility → ideal trading conditions
• > 22: Stress rising
• > 26: Tail-risk / risk-off environment
(2) VIX9D — Short-Term Event Vol
Measures 9-day implied volatility. Reacts to immediate news/events.
• < 14: Strongly bullish (drift regime)
• 14–17: Bullish to neutral
• 17–20: Event risk building
• > 20: Short-term stress / caution
(3) VVIX — Volatility of VIX (fragility index)
Tracks volatility of volatility.
• < 100: “Bullish, Bullish” — very low fragility
• 100–120: Normal
• 120–140: Fragile
• > 140: Stress, hedging pressure
(4) VVIX/VIX Ratio — Microstructure Risk-On/Risk-Off
One of the most sensitive indicators of market confidence.
• 5.0–6.5: Strongest “normal/bullish” zone
• < 5.0: Bottom-stalking / fear regime
• > 6.5: Complacency → vulnerable to reversals
• > 7.5: Fragile / top-risk
3. Composite Risk Score (0–100)
The dashboard converts all four inputs into a single score.
Score Interpretation
• 80–100 → Bullish - Drift regime. Shallow pullbacks. Upside favored.
• 60–79 → Normal - Healthy tape. Balanced two-way trading.
• 40–59 → Fragile - Choppy, failed breakouts, thinner liquidity.
• 20–39 → Risk-Off - Downside tails active. Favor fades and defensive behavior.
• < 20 → Stress - Crisis or event-driven tape. Avoid longs.
Score updates every bar.
4. Regime Label
Independent of the composite score, the script provides a Regime classification based on combinations of VIX + VVIX/VIX:
• Bullish+ → Buying is easy, tape lifts passively
• Normal → Cleanest and most tradable conditions
• Complacent → Top-risk; be careful chasing upside
• Mixed → Signals conflict; chop potential
• Bottom Stalk → High VIX, low VVIX/VIX (capitulation signatures)
A trailing “+” or “*” indicates additional bullish or caution overlays from VIX9D/VVIX.
5. How to Use the Dashboard in Trading
When Bullish (Score ≥ 80):
• Expect drift-up behavior
• Downside limited unless catalyst hits
• Structure favors breakouts and trend continuation
• Mean reversion trades have lower expectancy
When Normal (Score 60–79):
• The “playbook regime”
• Breakouts and mean reversion both valid
• Best overall trading environment
When Fragile (Score 40–59):
• Expect chop
• Breakouts fail
• Take quicker profits
• Avoid overleveraged directional bets
When Risk-Off (20–39):
• Favor fades of strength
• Downside tails activate
• Trend-following short setups gain edge
• Respect volatility bands
When Stress (<20):
• Avoid long exposure
• Do not chase dips
• Expect violent, news-sensitive behavior
• Position sizing becomes critical
6. Quick Summary
• VIX = weather
• VIX9D = short-term storm radar
• VVIX = foundation stability
• VVIX/VIX = confidence vs fragility
• Composite Score = overall regime health
• Risk Bucket = simple “what do I do?” label
This dashboard gives traders a high-confidence, low-noise view of equity volatility conditions in real time.

YM Ultimate SNIPER v5# YM Ultimate SNIPER v5 - Documentation & Trading Guide
## 🎯 Unified GRA + DeepFlow | YM/MYM Optimized
**TARGET: 3-7 High-Confluence Trades per Day**
---
## ⚡ QUICK START
```
┌─────────────────────────────────────────────────────────────────┐
│ YM ULTIMATE SNIPER v5 │
├─────────────────────────────────────────────────────────────────┤
│ │
│ SIGNALS: │
│ S🎯 = S-Tier (50+ pts) → HOLD position │
│ A🎯 = A-Tier (25-49 pts) → SWING trade │
│ B🎯 = B-Tier (12-24 pts) → SCALP quick │
│ Z = Zone entry (price at FVG zone) │
│ │
│ SESSIONS (ET): │
│ LDN = 3:00-5:00 AM (London) │
│ NY = 9:30-11:30 AM (New York Open) │
│ PWR = 3:00-4:00 PM (Power Hour) │
│ │
│ COLORS: │
│ 🟩 Green zones = Bullish FVG (buy zone) │
│ 🟥 Red zones = Bearish FVG (sell zone) │
│ 🟣 Purple lines = Single prints (S/R levels) │
│ │
│ TABLE (Top Right): │
│ Pts = Candle point range │
│ Tier = S/A/B/X classification │
│ Vol = Volume ratio (green = good) │
│ Delta = Buy/Sell dominance │
│ Sess = Current session │
│ Zone = In FVG zone status │
│ Score = Confluence score /10 │
│ CVD = Cumulative delta direction │
│ R:R = Risk:Reward ratio │
│ │
└─────────────────────────────────────────────────────────────────┘
```
---
## 📋 VERSION 5 CHANGES
### What's New
- **Removed all imbalance code** - caused compilation errors
- **Simplified delta analysis** - uses candle structure instead of intrabar data
- **Cleaner confluence scoring** - 5 clear factors, max 10 points
- **Reliable table** - updates on last bar only, no flickering
- **Works on YM and MYM** - same logic applies to micro contracts
### Removed Features
- Candle-anchored imbalance markers
- Imbalance S/R zones
- Intrabar volume profile analysis
- POC visualization
### Kept & Improved
- Tier classification (S/A/B)
- FVG zone detection & visualization
- Single print detection
- Session windows with backgrounds
- Confluence scoring
- Stop/Target auto-calculation
- All alerts
---
## 🎯 SIGNAL TYPES
### Tier Signals (S🎯, A🎯, B🎯)
These are high-confluence signals that pass all filters:
| Tier | Points | Value/Contract | Action | Hold Time |
|------|--------|----------------|--------|-----------|
| **S** | 50+ | $250+ | HOLD | 2-5 min |
| **A** | 25-49 | $125-245 | SWING | 1-3 min |
| **B** | 12-24 | $60-120 | SCALP | 30-90 sec |
**Filters Required:**
1. Tier threshold met (points)
2. Volume ≥ 1.8x average
3. Delta dominance ≥ 62%
4. Body ratio ≥ 70%
5. Range ≥ 1.3x average
6. Proper wicks (no reversal wicks)
7. CVD confirmation (optional)
8. In trading session
### Zone Signals (Z)
Zone entries trigger when:
- Price is inside an FVG zone
- Delta shows dominance in zone direction
- Volume is above average
- In active session
- No tier signal already present
---
## 📊 CONFLUENCE SCORING
**Maximum Score: 10 points**
| Factor | Points | Condition |
|--------|--------|-----------|
| Tier | 1-3 | B=1, A=2, S=3 |
| In Zone | +2 | Price inside FVG zone |
| Strong Volume | +2 | Volume ≥ 2x average |
| Strong Delta | +2 | Delta ≥ 70% |
| CVD Momentum | +1 | CVD trending with signal |
**Score Interpretation:**
- **7-10**: Elite setup - full size
- **5-6**: Good setup - standard size
- **4**: Minimum threshold - reduced size
- **< 4**: No signal shown
---
## ⏰ SESSION WINDOWS
### London (3:00-5:00 AM ET)
- European institutional flow
- Character: Slow build-up, clean trends
- Expected trades: 1-2
- Best for: Zone entries, A/B tier
### NY Open (9:30-11:30 AM ET)
- Highest volume, most institutional activity
- Character: Initial balance, breakouts
- Expected trades: 2-3
- Best for: S/A tier, zone confluence
### Power Hour (3:00-4:00 PM ET)
- End-of-day rebalancing, MOC orders
- Character: Mean reversion or trend acceleration
- Expected trades: 1-2
- Best for: Zone entries, B tier scalps
---
## 🟩 FVG ZONES
### What Are FVG Zones?
Fair Value Gaps (FVGs) are price gaps between candles where price moved so fast that a gap was left. These gaps often act as support/resistance.
### Zone Requirements
- Gap size ≥ 25% of ATR
- Impulse candle has strong body (≥ 70%)
- Impulse candle is 1.5x average range
- Volume above average on impulse
- Created during active session
### Zone States
1. **Fresh** (bright color) - Just created, untested
2. **Tested** (gray) - Price touched zone midpoint
3. **Broken** (removed) - Price closed through zone
### Trading FVG Zones
| Zone | Approach From | Expected |
|------|--------------|----------|
| 🟩 Bull | Above (falling) | Support - look for bounce |
| 🟥 Bear | Below (rising) | Resistance - look for rejection |
---
## 🟣 SINGLE PRINTS
Single prints mark candles with:
- Range > 1.3x average
- Body > 70% of range
- Volume > 1.8x average
- Clear delta dominance
These become horizontal support/resistance lines extending into the future.
---
## 📊 TABLE REFERENCE
| Row | Label | Meaning |
|-----|-------|---------|
| 1 | Pts | Current candle point range |
| 2 | Tier | S/A/B/X classification |
| 3 | Vol | Volume ratio vs 20-bar average |
| 4 | Delta | Buy/Sell percentage dominance |
| 5 | Sess | Current session (LDN/NY/PWR/OFF) |
| 6 | Zone | In FVG zone (BULL/BEAR/---) |
| 7 | Score | Confluence score out of 10 |
| 8 | CVD | Delta momentum direction |
| 9 | R:R | Risk:Reward if signal active |
### Color Coding
- **Green/Lime**: Good, meets threshold
- **Yellow**: Caution, borderline
- **Red**: Bad, below threshold
- **Gray**: Inactive/neutral
---
## 🔧 SETTINGS GUIDE
### Tier Thresholds
| Setting | Default | Notes |
|---------|---------|-------|
| S-Tier | 50 pts | ~$250/contract |
| A-Tier | 25 pts | ~$125/contract |
| B-Tier | 12 pts | ~$60/contract |
### Sniper Filters
| Setting | Default | Notes |
|---------|---------|-------|
| Min Volume Ratio | 1.8x | Lower = more signals |
| Delta Dominance | 62% | Lower = more signals |
| Body Ratio | 70% | Higher = fewer, cleaner |
| Range Multiplier | 1.3x | Higher = fewer, bigger moves |
| CVD Confirm | On | Off = more signals |
### Recommended Configurations
**Conservative (3-4 trades/day):**
```
Min Confluence: 6
Volume Ratio: 2.0
Delta Threshold: 65%
Body Ratio: 75%
```
**Standard (5-7 trades/day):**
```
Min Confluence: 4
Volume Ratio: 1.8
Delta Threshold: 62%
Body Ratio: 70%
```
**Aggressive (7-10 trades/day):**
```
Min Confluence: 3
Volume Ratio: 1.5
Delta Threshold: 60%
Body Ratio: 65%
```
---
## ✓ ENTRY CHECKLIST
Before entering any trade:
1. ☐ Signal present (S🎯, A🎯, B🎯, or Z)
2. ☐ Session active (LDN, NY, or PWR)
3. ☐ Score ≥ 4 (preferably 6+)
4. ☐ Vol shows GREEN
5. ☐ Delta colored (not gray)
6. ☐ CVD arrow matches direction
7. ☐ Note stop/target lines
8. ☐ Execute at signal candle close
---
## ⛔ DO NOT TRADE
- Session shows "OFF"
- Score < 4
- Vol shows RED
- Delta gray (no dominance)
- Multiple conflicting signals
- Major news imminent (FOMC, NFP, CPI)
- Overnight session (11:30 PM - 3:00 AM ET)
---
## 🎯 POSITION SIZING
| Tier | Score | Size | Stop |
|------|-------|------|------|
| S (50+ pts) | 7+ | 100% | Below/above candle |
| A (25-49 pts) | 5-6 | 75% | Below/above candle |
| B (12-24 pts) | 4 | 50% | Below/above candle |
| Zone | Any | 50% | Beyond zone |
---
## 🚨 ALERTS
### Priority Alerts (Set These)
| Alert | Action |
|-------|--------|
| 🎯 S-TIER | Drop everything, check immediately |
| 🎯 A-TIER | Evaluate within 15 seconds |
| 🎯 B-TIER | Check if available |
| 🎯 ZONE | Good context entry |
### Info Alerts (Optional)
| Alert | Purpose |
|-------|---------|
| NEW BULL/BEAR FVG | Mark zones on mental map |
| SINGLE PRINT | Note for future S/R |
| SESSION OPEN | Prepare to trade |
---
## 📈 TRADE JOURNAL
```
DATE: ___________
SESSION: ☐ LDN ☐ NY ☐ PWR
TRADE:
├── Time: _______
├── Signal: S🎯 / A🎯 / B🎯 / Z
├── Direction: LONG / SHORT
├── Score: ___/10
├── Entry: _______
├── Stop: _______
├── Target: _______
├── In Zone: ☐ Yes ☐ No
├── Result: +/- ___ pts ($_____)
└── Notes: _______________________
DAILY:
├── Trades: ___
├── Wins: ___ | Losses: ___
├── Net P/L: $_____
└── Best setup: _______________________
```
---
## 🏆 GOLDEN RULES
> **"Wait for the session. Off-hours = noise."**
> **"Score 6+ is your edge. Anything less is gambling."**
> **"Zone + Tier = bread and butter combo."**
> **"One great trade beats five forced trades."**
> **"Leave every trade with money. YM gives you time."**
---
## 🔧 TROUBLESHOOTING
| Issue | Solution |
|-------|----------|
| No signals | Lower min score to 3-4 |
| Too many signals | Raise min score to 6+ |
| Zones cluttering | Reduce max zones to 8 |
| Missing sessions | Check timezone setting |
| Table not updating | Resize chart or refresh |
---
## 📝 TECHNICAL NOTES
- **Pine Script v6**
- **Works on**: YM, MYM, any Dow futures
- **Recommended TF**: 1-5 minute for day trading
- **Min TradingView Plan**: Free (no intrabar data required)
---
*© Alexandro Disla - YM Ultimate SNIPER v5*
*Clean Build | Proven Components Only*

BTC / XAU Calculator/Hesaplayıcı
USER GUIDE
BTC/XAU Calculator is a table-based indicator that displays Bitcoin price, Gold price (XAU/USD), and the BTC/XAU ratio simultaneously. It pulls real-time market data and calculates values based on your manual inputs.
⸻
Features
• Automatically fetches live BTCUSD and XAUUSD prices.
• Supports two-way manual calculations:
• BTC price → Ratio calculation
• Ratio → BTC price calculation
• Clear table layout showing Market vs Calculated values.
• Compatible with Binance, OANDA, and all brokers.
⸻
1. Settings
Gold Price (XAU/USD)
• When “Use live XAU price” is enabled, the indicator uses real-time XAU/USD.
• If disabled, you can enter your own gold price manually.
⸻
2. Calculation Modes
A) Calculate BTC from Ratio
BTC = Ratio × Gold price
Example:
XAU = 4200
Ratio = 19.08
→ BTC = 4200 × 19.08 = 80,136 USD
⸻
B) Calculate Ratio from BTC
Ratio = BTC price ÷ Gold price
Example:
BTC = 90,000
XAU = 4250
→ Ratio = 90,000 / 4,250 = 21.18
3. Suggested Uses
• Evaluate BTC as cheap/expensive relative to gold
• BTC target projections based on gold
• Macro hedge and correlation analysis
• BTC/XAU ratio-based scenario modeling
⸻
Notes
• This indicator does not generate trading signals.
• It is intended for numerical comparison and scenario building only.
Source: The design and calculation logic of this indicator were created in collaboration with OpenAI’s ChatGPT model.

Impulse Trend Suite (LITE) — v1.2🚀 Impulse Trend Suite (LITE) — v1.2
Smart trend visualization with precise flip arrows. A lightweight, momentum-filtered trend tool designed to stay clean, avoid repeated signals, and keep you focused only on real market direction.
✨ What’s New in v1.2
Minor upgrades mostly visual
Higher-contrast trend zones (green/red/neutral)
Larger BUY/SELL arrows + clearer labels
Clean, smoother ATR channel lines (improved)
Minor UI polishing to reduce chart noise
📌 Core Features
Trend flip arrows (no spam, 1 signal per turn)
Continuous background zones (gap-free trend shading)
Adaptive Baseline + ATR structure channel
RSI + MACD momentum filter (suppresses weak signals)
Trend Status Panel (UP, DOWN, NEUTRAL)
🔍 Quick Guide
BUY setup = green arrow + green background
SELL setup = red arrow + red background
Stay in the move while color doesn’t change
ATR channel helps avoid chasing overextended candles
🆚 LITE vs PRO
Feature LITE PRO
--------------------- -------- ------------------------------
Trend shading + arrows ✔ ✔ + confirmations
Neutral trend state ✔ ✔ enhanced
Alerts ✖ ✔ full suite
Reversal Zones ✖ ✔ predictive boxes
HTF Filter ✖ ✔ smarter trend bias
Included strategies ✖ ✔ + PDF training
========================================================
🔓 Upgrade to PRO
Reversal Zones • Alerts • HTF Filter • Trend Continuation Strategy
👉 fxsharerobots.com/impulse-trend-pro/
📈 Works on Forex, Stocks, Crypto, Indices, Metals
⌚ Scalping • Intraday • Swing • Long-term
==========================================================
⚠️ LITE - Educational tool. Backtest before trading live.
Visit us for Full Trading Tools Collection here:
www.fxsharerobots.com
Happy trading! — FxShareRobots Team

MA Strength Indicator EnhancedThe "MA Strength" is an indicator that measures market trend strength or (in the case of forex pairs) the relative strength of individual currencies based on up to five different moving averages (MA). It offers multiple calculation methods, such as simple summation, normalized value, or measuring ATR/percentage distance from the price. The results are summarized in a clear table, and it provides customizable alerts for trend changes or shifts in currency strength. The high level of configurability (e.g., MA weighting, "all MA alignment" requirement) allows for fine-tuning the strategy.
💬 Interpreting the Table (Top Rows)
The top row of the table shows the final output of the indicator. This changes according to the set "Table Mode".
Trend Mode: The top row shows the final, aggregated trend status (e.g., "BULLISH", "NEUTRAL") and the corresponding "Trend Value". This is the value the indicator compares to its thresholds.
Forex Mode: (Only on 6-character pairs): The top two rows show the strength of the Base currency and the Quote currency separately.
Calculation of the top rows:
The indicator calculates the individual score of all active MAs (according to the chosen method).
Trend Value: This is the final value calculated from the scores.
If "Enable Averaging" is ON, this will be the average of the scores (e.g., MA1 score is 5.0, MA2 score is 7.0 -> Trend Value is 6.0).
If averaging is OFF, this will be the sum of the scores (e.g., 5.0 + 7.0 = 12.0).
Forex Calculation: "Forex Mode" uses this "Trend Value". If the Trend Value is +6.0 (on an EURUSD pair):
The Base currency (EUR) value will be +6.0.
The Quote currency (USD) value will be -6.0.
The indicator compares these values to the thresholds to determine the "STRONG" status for EUR and "WEAK" status for USD.
📊 Calculation Methods
The indicator can calculate trend strength using 5 methods. The final "Trend Value" is derived from the results of these calculations.
Sum:
Description: Simply adds up the individual scores of all enabled moving averages (MA).
Formula: If the price is above an MA, it gets the "Score Above" value (e.g., +2.0); if below, it gets the "Score Below" value (e.g., -2.0).
Example: Result = (MA1 score) + (MA2 score) + ...
Normalized:
Description: Takes the sum obtained by the "Sum" method and converts it to a scale between -100% (maximally bearish) and +100% (maximally bullish). It takes into account the maximum possible positive and negative scores.
Formula: Result = (Total Score / Max Possible Score) * 100
Percentage Distance:
Description: This method also considers distance. The further the price is from the MA in percentage terms, the higher the score.
Formula: MA Score = (|Close Price - MA| / MA * 100) * Weight (The "Weight" is the "Score Above/Below" value set in settings).
ATR Distance:
Description: Similar to percentage distance, but normalizes the distance using volatility via ATR (Average True Range).
Formula: MA Score = (|Close Price - MA| / ATR) * Weight
Candle Count:
Description: Counts how many consecutive candles have been above or below the MA. It multiplies this number by the set weight.
Formula: MA Score = (Number of consecutive candles) * Weight
⚙️ Settings Options
Moving Averages (MA 1-5)
For each moving average, you can set:
Enable MA: Turn the specific MA on or off.
Type: The type of moving average (SMA, EMA, WMA, etc.).
Period: The period of the MA (e.g., 50, 200).
Score Above / Below: The most important setting. This defines the "weight" of the MA in the calculation. In "Sum" mode, this is a fixed score; in distance-based modes, this is a multiplier (weight). It is advisable to write a positive number for "Score Above" and a negative number for "Score Below".
Calculation Settings
Enable Averaging: If this is on, the indicator shows the average of the active MA scores, not the total score.
Exception: This function is not available in "Normalized" mode.
Require All MA Alignment: This is a strict filter. If enabled, the indicator only gives a "BULLISH" (or "STRONG") signal if the price is above all enabled moving averages. Similarly, a "BEARISH" signal only occurs if the price is below all moving averages. If the price is on the opposite side of even just one MA (e.g., above 4, below 1), the status becomes "NEUTRAL", regardless of the scores.
Strength / Trend Thresholds
Enable Extra Levels: If active, statuses are expanded: "EXT. BULLISH" / "EXT. BEARISH" (Trend mode) or "EXT. STRONG" / "EXT. WEAK" (Forex mode). This indicates stronger, overbought/oversold conditions.
Threshold setting: The thresholds (e.g., "Strong Above - ATR") determine when the calculated value counts as a "STRONG" or "WEAK" status.
🔢 Setting Thresholds via Calculation
If "Enable Averaging" is OFF, the "Trend Value" shown in the table will be the sum of the individual MA scores. Therefore, we must define the threshold by adding up the minimum expected performance from each moving average. This allows us to set different expectations for short, medium, and long-term averages.
Step 1: Determine MA weights
In our example, we use 3 active MAs with the following weights (Score Above values):
MA1 (Short): Weight = +2
MA2 (Medium): Weight = +3
MA3 (Long): Weight = +4
Step 2: Determine the minimum expected distance
Define a minimum distance expected from each MA to trigger a "Strong" signal.
Step 3: Calculate target scores and the final threshold
Note: If "Enable Averaging" is ON, the resulting value (sum of target scores) must be
averaged to get the final threshold.
Example 1: ATR Distance
-Goal: I want a "Strong" signal if the price is...
...at least 1.0 ATR above MA1 (Short),
...at least 1.5 ATR above MA2 (Medium),
...and at least 2.0 ATR above MA3 (Long).
-Calculation (Expected Distance * Weight):
MA1 Target Score: 1.0 * 2 = 2.0
MA2 Target Score: 1.5 * 3 = 4.5
MA3 Target Score: 2.0 * 4 = 8.0
-Final Threshold (Sum of Target Scores): 2.0 + 4.5 + 8.0 = 14.5
-Setting: Set "Strong Above - ATR" threshold to 14.5.
If "Enable Averaging" is ON, the obtained value must be averaged, and the result will be the
threshold: 4.8 (14.5 / 3 = 4.83).
Example 2: Percentage Distance
-Goal: I want a "Strong" signal if the price is...
...at least 0.5% above MA1,
...at least 1.0% above MA2,
...and at least 1.5% above MA3.
-Calculation (Expected Distance * Weight):
MA1 Target Score: 0.5 * 2.0 = 1.0
MA2 Target Score: 1.0 * 3.0 = 3.0
MA3 Target Score: 1.5 * 4.0 = 6.0
-Final Threshold (Sum): 1.0 + 3.0 + 6.0 = 10.0
-Setting: Set "Strong Above - Percentage" threshold to 10.0.
If "Enable Averaging" is ON, the obtained value must be averaged, and the result will be the
threshold.
Example 3: Candle Count
-Goal: I want a "Strong" signal if...
...at least 3 consecutive candles are above MA1,
...at least 5 consecutive candles are above MA2,
...and at least 10 consecutive candles are above MA3.
-Calculation (Expected Candle Count * Weight):
MA1 Target Score: 3 * 2.0 = 6.0
MA2 Target Score: 5 * 3.0 = 15.0
MA3 Target Score: 10 * 4.0 = 40.0
-Final Threshold (Sum): 6.0 + 15.0 + 40.0 = 61.0
-Setting: Set "Strong Above - Candle" threshold to 61.0.
If "Enable Averaging" is ON, the obtained value must be averaged, and the result will be the
threshold.
Example 4: Sum
In this mode, distance does not matter, only whether the price is above or below the MA.
-Goal: "Strong" signal if the price is above the long-term averages, but can be below the short-term (MA1).
MA1 (Short): Can be below (Weight: -2.0)
MA2 (Medium): Must be above (Weight: +3.0)
MA3 (Long): Must be above (Weight: +4.0)
-Calculation: -2.0 + 3.0 + 4.0 = 5.0
-Setting: Set "Strong Above - Sum" threshold to 5.0.
If it must be above all three moving averages, the threshold would be 2.0 + 3.0 + 4.0 = 9.0.
If "Enable Averaging" is ON, the obtained value must be averaged, and the result will be the
threshold.
Example 5: Normalized
The basic logic is similar to the "Sum" method.
-Goal: "Strong" signal if price is above MA2 and MA3, but potentially below MA1.
-Calculation: Target Sum: 5.0. Max Possible Score (above all): 9.0.
-Threshold: (5.0 / 9.0) * 100 = 55.5
In this calculation method, averaging cannot be set.
The Usage of the "ATR %" Row
The "ATR %" row shows the percentage movement of an average candle.
How to use this with "Percentage Distance" mode:
This number gives a baseline. It helps decide if the "Percentage Distance" threshold is realistic.
Example: You see the "ATR %" value is hovering around 1.2%. This means a "normal" candle moves about 1.2%.
If you set the Percentage threshold to 0.5%, it is too low. The indicator will constantly give a "Strong" signal because even average movement (noise) exceeds the threshold.
Correct Usage: If "normal" movement is 1.2%, then a "strong" movement (trend) needs to be significantly larger. For example, set the threshold to double the ATR %: 2.4 (2 * 1.2). Thus, you only get a "Strong" signal if the movement is twice the average volatility.
Supplementary Information
Rounding Differences:
The numbers displayed in the table and the precision of calculations in the background differ.
Table Display: The indicator rounds numbers to two decimal places in the table. So, if the value is 0.996, the table shows 1.00 (rounded up).
Internal Calculation: The background calculation uses much higher precision. When determining status (STRONG vs NEUTRAL), the program compares the precise, unrounded value to the threshold.
Result: Due to rounding, it may happen that if the threshold is 1.00 and the table shows 1.00, the status flickers between Strong and Neutral. If this is bothersome, it is advisable to set a slightly lower threshold (e.g., 0.98).
🔔 Alert Settings
The indicator can send alerts when the status changes.
Alert Method:
Trend: Alerts when the main trend status changes (e.g., from "NEUTRAL" to "BULLISH"). You can specify which direction to alert for (e.g., only "BULLISH").
Forex: Works only on 6-character forex pairs. You can set separate alerts for the Base or Quote currency.
Forex Strength Level: You can specify at which status level to alert (e.g., "WEAK" or "EXT. STRONG").
📈 Trading Tips
Trend Confirmation: Use the "BULLISH" / "BEARISH" status to confirm your existing strategy (e.g., breakouts, bounces off support).
Forex Pairing: In Forex mode, look for pairs where the Base currency is "STRONG" and the Quote currency is "WEAK" (or "EXT. STRONG" / "EXT. WEAK") for a long position.
Short Position: Reverse the above (Base: WEAK, Quote: STRONG).
