Golden Ratio MultiplesI call this "Phi Ribbons." The Golden Ratio, also known as Phi, is fantastic at predicting areas of price reversal.
Every moving average is a fibonacci multiple of the base function 355 SMA .
The rainbow above is an array of fibonacci multiples that are greater than one (1.618, 2, 2.618, 3, 5, 8, 13, 21)
The rainbow below is an array of fibonacci multiples that are less than one (0.786, 0.618, 0.5, 0.382, 0.236, 0.14)
Notice the precision of marking areas of potential price reversals
EASTER EGG: The two moving averages at the top of the script are 355 SMA & 113 SMA . This is one of the lowest ratios that closely approximates Pi (3.14159).
Simply plotting the 133 SMA will add a unique feature:
355/133 = 3.14159
When the 113 crosses below the 355 it tends to mark the end of major bullish impulses, and a crossover is a bullish sign.
在脚本中搜索"通达信+选股公式+换手率+0.5+源码"

Z-HistogramIt is possible to approximate the underlying distribution of a random variable by using what is called an "Histogram". In order to construct an histogram one must first split the data into several intervals (also called bins) often of the same size and count the number of values falling within each intervals, the histogram plot is then constructed with the X axis representing the measured variable and the Y axis representing the frequency.
The proposed script aim to estimate the underlying distribution of a rolling z-score by constructing its histogram, here the histogram consist of 13 bins of width 0.5 rolling standard deviations. The length setting define the rolling z-score period, the window setting define the number of past data to be counted, finally using the "Total" option (true by default) will count all the rolling z-scores values since the first bar, in order to use the window setting make sure to uncheck the "Total" option.
DISPLAY
In order to see the entirety of the histogram make sure to double click on the indicator window and to have all the lower panels (text notes, pine editor...etc) hidden, finally make sure to zoom-in in order to see the frequency numbers displayed.
Z-Histogram on BTCUSD 15 min TF, the blue bins represent intervals situated over 0 while red bins represent intervals situated under 0. Here σ represent the X-axis in standard deviations, the histogram start with a bin situated at σ = -3 which count the number of times the rolling z-score was within -3 and -2.5, the histogram end with the bin situated at σ = 3 which count the number of time the rolling z-score was within 3 and 3.5.
It is also possible to look at the shape of the histogram without having the indicator window at full size.
INTERPREATION
An histogram can give really interesting information such as overall trend direction and strength. The direction can be measured by looking at the skewness of the histogram, with a negative skewness (the peak of the histogram situated at the right from the center) representing down-trending variations and positive skewness (the peak of the histogram situated at the left from the center) representing up-trending variations, while a symmetrical histogram could represent a ranging market. The farther away the peak of the histogram is situated from the center, the stronger the trend.
Another interesting characteristic is the tailedness of the histogram, which can give information about the cleanliness of the trend, for example a positive skew and high tailedness would represent a clean up-trend, as it could suggest less variations contrary to the main trend.
An histogram applied to the rolling z-score can give various useful information. As a recall the rolling z-score of the price measure the distance between the closing price and its moving average in term of rolling standard deviations, for example if the rolling z-score is equal to 2 it means that the closing price is currently 2 rolling standard deviations over its moving average.
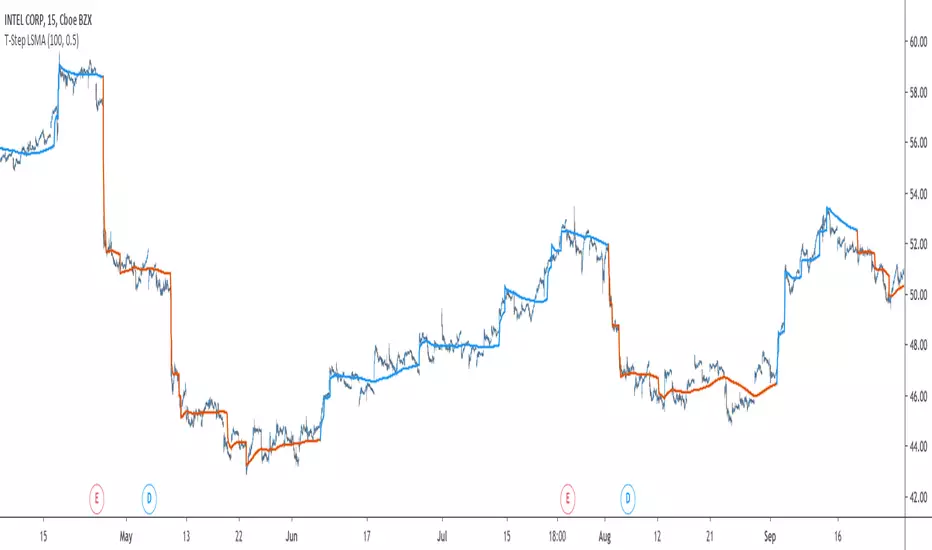
Lets for example analyze the histogram using INTC 15 min tf with a window of 456 bars and rolling z-score of length = 100 in order to review longer term variations.
We can see from the histogram that the uptrend visible on the chart is represented by the bins situated over 0 having an overall higher frequency than the bins under 0, we can see that the closing price tended to stay between 1 and 1.5 rolling standard deviations over its period 100 moving average. Here bins under 0 accounts for retracements in the trend.
IN SUMMARY
An histogram can give various information regarding the price evolution of a security, the proposed script aim to plot the histogram of a rolling z-score. Now this script might not be too useful but it was fun to make, also it does not mean that an histogram is not an useful tool in the context of trading, the only thing required is a god implementation of it (like volume profiles for example)
In this post we have also reviewed some important statistical concepts such as distributions, z-score, skewness and tailedness, each being extremely important in the quantitative trading field.
Thx for reading !

TA Basics: Evolving our Zero Lag Moving Average.In the previous Zero-Lag MA post, we introduced the "mirroring" technique and the associated calculation.
In this post, we will see how we can use the same technique, with a slight variation, to evolve our zero lag moving average line, add more "smoothness" and still maintaining the low lag and fast response to data series changes.
to use the "mirroring" technique, we need to use 2 MA lines with varying speeds - this is essential to produce the delta between the lines, that can then be mirrored around the fast line to produce the final line. in the first example, we used a Simple MA (slow) and a Weighted MA (fast) of the same length to achieve that.
here we introduce a different way of doing that. we will use a Weighted MA of the length (slow) and another Weighted MA of half the length (fast) -- the difference in "speed" between these 2 lines should produce the delta we need, we mirror it around the fast line, and we get our desired Zero-lag line. Check!
then while we're at it, why don't we introduce an additional smoothing just to ensure the new line is not too "broken" and jumpy .. and flows smoothly across the data series. but what length should we use for smoothing?
smoothing length should be enough to make an actual smoothing effect, but not too large else it will introduce lagging on its own. how about 3? usually 3 or 4 are good values for smoothing. A brilliant idea here is to use a number related to the same input length of the original line, which can always be relatively small -- the square root (integer portion) of that original length - and in that case, the user will only need to enter 1 input for the moving average, just the length - everything will be calculated from there. Check again!
I commented the code if you like to follow the simplified build-up of the formula, now that the concept is explained.
the (more complex-looking) 1-line, condensed form of that formula to use is (alert: watch out for the ()'s -- they're tricky :) )
----------------------------------------------
ZLMA_Line = wma((2*wma(close,int(length/2)) - wma(close,length)), int(sqrt(length)))
------------------------------------------
the one thing i do not like about this technique, is that we introduce the use of the half length MA. i do not like to build indicators that make decisions like this on behalf of the trader - the trader wants to analyze the data for a specific length, and we should continue to stick to that consistently across the moving average (or whatever indicator) calculation. I would always be caution about "hardcoding" some optional values (in this case 0.5 * length) within the indicator itself - others may not mind that.
Now to a nice surprise for the patient folks who got so far in this post - Congratulations, we have just discovered the concept and the formula behind the famous Hull Moving Average .. the big thing here is, we just had the opportunity to learn how to create the whole thing ourselves from the ground up step by step, and had fun doing it (I hope!)
-- these posts are meant to provide those who are new to the world of technical analysis and want to learn how and why to build their own technical indicators. i hope some of you find them useful and interesting, and i wish you the best of luck.

Stochastic FibonacciThis is your run-of-the-mill stochastic indicator, with one slight difference. I added Fibonacci ratios and colored them across the rainbow for aesthetics.
I noticed that the stochastic moving averages, K & D, would reverse in between 0 & 100. Just like price, they were likely Fibonacci ratios.
My original plan was to create a strategy script, and trade whenever K & D crosses the Fib levels. However, they do not cross them perfectly, rather they merely float near them and reverse. Therefore, the strategy would have never made the trades.
As you will notice in the script, there is Bitcoin Hash Rate data imported. I did so because I would like to create a stochastic hash rate indicator at some point. For those of you with this same passion, there is the hash data to mess around with; consider it an Easter Egg...

Envelop - Multi TypeEnvelop - Multi Type displays an upper envelope above a basis line and a lower envelope below the basis line. The basis line is a type of moving average, The envelopes are set a percentage away from the basis line.
A. Basis Line's Type
1. Gaussian Filter script by Alex Orekhov (everget)
2. SMA
3. EMA
4. TEMA
5. WMA
6. VWMA
7. DONCHIAN
8. Hull MA
9. ALMA
B. Default Percent of Envelop
1. Resolution (Time frame) <= 5: percent = 0.382
2. Resolution (Time frame) <= 15: percent = 0.5
3. Resolution (Time frame) <= 30: percent = 0.618
4. Resolution (Time frame) <= 60 (1H): percent = 0.786
5. Resolution (Time frame) <= 240 (4H): percent = 1.0
6. Resolution (Time frame) <= 1440 (1D): percent = 1.618
7. Resolution (Time frame) >1D: percent = 2.618
C. Custom Percent of Envelop
Default Percent of Envelop auto disable when Custom Percent of Envelop > 0 and the envelopes are set by user defined percentage.

Parametric Corrective Linear Moving AveragesImpulse responses can fully describe their associated systems, for example a linearly weighted moving average (WMA) has a linearly decaying impulse response, therefore we can deduce that lag is reduced since recent values are the ones with the most weights, the Blackman moving average (or Blackman filter) has a bell shaped impulse response, that is mid term values are the ones with the most weights, we can deduce that such moving average is pretty smooth, the least squares moving average has negative weights, we can therefore deduce that it aim to heavily reduce lag, and so on. We could even estimate the lag of a moving average by looking at its impulse response (calculating the lag of a moving average is the aim of my next article with Pinescripters) .
Today a new moving average is presented, such moving average use a parametric rectified linear unit function as weighting function, we will see that such moving average can be used as a low lag moving average as well as a signal moving average, thus creating a moving average crossover system. Finally we will estimate the LSMA using the proposed moving average.
Correctivity And The Parametric Rectified Linear Unit Function
Lot of terms are used, each representing one thing, lets start with the easiest one,"corrective". In some of my posts i may have used the term "underweighting", which refer to the process of attributing negative weights to the input of a moving average, a corrective moving average is simply a moving average underweighting oldest values of the input, simply put most of the low lag moving averages you'll find are corrective. This term was used by Aistis Raudys in its paper "Optimal Negative Weight Moving Average for Stock Price Series Smoothing" and i felt like it was a more elegant term to use instead of "low-lag".
Now we will describe the parametric rectified linear unit function (PReLU), this function is the one used as weighting function and is not that complex. This function has two inputs, alpha , and x , in short if x is greater than 0, x remain unchanged, however if x is lower than 0, then the function output is alpha × x , if alpha is equal to 1 then the function is equivalent to an identity function, if alpha is equal to 0 then the function is equivalent to a rectified unit function.
PReLU is mostly used in neural network design as an activation function, i wont explain to you how neural networks works but remember that neural networks aim to mimic the neural networks in the brain, and the activation function mimic the process of neuron firing. Its a super interesting topic because activation functions regroup many functions that can be used for technical indicators, one example being the inverse fisher RSI who make use of the hyperbolic tangent function.
Finally the term parametric used here refer to the ability of the user to change the aspect of the weighting function thanks to certain settings, thinking about it, it isn't a common things for moving averages indicators to let the user modify the characteristics of the weighting function, an exception being the Arnaud Legoux moving average (ALMA) which weighting function is a gaussian function, the user can control the peak and width of the function.
The Indicator
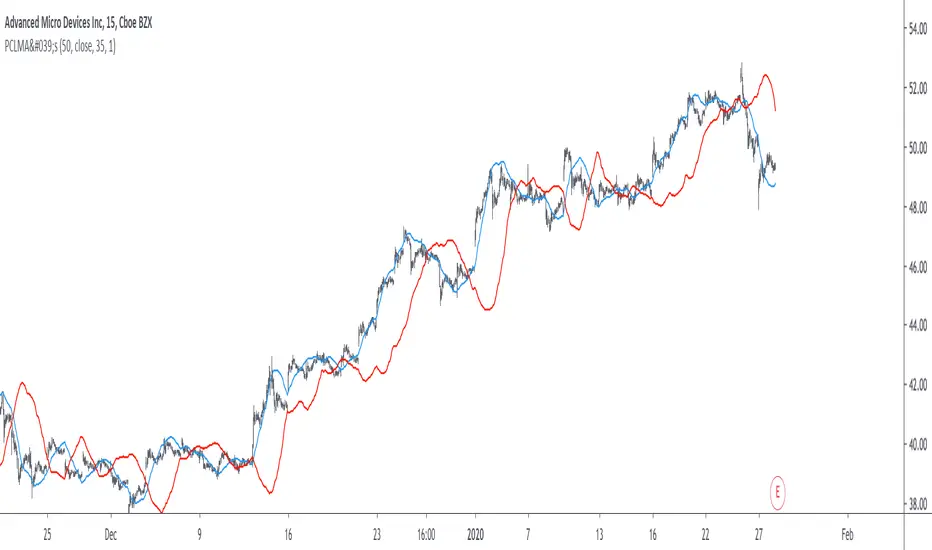
The indicator has two moving averages displayed on the chart, a trigger moving average (in blue) and a signal moving average (in red), their crosses can generate signals. The length parameter control the filter length, with higher values of length filtering longer term price fluctuations.
The percentage of negative weights parameter aim to determine the percentage of negative weights in the weighting function, note that the signal moving average won't use the same amount and will use instead : 100 - Percentage , this allow to reverse the weighting function thus creating a more lagging output for signal. Note that this parameter is caped at 50, this is because values higher than 50 would make the trigger moving average become the signal moving average, in short it inverse the role of the moving averages, that is a percentage of 25 would be the same than 75.
In red the moving average using 25% of negative weights, in blue the same moving average using 14% percent of negative weights. In theory, more negative weights = less lag = more overshoots.
Here the trigger MA in blue has 0% of negative weights, the trigger MA in green has however 35% of negative weights, the difference in lag can be clearly seen. In the case where there is 0% of negative weights the trigger become a simple WMA while the signal one become a moving average with linearly increasing weights.
The corrective factor is the same as alpha in PReLU, and determine the steepness of the negative weights line, this parameter is constrained in a range of (0,1), lower values will create a less steep negative weights line, this parameter is extremely useful when we want to reduce overshoots, an example :
here the corrective factor is equal to 1 (so the weighting function is an identity function) and we use 45% of negative weights, this create lot of overshoots, however a corrective factor of 0.5 reduce them drastically :
Center Of Linearity
The impulse response of the signal moving average is inverse to the impulse response of the trigger moving average, if we where to show them together we would see that they would crosses at a point, denoted center of linearity, therefore the crosses of each moving averages correspond to the cross of the center of linearity oscillator and 0 of same period.
This is also true with the center of gravity oscillator, linear covariance oscillator and linear correlation oscillator. Of course the center of linearity oscillator is way more efficient than the proposed indicator, and if a moving average crossover system is required, then the wma/sma pair is equivalent and way more efficient, who would know that i would propose something with more efficient alternatives ? xD
Estimating A Least Squares Moving Average
I guess...yeah...but its not my fault you know !!! Its a linear weighting function ! What can i do about it ?
The least squares moving average is corrective, its weighting function is linearly decreasing and posses negative weights with an amount of negative weights inferior to 50%, now we only need to find the exact percentage amount of negative weights. How to do it ? Well its not complicated if we recall the estimation with the WMA/SMA combination.
So, an LSMA of period p is equal to : 3WMA(p) - 2SMA(p) , each coefficient of the combination can give us this percentage, that is 2/3*100 = 33.333 , so there are 33.33% percent of negative weights in the weighting function of the least squares moving average.
In blue the trigger moving average with percentage of negative values et to 33.33, and in green the lsma of both period 50.
Conclusion
Altho inefficient, the proposed moving averages remain extremely interesting. They make use of the PReLU function as weighting function and allow the user to have a more accurate control over the characteristics of the moving averages output such as lag and overshoot amount, such parameters could even be made adaptive.
We have also seen how to estimate the least squares moving average, we have seen that the lsma posses 33.333...% of negative weights in its weighting function, another useful information.
The lsma is always behind me, not letting me focus on cryptobot super profit indicators using massive amount of labels, its like each time i make an indicator, the lsma come back, like a jealous creature, she want the center of attention, but you know well that the proposed indicator is inefficient ! Inefficient elegance (effect of the meds) .
Thanks for reading !
(JS) Ultimate RSISo my goal here was to combine all of my RSI ideas into a single indicator in order to make kind of a "Swiss Army Knife" version of the Relative Strength Index ...
------------------------------------------------------------------------------------------------------------------------------------------------------------------------------------------------------------------------------------------------------------------
So, let's begin with the first RSI indicator I made, which is the RSIDVW (Divergence/Volume Weighted);
To rephrase my original post, the "divergence/volume weighted" portion is meant to expand upon the current RSI format by adding more variables into the equation.
The standard RSI is based off one value that you select (open, close, OHLC4, HLC3, etc.) while this version takes three variables into account.
The default setting is to have RSI normal without anything added to it (Divergence Weight = 0)
1st - it takes the standard variable that RSI normally uses.
2nd - it factors RSI divergence by taking the RSI change % and price change % to form a ratio. Using this ratio, I duplicated the RSI formula and created a divergence RS to be factored in with the standard price RS .
3rd - it takes Relative Volume and amplifies/weakens the move based upon volume confirmation. (So if Relative Volume for a price bar is 1.0, the RSI plot would be the same as it normally would)
So to explain the parameters
- Relative Volume Length: This uses the RV length you specify to determine spikes in volume (or lack of volume ), which then is added into the formula to influence the strength of the RSI move
- RV x Divergence: This is how I calculated the original formula, but you can leave this unchecked to turn Relative Volume off, or apply elsewhere.
- RV x RS: There's two sides, Divergence RS and Standard RS - these check marks allow you to select which part you prefer to be multiplied by Relative Volume .
Checking neither turns off Relative Volume , while checking both amplifies its effects by placing it on both sides of the equation.
-Divergence Weight: This controls how much the DVW portion of the formula influences the RSI plot. As I referred to earlier, default is 0 making RSI normal. The Scale is 0-2, so 1.0 would be the same as 50%.
When I do have DVW on, I generally set it to 0.5
-SMA Divergence: To smooth, or not to smooth, that is the question. UJsing an SMA here is much smoother in my opinon, but leaving it unchecked runs it through an RMA the same way standard RSI is calculated.
-Show Fractal Channel: This allows you to see the whole fractal channel around the RSI (This portion of the code, compliments of the original Ricardo Santos fractal script)
------------------------------------------------------------------------------------------------------------------------------------------------------------------------------------------------------------------------------------------------------------------
The next portion of the script is adding a "Slow RSI"...
This is rather simple really, it allows you to add a second RSI plot so that you can watch for crossovers between fast and slow lines.
-Slow RSI: This turns on the second RSI Plot.
-Slow RSI Length: This determines the length of the second RSI Plot.
------------------------------------------------------------------------------------------------------------------------------------------------------------------------------------------------------------------------------------------------------------------
Pivot Point RSI was something a friend of mine requested I make which turned out pretty cool, I thought... It is also available in this indicator.
-Pivot Points: Selecting this enables the rest of the pivot point related parts of the script
If Pivot Points isn't selected, none of the following things will work
-Plot Pivot: Plots the pivot point .
-Plot S1/R1: Plots S1/R1.
-Plot S2/R2: Plots S2/R2.
-Plot S3/R3: Plots S3/R3.
-Plot S4/R4: Plots S4/R4.
-Plot S5/R5: Plots S5/R5.
-Plot Halfway Points: Plots a line between each pivot .
-Show Pivot Labels: Shows the proper label for each pivot .
When using intraday charts, from a 15 minute interval or less the pivots are calculated based on a single days worth of price action, above that the distance expands.
Here are the current resolutions Pivot Points will work with:
Minutes - 1 , 2, 3, 5, 10, 13, 15, 20, 30, 39, 78, 130, 195
Hours - 1, 2, 3, 4, 5, 6
Daily
Weekly
Currently not available on seconds or monthly
------------------------------------------------------------------------------------------------------------------------------------------------------------------------------------------------------------------------------------------------------------------
Background Colors
Background Colors: I have six color schemes I created for this which can be toggled here (they can be edited).
Gray Background for Dark Mode: Having this on looks much better when using dark mode on your charts.
------------------------------------------------------------------------------------------------------------------------------------------------------------------------------------------------------------------------------------------------------------------
Now finally the last portion, Fibonacci Levels
-Fibonacci Levels: This is off, by default, which then uses the standard levels on RSI (30-50-70). When turned on, it removes these and marks fib levels from 0.146 through 0.886.
------------------------------------------------------------------------------------------------------------------------------------------------------------------------------------------------------------------------------------------------------------------
So the quick rundown:
Ultimate RSI contains "divergence/volume weighted" modifications, a slow RSI plot, pivot points , and Fibonacci levels all while auto-plotting divergence and having the trend illustrated in the background colors.
RSI has always been my "go to" indicator, so I hope you all enjoy this as much as I do!

Blackman Filter - The Smoother The BetterIntroduction
Who doesn't like smooth things? I'd like a smooth market price for christmas! But i can't get it, instead its so noisy...so you apply a filter to smooth it, such filters are called low-pass filters, they smooth and its great but they have lag, so nobody really use them, but they are pretty to look at.
Its on a childish note that i will introduce this indicator, so what it is all about? I propose a new FIR filter using a blackman function as filter kernel for financial time-series smoothing, do you prefer the childish tone ? Fear not its surprisingly easy!
The Blackman Function
The blackman function look like a bell shaped curve, look:
The blackman function will produce such curve. This function is called a cosine sum function because she is based on the sum of cosine functions, here only 2.
0.42 - 0.5 * cos(2 * pi * k) + 0.08 * cos(4 * pi * k)
Originally you use this function for windowing , what does it means? In signal processing you have a function called sync function , if you use this function as filter kernel you would get the ideal frequency domain response filter, sometime called brickwall filter, it would be extremely smooth.
Above the optimal low pass filter frequency response.
However the sync function has no ending values and goes on forever, therefore we can't use it for convolution, expect if we apply windowing. Filters using windowing are called windowed-sinc filters, i will describe the procedure below :
1 - Create a sync function = sin(pi*n)/(pi*n)
2 - Truncate it = I only keep the first length points of the sync function.
This create a abrupt end, the frequency of a filter using step 1 as kernel would contain ripples in the pass band and stop band, this is bad! The frequency response would look like this :
3 - I multiply my values of step 2 by a window function, it can the blackman window, i no longer have an abrupt end, its smooth!
The frequency response of the filter using this kernel would no longer have ripples! This is the power of windowing functions.
Here we are not using such thing, but we could in the future. Here instead we use the blackman function as filter kernel, because this function is bell shaped this mean that the filter will certainly be smooth (symmetrical weighting is a rule of thumb for kernels when we want really smooth filters).
The Filter
This filter is quite smooth, unlike the gaussian filter this filter give less weights to recent and past values, this is because the blackman function has fatter tails than the gaussian one. I could make a comparison of both, however they are quite alike, if you often use a gaussian filter its up to you to decide which one you prefer.
The filter can do a better job than the moving average when it comes to preserve the frequency components that constitute the cycles/trend.
We can see that the filter has a greater performance when it comes to keep the shape of the market price, thus it has a slightly better fit.
Conclusion
Ok so in this post you learned a bit about the sync function and windowing, those are basic subjects in signal processing, they allow us to approximate the filter with the ideal frequency response, i also showed you that those windowing function could be used as kernel and that they where pretty smooth on their own, there are many others, but the one i prefer is the blackman windowing function.
I know what you are thinking, "we want trailing stops, alerts, colors, arrows!", and i understand you pal, but sometimes its cool to take a break from all this stuff. However i can tell that i'am working on a side project that aim to estimate rolling maximum/minimum as fast as possible, any experiments will be published here, and i can ensure you that those indicators will make your day quite brighter, we will see that soon.
I hope you learned something from this post! I'am a bit tired (look i'am disappearing !)
Thanks for reading !

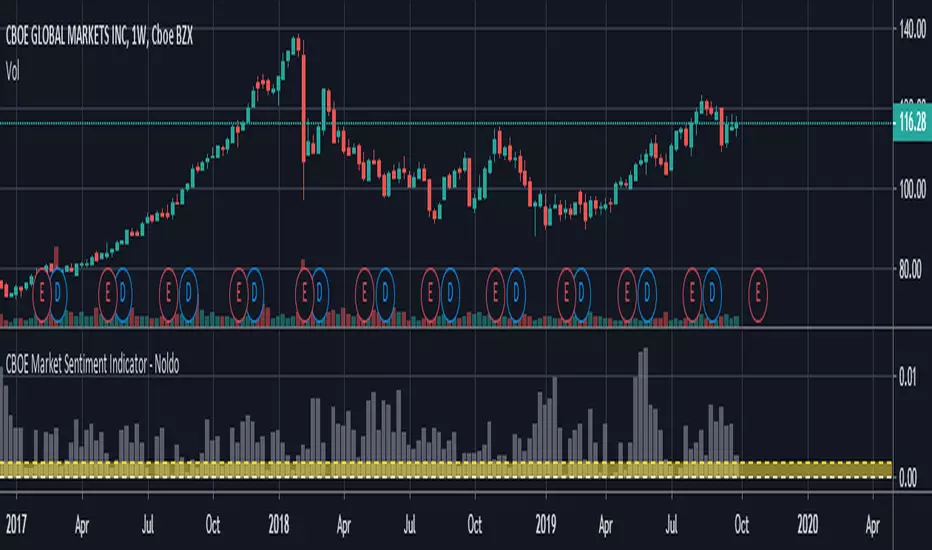
Call / All Ratio ( C / A ) - NoldoFirst of all this script inspired by MagicEins' Put/Call-Ratio-Buschi script .
What is the Put-Call Ratio
The put-call ratio is an indicator ratio that provides information about relative trading volumes of an underlying security's put options to its call options. The put-call ratio has long been viewed as an indicator of investor sentiment in the markets, where a large proportion of puts to calls indicates bearish sentiment, and vice versa. Technical traders use the put-call ratio as an indicator of performance and as a barometer of overall market sentiment. Put-call ratios on broader indexes such as the S&P 500 are also used as more general gauges of market climate.
Put-Call Ratio Interpretation
One way to interpret the put-call ratio is to say that a higher ratio means it's time to sell and a lower ratio means it's time to buy, because when the ratio is high it suggests that people are either expecting or protecting more readily against a future decline in the price of the underlying. A Put-Call ratio between 0.5 and 1 is considered a sideways trend in the markets.
Some also view the Put-Call ratio as a contrarian indicator. Traders know that derivatives are used to do more than place bets; they are used as hedges and insurance. If there's a lot of insurance being placed to the sell side, it means traders are worried about prices falling.
Some traders buy when the put-call ratio is above 1, meaning the market is out of balance to the sell side, and sell when the put-call ratio is below 1, meaning the market is out of balance to the buy side. These traders are looking to make money on the correction. The interpretation of the ratio is left to the analyst's or trader's investment philosophy.
Reference : Investopedia (www.investopedia.com)
Let' s start.
In short, calls represent "bulls" and puts represent "bears".
Some analysts do the opposite,for trend reversals the choice is up to you.
I usually look at the opposite comments in commercial positions because I look at this flow angle neutral.
If you want to do the opposite, you must create Put / All Ratio.
So i created this ratio to observe easily movements under or over 0.50 area .
Or you can take the point close to 0.50 as a horizontal trend. Many more comments can be made.I have a few ideas about this, and I'm going to publish them soon . My best suggestion is that it covers a single bar and is very volatile, so you can look for averages and strong accelerations.
This code is open source under the MIT license. If you have any improvements or corrections to suggest, please send me a pull request via the github repository github.com
Stay tuned , best regards.
MTF IQ IFM Moving AverageMTF ready adaptive MA using Ehler's IQ IFM ( In Phase - Quadrature Instantaneous Frequency Measurement ).
Ehler's formula is a method of quantitatively measuring the length of a market cycle. In this case it is used to calculate the "optimal" adaptive EMA.
Theoretically the length generated by Ehler's formula could be used in many indicators and it's been placed within it's own function so you should be able to simply copy/paste it. HOWEVER pine will not accept series variables for the length input used in built-in functions. You will have to manually code (or find) a version of your indicator that doesn't use the pine built in.
Options :
type : optionally add volume weighting
range : historical range used in IQ IFM
cycle length mult : method to create faster/slower MAs. eg 0.5 is half the length of a cycle and a faster EMA ie EMA10 vs EMA20
low sat fix : some cryptocurrencies with low satoshi values cause an issue with the calculation, if you get no/nonsensical lines, enable this. Shouldn't affect other instruments, but can be disabled just in case.
MTF options: run the calculation on an alternative timeframe
--------------------------------------
If you find it useful please consider a tip/donation :
BTC - 3BMEXEDyWJ58eXUEALYPadbn1wwWKmf6sA

ATR - Baby WhaleScript that shows you the ATR and 0.5 ATR.
You can use this to define your stop loss level when you see a SFP.
Standard setting is the 24 period ATR. You can use this for a 1h chart (24 hours in a day).
So when you play on a 5m chart, you can change the setting to 12 period (12 5m candles in 1 hour).

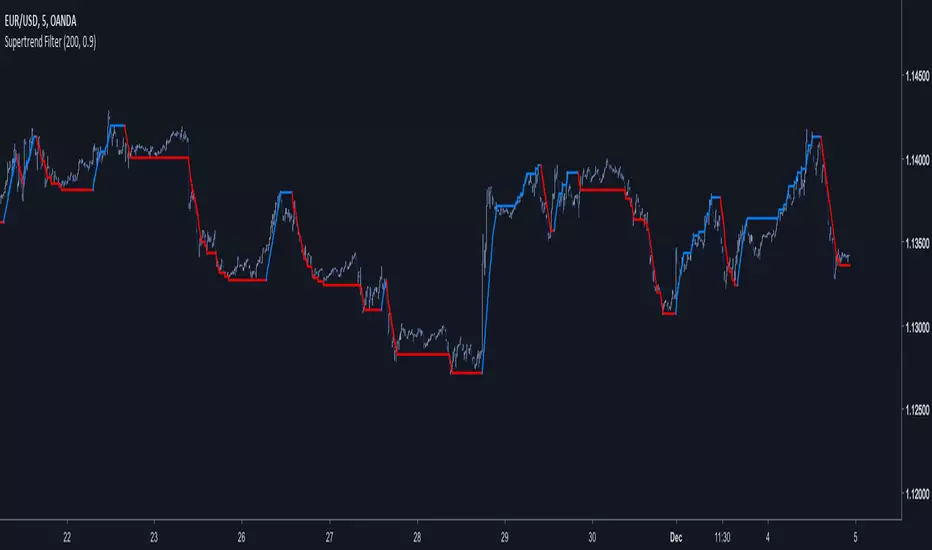
T-Step LSMAIntroduction
The trend step indicator family has produced much interest in the community, those indicators showed in certain cases robustness and reactivity. Their ease of use/interpretation is also a major advantage. Although those indicators have a relatively good fit with the input price, they can still be improved by introducing least-squares fitting on their calculations. This is why i propose a new indicator (T-Step LSMA) which aim to gather all the components of the trend-step indicator family (including the auto-line family).
The indicator will use as a threshold the mean absolute error between the input and the output (T-Channel) scaled with the efficiency ratio (Efficient Trend Step) while using least squares in order to provide a better fit with the price (Auto-Filter).
The Indicator
The interpretation of the indicator is easy, the indicator estimate an up-trending market when in blue, down-trending when in orange, the signal only depend on the trend-step part ( b in the code).
length control the period of the efficiency ratio as well as any components in the lsma calculation. The efficiency ratio allow to provide adaptivity, therefore the threshold will be lower when market is trending and higher when market is ranging.
Sc control the amount of feedback of the indicator, a value of 1 will use only the closing price as input, a value of 0.5 will use 50% of the closing price/indicator output as input, this allow to get smoother results.
It is possible to get the non-smooth version of the indicator by checking "No Smoothing".
This allow the indicator to filter more information.
Least Squares Smoothing - Benefits
One could ask why introducing least squares smoothing, there are several reasons to this choice, we have seen that trend-step indicators are boxy, they filter most of the variational information in the price, introducing least squares smoothing allow to gain back some of this variational information while providing a better fit with the price, the indicator is more noisy but also more practical in certain situations.
For example the indicator in its boxy form can't really be useful as input for other indicators, which is not the case with this version.
Relative strength index of period 14 using the proposed indicator as input.
Down-Sides
The indicator is dependent on the time frame used, larger time frames resulting in an indicator overfitting, sticking with lower time frames might be ideal. The indicator behavior might also change depending on the market in which it is applied.
Setting Up Alerts For The Indicator
Alerts conditions are already set, in order to create an alert based on the indicator follow these steps :
Go to the alert section (the alarm clock) -> create new alert -> select T-Step LSMA in condition -> Below select Up or Dn (Up for a up-trending alert and Dn for a down-trending alert)
In option select "once per bar close", change the message if you want a personalized message.
Conclusion
I don't think i'll post other indicators related to the trend-step framework for the time to comes, nonetheless the ones posted proven to have interesting results as well as many upsides. Although i don't think they would generate positive long-terms returns they could still be of use when using smarter volatility metrics as threshold. The proposed indicator conserve more information than its relatives and might find some use as input for other indicators.
Recommended Use Of The Code
Although i don't put restrictions on the code usage, i still recommend creative and pertinent changes to be made, graphical changes or any minor changes are not necessary, remember that such practice is disrespectful toward the author, you don't want to load up the tradingview servers for nothing right ?
Support Me
Making indicators sure is hard, it takes time and it can be quite lonely to, so i would love talking with you guys while making them :) There isn't better support than the one provided by your friends so drop me a message.
Slow Stochastic Multi-K&D Average StudyStudy that takes to average fib MA in stochastic format.
Provides LONG and SHORT alerts
Long = k crossover d
Short = k crossunder d
set alerts for conservative entries
When creating alerts
Set to "Crossing Up"
Value = anything between 0 and 1
I usually set to 0.5
Set to "Once per Bar" to give you the fastest response

dywm OscillatorI think that it can be used as a hit point of the trend
There is a horizontal line in the part of 0, 1, 1.5, -0.5, but there is no meaning
Top point of mountain is selling point at downtrend
When uptrend, bottom point of valley is buying point
トレンドの押し目などに使えると思います
0,1,1.5、-0.5の部分に横ラインがありますが意味は無いです
ダウントレンド時、山の頂点が売りポイント
アップトレンド時、谷の底点が買いポイント

Trend CheckerAn indicator that tell if market is trending or ranging, when the indicator is greater than 0.5 then market is trending, when the indicator is equal to 1 market is overbought/oversold.

Backtesting & Trading Engine [PineCoders]The PineCoders Backtesting and Trading Engine is a sophisticated framework with hybrid code that can run as a study to generate alerts for automated or discretionary trading while simultaneously providing backtest results. It can also easily be converted to a TradingView strategy in order to run TV backtesting. The Engine comes with many built-in strats for entries, filters, stops and exits, but you can also add you own.
If, like any self-respecting strategy modeler should, you spend a reasonable amount of time constantly researching new strategies and tinkering, our hope is that the Engine will become your inseparable go-to tool to test the validity of your creations, as once your tests are conclusive, you will be able to run this code as a study to generate the alerts required to put it in real-world use, whether for discretionary trading or to interface with an execution bot/app. You may also find the backtesting results the Engine produces in study mode enough for your needs and spend most of your time there, only occasionally converting to strategy mode in order to backtest using TV backtesting.
As you will quickly grasp when you bring up this script’s Settings, this is a complex tool. While you will be able to see results very quickly by just putting it on a chart and using its built-in strategies, in order to reap the full benefits of the PineCoders Engine, you will need to invest the time required to understand the subtleties involved in putting all its potential into play.
Disclaimer: use the Engine at your own risk.
Before we delve in more detail, here’s a bird’s eye view of the Engine’s features:
More than 40 built-in strategies,
Customizable components,
Coupling with your own external indicator,
Simple conversion from Study to Strategy modes,
Post-Exit analysis to search for alternate trade outcomes,
Use of the Data Window to show detailed bar by bar trade information and global statistics, including some not provided by TV backtesting,
Plotting of reminders and generation of alerts on in-trade events.
By combining your own strats to the built-in strats supplied with the Engine, and then tuning the numerous options and parameters in the Inputs dialog box, you will be able to play what-if scenarios from an infinite number of permutations.
USE CASES
You have written an indicator that provides an entry strat but it’s missing other components like a filter and a stop strategy. You add a plot in your indicator that respects the Engine’s External Signal Protocol, connect it to the Engine by simply selecting your indicator’s plot name in the Engine’s Settings/Inputs and then run tests on different combinations of entry stops, in-trade stops and profit taking strats to find out which one produces the best results with your entry strat.
You are building a complex strategy that you will want to run as an indicator generating alerts to be sent to a third-party execution bot. You insert your code in the Engine’s modules and leverage its trade management code to quickly move your strategy into production.
You have many different filters and want to explore results using them separately or in combination. Integrate the filter code in the Engine and run through different permutations or hook up your filtering through the external input and control your filter combos from your indicator.
You are tweaking the parameters of your entry, filter or stop strat. You integrate it in the Engine and evaluate its performance using the Engine’s statistics.
You always wondered what results a random entry strat would yield on your markets. You use the Engine’s built-in random entry strat and test it using different combinations of filters, stop and exit strats.
You want to evaluate the impact of fees and slippage on your strategy. You use the Engine’s inputs to play with different values and get immediate feedback in the detailed numbers provided in the Data Window.
You just want to inspect the individual trades your strategy generates. You include it in the Engine and then inspect trades visually on your charts, looking at the numbers in the Data Window as you move your cursor around.
You have never written a production-grade strategy and you want to learn how. Inspect the code in the Engine; you will find essential components typical of what is being used in actual trading systems.
You have run your system for a while and have compiled actual slippage information and your broker/exchange has updated his fees schedule. You enter the information in the Engine and run it on your markets to see the impact this has on your results.
FEATURES
Before going into the detail of the Inputs and the Data Window numbers, here’s a more detailed overview of the Engine’s features.
Built-in strats
The engine comes with more than 40 pre-coded strategies for the following standard system components:
Entries,
Filters,
Entry stops,
2 stage in-trade stops with kick-in rules,
Pyramiding rules,
Hard exits.
While some of the filter and stop strats provided may be useful in production-quality systems, you will not devise crazy profit-generating systems using only the entry strats supplied; that part is still up to you, as will be finding the elusive combination of components that makes winning systems. The Engine will, however, provide you with a solid foundation where all the trade management nitty-gritty is handled for you. By binding your custom strats to the Engine, you will be able to build reliable systems of the best quality currently allowed on the TV platform.
On-chart trade information
As you move over the bars in a trade, you will see trade numbers in the Data Window change at each bar. The engine calculates the P&L at every bar, including slippage and fees that would be incurred were the trade exited at that bar’s close. If the trade includes pyramided entries, those will be taken into account as well, although for those, final fees and slippage are only calculated at the trade’s exit.
You can also see on-chart markers for the entry level, stop positions, in-trade special events and entries/exits (you will want to disable these when using the Engine in strategy mode to see TV backtesting results).
Customization
You can couple your own strats to the Engine in two ways:
1. By inserting your own code in the Engine’s different modules. The modular design should enable you to do so with minimal effort by following the instructions in the code.
2. By linking an external indicator to the engine. After making the proper selections in the engine’s Settings and providing values respecting the engine’s protocol, your external indicator can, when the Engine is used in Indicator mode only:
Tell the engine when to enter long or short trades, but let the engine’s in-trade stop and exit strats manage the exits,
Signal both entries and exits,
Provide an entry stop along with your entry signal,
Filter other entry signals generated by any of the engine’s entry strats.
Conversion from strategy to study
TradingView strategies are required to backtest using the TradingView backtesting feature, but if you want to generate alerts with your script, whether for automated trading or just to trigger alerts that you will use in discretionary trading, your code has to run as a study since, for the time being, strategies can’t generate alerts. From hereon we will use indicator as a synonym for study.
Unless you want to maintain two code bases, you will need hybrid code that easily flips between strategy and indicator modes, and your code will need to restrict its use of strategy() calls and their arguments if it’s going to be able to run both as an indicator and a strategy using the same trade logic. That’s one of the benefits of using this Engine. Once you will have entered your own strats in the Engine, it will be a matter of commenting/uncommenting only four lines of code to flip between indicator and strategy modes in a matter of seconds.
Additionally, even when running in Indicator mode, the Engine will still provide you with precious numbers on your individual trades and global results, some of which are not available with normal TradingView backtesting.
Post-Exit Analysis for alternate outcomes (PEA)
While typical backtesting shows results of trade outcomes, PEA focuses on what could have happened after the exit. The intention is to help traders get an idea of the opportunity/risk in the bars following the trade in order to evaluate if their exit strategies are too aggressive or conservative.
After a trade is exited, the Engine’s PEA module continues analyzing outcomes for a user-defined quantity of bars. It identifies the maximum opportunity and risk available in that space, and calculates the drawdown required to reach the highest opportunity level post-exit, while recording the number of bars to that point.
Typically, if you can’t find opportunity greater than 1X past your trade using a few different reasonable lengths of PEA, your strategy is doing pretty good at capturing opportunity. Remember that 100% of opportunity is never capturable. If, however, PEA was finding post-trade maximum opportunity of 3 or 4X with average drawdowns of 0.3 to those areas, this could be a clue revealing your system is exiting trades prematurely. To analyze PEA numbers, you can uncomment complete sets of plots in the Plot module to reveal detailed global and individual PEA numbers.
Statistics
The Engine provides stats on your trades that TV backtesting does not provide, such as:
Average Profitability Per Trade (APPT), aka statistical expectancy, a crucial value.
APPT per bar,
Average stop size,
Traded volume .
It also shows you on a trade-by-trade basis, on-going individual trade results and data.
In-trade events
In-trade events can plot reminders and trigger alerts when they occur. The built-in events are:
Price approaching stop,
Possible tops/bottoms,
Large stop movement (for discretionary trading where stop is moved manually),
Large price movements.
Slippage and Fees
Even when running in indicator mode, the Engine allows for slippage and fees to be included in the logic and test results.
Alerts
The alert creation mechanism allows you to configure alerts on any combination of the normal or pyramided entries, exits and in-trade events.
Backtesting results
A few words on the numbers calculated in the Engine. Priority is given to numbers not shown in TV backtesting, as you can readily convert the script to a strategy if you need them.
We have chosen to focus on numbers expressing results relative to X (the trade’s risk) rather than in absolute currency numbers or in other more conventional but less useful ways. For example, most of the individual trade results are not shown in percentages, as this unit of measure is often less meaningful than those expressed in units of risk (X). A trade that closes with a +25% result, for example, is a poor outcome if it was entered with a -50% stop. Expressed in X, this trade’s P&L becomes 0.5, which provides much better insight into the trade’s outcome. A trade that closes with a P&L of +2X has earned twice the risk incurred upon entry, which would represent a pre-trade risk:reward ratio of 2.
The way to go about it when you think in X’s and that you adopt the sound risk management policy to risk a fixed percentage of your account on each trade is to equate a currency value to a unit of X. E.g. your account is 10K USD and you decide you will risk a maximum of 1% of it on each trade. That means your unit of X for each trade is worth 100 USD. If your APPT is 2X, this means every time you risk 100 USD in a trade, you can expect to make, on average, 200 USD.
By presenting results this way, we hope that the Engine’s statistics will appeal to those cognisant of sound risk management strategies, while gently leading traders who aren’t, towards them.
We trade to turn in tangible profits of course, so at some point currency must come into play. Accordingly, some values such as equity, P&L, slippage and fees are expressed in currency.
Many of the usual numbers shown in TV backtests are nonetheless available, but they have been commented out in the Engine’s Plot module.
Position sizing and risk management
All good system designers understand that optimal risk management is at the very heart of all winning strategies. The risk in a trade is defined by the fraction of current equity represented by the amplitude of the stop, so in order to manage risk optimally on each trade, position size should adjust to the stop’s amplitude. Systems that enter trades with a fixed stop amplitude can get away with calculating position size as a fixed percentage of current equity. In the context of a test run where equity varies, what represents a fixed amount of risk translates into different currency values.
Dynamically adjusting position size throughout a system’s life is optimal in many ways. First, as position sizing will vary with current equity, it reproduces a behavioral pattern common to experienced traders, who will dial down risk when confronted to poor performance and increase it when performance improves. Second, limiting risk confers more predictability to statistical test results. Third, position sizing isn’t just about managing risk, it’s also about maximizing opportunity. By using the maximum leverage (no reference to trading on margin here) into the trade that your risk management strategy allows, a dynamic position size allows you to capture maximal opportunity.
To calculate position sizes using the fixed risk method, we use the following formula: Position = Account * MaxRisk% / Stop% [, which calculates a position size taking into account the trade’s entry stop so that if the trade is stopped out, 100 USD will be lost. For someone who manages risk this way, common instructions to invest a certain percentage of your account in a position are simply worthless, as they do not take into account the risk incurred in the trade.
The Engine lets you select either the fixed risk or fixed percentage of equity position sizing methods. The closest thing to dynamic position sizing that can currently be done with alerts is to use a bot that allows syntax to specify position size as a percentage of equity which, while being dynamic in the sense that it will adapt to current equity when the trade is entered, does not allow us to modulate position size using the stop’s amplitude. Changes to alerts are on the way which should solve this problem.
In order for you to simulate performance with the constraint of fixed position sizing, the Engine also offers a third, less preferable option, where position size is defined as a fixed percentage of initial capital so that it is constant throughout the test and will thus represent a varying proportion of current equity.
Let’s recap. The three position sizing methods the Engine offers are:
1. By specifying the maximum percentage of risk to incur on your remaining equity, so the Engine will dynamically adjust position size for each trade so that, combining the stop’s amplitude with position size will yield a fixed percentage of risk incurred on current equity,
2. By specifying a fixed percentage of remaining equity. Note that unless your system has a fixed stop at entry, this method will not provide maximal risk control, as risk will vary with the amplitude of the stop for every trade. This method, as the first, does however have the advantage of automatically adjusting position size to equity. It is the Engine’s default method because it has an equivalent in TV backtesting, so when flipping between indicator and strategy mode, test results will more or less correspond.
3. By specifying a fixed percentage of the Initial Capital. While this is the least preferable method, it nonetheless reflects the reality confronted by most system designers on TradingView today. In this case, risk varies both because the fixed position size in initial capital currency represents a varying percentage of remaining equity, and because the trade’s stop amplitude may vary, adding another variability vector to risk.
Note that the Engine cannot display equity results for strategies entering trades for a fixed amount of shares/contracts at a variable price.
SETTINGS/INPUTS
Because the initial text first published with a script cannot be edited later and because there are just too many options, the Engine’s Inputs will not be covered in minute detail, as they will most certainly evolve. We will go over them with broad strokes; you should be able to figure the rest out. If you have questions, just ask them here or in the PineCoders Telegram group.
Display
The display header’s checkbox does nothing.
For the moment, only one exit strategy uses a take profit level, so only that one will show information when checking “Show Take Profit Level”.
Entries
You can activate two simultaneous entry strats, each selected from the same set of strats contained in the Engine. If you select two and they fire simultaneously, the main strat’s signal will be used.
The random strat in each list uses a different seed, so you will get different results from each.
The “Filter transitions” and “Filter states” strats delegate signal generation to the selected filter(s). “Filter transitions” signals will only fire when the filter transitions into bull/bear state, so after a trade is stopped out, the next entry may take some time to trigger if the filter’s state does not change quickly. When you choose “Filter states”, then a new trade will be entered immediately after an exit in the direction the filter allows.
If you select “External Indicator”, your indicator will need to generate a +2/-2 (or a positive/negative stop value) to enter a long/short position, providing the selected filters allow for it. If you wish to use the Engine’s capacity to also derive the entry stop level from your indicator’s signal, then you must explicitly choose this option in the Entry Stops section.
Filters
You can activate as many filters as you wish; they are additive. The “Maximum stop allowed on entry” is an important component of proper risk management. If your system has an average 3% stop size and you need to trade using fixed position sizes because of alert/execution bot limitations, you must use this filter because if your system was to enter a trade with a 15% stop, that trade would incur 5 times the normal risk, and its result would account for an abnormally high proportion in your system’s performance.
Remember that any filter can also be used as an entry signal, either when it changes states, or whenever no trade is active and the filter is in a bull or bear mode.
Entry Stops
An entry stop must be selected in the Engine, as it requires a stop level before the in-trade stop is calculated. Until the selected in-trade stop strat generates a stop that comes closer to price than the entry stop (or respects another one of the in-trade stops kick in strats), the entry stop level is used.
It is here that you must select “External Indicator” if your indicator supplies a +price/-price value to be used as the entry stop. A +price is expected for a long entry and a -price value will enter a short with a stop at price. Note that the price is the absolute price, not an offset to the current price level.
In-Trade Stops
The Engine comes with many built-in in-trade stop strats. Note that some of them share the “Length” and “Multiple” field, so when you swap between them, be sure that the length and multiple in use correspond to what you want for that stop strat. Suggested defaults appear with the name of each strat in the dropdown.
In addition to the strat you wish to use, you must also determine when it kicks in to replace the initial entry’s stop, which is determined using different strats. For strats where you can define a positive or negative multiple of X, percentage or fixed value for a kick-in strat, a positive value is above the trade’s entry fill and a negative one below. A value of zero represents breakeven.
Pyramiding
What you specify in this section are the rules that allow pyramiding to happen. By themselves, these rules will not generate pyramiding entries. For those to happen, entry signals must be issued by one of the active entry strats, and conform to the pyramiding rules which act as a filter for them. The “Filter must allow entry” selection must be chosen if you want the usual system’s filters to act as additional filtering criteria for your pyramided entries.
Hard Exits
You can choose from a variety of hard exit strats. Hard exits are exit strategies which signal trade exits on specific events, as opposed to price breaching a stop level in In-Trade Stops strategies. They are self-explanatory. The last one labelled When Take Profit Level (multiple of X) is reached is the only one that uses a level, but contrary to stops, it is above price and while it is relative because it is expressed as a multiple of X, it does not move during the trade. This is the level called Take Profit that is show when the “Show Take Profit Level” checkbox is checked in the Display section.
While stops focus on managing risk, hard exit strategies try to put the emphasis on capturing opportunity.
Slippage
You can define it as a percentage or a fixed value, with different settings for entries and exits. The entry and exit markers on the chart show the impact of slippage on the entry price (the fill).
Fees
Fees, whether expressed as a percentage of position size in and out of the trade or as a fixed value per in and out, are in the same units of currency as the capital defined in the Position Sizing section. Fees being deducted from your Capital, they do not have an impact on the chart marker positions.
In-Trade Events
These events will only trigger during trades. They can be helpful to act as reminders for traders using the Engine as assistance to discretionary trading.
Post-Exit Analysis
It is normally on. Some of its results will show in the Global Numbers section of the Data Window. Only a few of the statistics generated are shown; many more are available, but commented out in the Plot module.
Date Range Filtering
Note that you don’t have to change the dates to enable/diable filtering. When you are done with a specific date range, just uncheck “Date Range Filtering” to disable date filtering.
Alert Triggers
Each selection corresponds to one condition. Conditions can be combined into a single alert as you please. Just be sure you have selected the ones you want to trigger the alert before you create the alert. For example, if you trade in both directions and you want a single alert to trigger on both types of exits, you must select both “Long Exit” and “Short Exit” before creating your alert.
Once the alert is triggered, these settings no longer have relevance as they have been saved with the alert.
When viewing charts where an alert has just triggered, if your alert triggers on more than one condition, you will need the appropriate markers active on your chart to figure out which condition triggered the alert, since plotting of markers is independent of alert management.
Position sizing
You have 3 options to determine position size:
1. Proportional to Stop -> Variable, with a cap on size.
2. Percentage of equity -> Variable.
3. Percentage of Initial Capital -> Fixed.
External Indicator
This is where you connect your indicator’s plot that will generate the signals the Engine will act upon. Remember this only works in Indicator mode.
DATA WINDOW INFORMATION
The top part of the window contains global numbers while the individual trade information appears in the bottom part. The different types of units used to express values are:
curr: denotes the currency used in the Position Sizing section of Inputs for the Initial Capital value.
quote: denotes quote currency, i.e. the value the instrument is expressed in, or the right side of the market pair (USD in EURUSD ).
X: the stop’s amplitude, itself expressed in quote currency, which we use to express a trade’s P&L, so that a trade with P&L=2X has made twice the stop’s amplitude in profit. This is sometimes referred to as R, since it represents one unit of risk. It is also the unit of measure used in the APPT, which denotes expected reward per unit of risk.
X%: is also the stop’s amplitude, but expressed as a percentage of the Entry Fill.
The numbers appearing in the Data Window are all prefixed:
“ALL:” the number is the average for all first entries and pyramided entries.
”1ST:” the number is for first entries only.
”PYR:” the number is for pyramided entries only.
”PEA:” the number is for Post-Exit Analyses
Global Numbers
Numbers in this section represent the results of all trades up to the cursor on the chart.
Average Profitability Per Trade (X): This value is the most important gauge of your strat’s worthiness. It represents the returns that can be expected from your strat for each unit of risk incurred. E.g.: your APPT is 2.0, thus for every unit of currency you invest in a trade, you can on average expect to obtain 2 after the trade. APPT is also referred to as “statistical expectancy”. If it is negative, your strategy is losing, even if your win rate is very good (it means your winning trades aren’t winning enough, or your losing trades lose too much, or both). Its counterpart in currency is also shown, as is the APPT/bar, which can be a useful gauge in deciding between rivalling systems.
Profit Factor: Gross of winning trades/Gross of losing trades. Strategy is profitable when >1. Not as useful as the APPT because it doesn’t take into account the win rate and the average win/loss per trade. It is calculated from the total winning/losing results of this particular backtest and has less predictive value than the APPT. A good profit factor together with a poor APPT means you just found a chart where your system outperformed. Relying too much on the profit factor is a bit like a poker player who would think going all in with two’s against aces is optimal because he just won a hand that way.
Win Rate: Percentage of winning trades out of all trades. Taken alone, it doesn’t have much to do with strategy profitability. You can have a win rate of 99% but if that one trade in 100 ruins you because of poor risk management, 99% doesn’t look so good anymore. This number speaks more of the system’s profile than its worthiness. Still, it can be useful to gauge if the system fits your personality. It can also be useful to traders intending to sell their systems, as low win rate systems are more difficult to sell and require more handholding of worried customers.
Equity (curr): This the sum of initial capital and the P&L of your system’s trades, including fees and slippage.
Return on Capital is the equivalent of TV’s Net Profit figure, i.e. the variation on your initial capital.
Maximum drawdown is the maximal drawdown from the highest equity point until the drop . There is also a close to close (meaning it doesn’t take into account in-trade variations) maximum drawdown value commented out in the code.
The next values are self-explanatory, until:
PYR: Avg Profitability Per Entry (X): this is the APPT for all pyramided entries.
PEA: Avg Max Opp . Available (X): the average maximal opportunity found in the Post-Exit Analyses.
PEA: Avg Drawdown to Max Opp . (X): this represents the maximum drawdown (incurred from the close at the beginning of the PEA analysis) required to reach the maximal opportunity point.
Trade Information
Numbers in this section concern only the current trade under the cursor. Most of them are self-explanatory. Use the description’s prefix to determine what the values applies to.
PYR: Avg Profitability Per Entry (X): While this value includes the impact of all current pyramided entries (and only those) and updates when you move your cursor around, P&L only reflects fees at the trade’s last bar.
PEA: Max Opp . Available (X): It’s the most profitable close reached post-trade, measured from the trade’s Exit Fill, expressed in the X value of the trade the PEA follows.
PEA: Drawdown to Max Opp . (X): This is the maximum drawdown from the trade’s Exit Fill that needs to be sustained in order to reach the maximum opportunity point, also expressed in X. Note that PEA numbers do not include slippage and fees.
EXTERNAL SIGNAL PROTOCOL
Only one external indicator can be connected to a script; in order to leverage its use to the fullest, the engine provides options to use it as either an entry signal, an entry/exit signal or a filter. When used as an entry signal, you can also use the signal to provide the entry’s stop. Here’s how this works:
For filter state: supply +1 for bull (long entries allowed), -1 for bear (short entries allowed).
For entry signals: supply +2 for long, -2 for short.
For exit signals: supply +3 for exit from long, -3 for exit from short.
To send an entry stop level with an entry signal: Send positive stop level for long entry (e.g. 103.33 to enter a long with a stop at 103.33), negative stop level for short entry (e.g. -103.33 to enter a short with a stop at 103.33). If you use this feature, your indicator will have to check for exact stop levels of 1.0, 2.0 or 3.0 and their negative counterparts, and fudge them with a tick in order to avoid confusion with other signals in the protocol.
Remember that mere generation of the values by your indicator will have no effect until you explicitly allow their use in the appropriate sections of the Engine’s Settings/Inputs.
An example of a script issuing a signal for the Engine is published by PineCoders.
RECOMMENDATIONS TO ASPIRING SYSTEM DESIGNERS
Stick to higher timeframes. On progressively lower timeframes, margins decrease and fees and slippage take a proportionally larger portion of profits, to the point where they can very easily turn a profitable strategy into a losing one. Additionally, your margin for error shrinks as the equilibrium of your system’s profitability becomes more fragile with the tight numbers involved in the shorter time frames. Avoid <1H time frames.
Know and calculate fees and slippage. To avoid market shock, backtest using conservative fees and slippage parameters. Systems rarely show unexpectedly good returns when they are confronted to the markets, so put all chances on your side by being outrageously conservative—or a the very least, realistic. Test results that do not include fees and slippage are worthless. Slippage is there for a reason, and that’s because our interventions in the market change the market. It is easier to find alpha in illiquid markets such as cryptos because not many large players participate in them. If your backtesting results are based on moving large positions and you don’t also add the inevitable slippage that will occur when you enter/exit thin markets, your backtesting will produce unrealistic results. Even if you do include large slippage in your settings, the Engine can only do so much as it will not let slippage push fills past the high or low of the entry bar, but the gap may be much larger in illiquid markets.
Never test and optimize your system on the same dataset , as that is the perfect recipe for overfitting or data dredging, which is trying to find one precise set of rules/parameters that works only on one dataset. These setups are the most fragile and often get destroyed when they meet the real world.
Try to find datasets yielding more than 100 trades. Less than that and results are not as reliable.
Consider all backtesting results with suspicion. If you never entertained sceptic tendencies, now is the time to begin. If your backtest results look really good, assume they are flawed, either because of your methodology, the data you’re using or the software doing the testing. Always assume the worse and learn proper backtesting techniques such as monte carlo simulations and walk forward analysis to avoid the traps and biases that unchecked greed will set for you. If you are not familiar with concepts such as survivor bias, lookahead bias and confirmation bias, learn about them.
Stick to simple bars or candles when designing systems. Other types of bars often do not yield reliable results, whether by design (Heikin Ashi) or because of the way they are implemented on TV (Renko bars).
Know that you don’t know and use that knowledge to learn more about systems and how to properly test them, about your biases, and about yourself.
Manage risk first , then capture opportunity.
Respect the inherent uncertainty of the future. Cleanse yourself of the sad arrogance and unchecked greed common to newcomers to trading. Strive for rationality. Respect the fact that while backtest results may look promising, there is no guarantee they will repeat in the future (there is actually a high probability they won’t!), because the future is fundamentally unknowable. If you develop a system that looks promising, don’t oversell it to others whose greed may lead them to entertain unreasonable expectations.
Have a plan. Understand what king of trading system you are trying to build. Have a clear picture or where entries, exits and other important levels will be in the sort of trade you are trying to create with your system. This stated direction will help you discard more efficiently many of the inevitably useless ideas that will pop up during system design.
Be wary of complexity. Experienced systems engineers understand how rapidly complexity builds when you assemble components together—however simple each one may be. The more complex your system, the more difficult it will be to manage.
Play! . Allow yourself time to play around when you design your systems. While much comes about from working with a purpose, great ideas sometimes come out of just trying things with no set goal, when you are stuck and don’t know how to move ahead. Have fun!
@LucF
NOTES
While the engine’s code can supply multiple consecutive entries of longs or shorts in order to scale positions (pyramid), all exits currently assume the execution bot will exit the totality of the position. No partial exits are currently possible with the Engine.
Because the Engine is literally crippled by the limitations on the number of plots a script can output on TV; it can only show a fraction of all the information it calculates in the Data Window. You will find in the Plot Module vast amounts of commented out lines that you can activate if you also disable an equivalent number of other plots. This may be useful to explore certain characteristics of your system in more detail.
When backtesting using the TV backtesting feature, you will need to provide the strategy parameters you wish to use through either Settings/Properties or by changing the default values in the code’s header. These values are defined in variables and used not only in the strategy() statement, but also as defaults in the Engine’s relevant Inputs.
If you want to test using pyramiding, then both the strategy’s Setting/Properties and the Engine’s Settings/Inputs need to allow pyramiding.
If you find any bugs in the Engine, please let us know.
THANKS
To @glaz for allowing the use of his unpublished MA Squize in the filters.
To @everget for his Chandelier stop code, which is also used as a filter in the Engine.
To @RicardoSantos for his pseudo-random generator, and because it’s from him that I first read in the Pine chat about the idea of using an external indicator as input into another. In the PineCoders group, @theheirophant then mentioned the idea of using it as a buy/sell signal and @simpelyfe showed a piece of code implementing the idea. That’s the tortuous story behind the use of the external indicator in the Engine.
To @admin for the Volatility stop’s original code and for the donchian function lifted from Ichimoku .
To @BobHoward21 for the v3 version of Volatility Stop .
To @scarf and @midtownsk8rguy for the color tuning.
To many other scripters who provided encouragement and suggestions for improvement during the long process of writing and testing this piece of code.
To J. Welles Wilder Jr. for ATR, used extensively throughout the Engine.
To TradingView for graciously making an account available to PineCoders.
And finally, to all fellow PineCoders for the constant intellectual stimulation; it is a privilege to share ideas with you all. The Engine is for all TradingView PineCoders, of course—but especially for you.
Look first. Then leap.

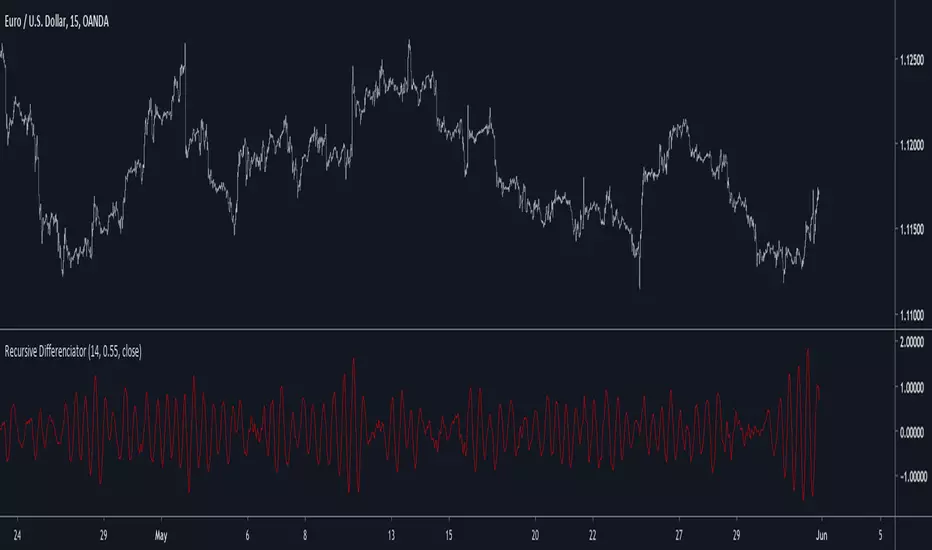
Recursive DifferenciatorIntroduction
Cycles can be spotted by using a wide range of methods, most of them will involve bandpass filtering, here i will show a method using recursion with the change() function.
The Indicator
As i explained in other indicators using recursion i posted rescaling the input is important, i will use the rsi of an exponential moving average as input. alpha control the amount of output the indicator will use as input, values closer to 0.5 will use more input resulting in more periodic results.
Lowering alpha when length is higher can help get more periodic results.
Conclusion
I have showed a new cycle indicator using recursion. Recursion with oscillators can highlights cycles in price thus being easier to predict.
Thanks for reading !
ATR stop and threshold valueOne can use the average true range for both entries and stops. A possible way to reduce false breakouts is to enter (say) at 0.5 * atr above the breakout level. Then you could use a 1.0*atr for a stop setting. This indicator allows you to set entries and stops for both long and short setups directly on the chart. I use it with breakout systems as it allows me to easily setup my trades.

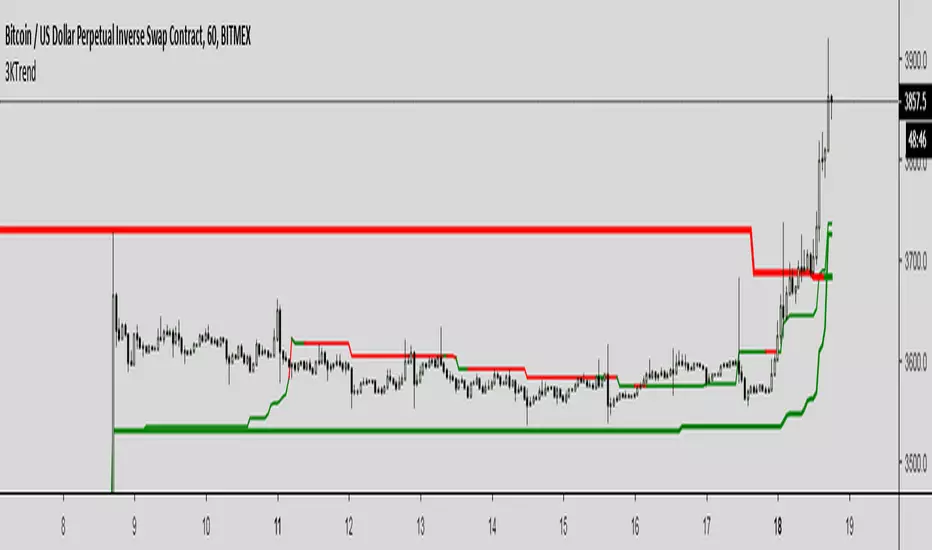
Triple Kijun Trend by SpiralmanIspired from "Oscars Simple Trend Ichimoku Kijun-sen" by CapnOscar
Script displays 3 kijun lines: one for current TF, second one emulates it for TF 4 times higher, third one for x16.
For example on 1H chart there will be 3 kijuns: one for 1H, second one for 4H (emulated), third one for 16H (emulated).
Kijuns change colors based on their position relative to price.
Kijun Sen
The base line, the slower EMA derivative, and a dynamic representation of the mean. With that said, the Kijun serves as both critical support and resistance levels for price. How does it work, and why would the Kijun be superior to commonly used moving average indicators? Fun fact: The Kijun dynamically equalizes itself to be the 50% retracement (or 0.5 Fibonacci level) of price for any given swing, and price will ALWAYS gravitate to the Kijun at some point regardless of how far above or below it is from it. By taking the median of price extremes, the Kijun accounts for volatility that other MAs or EMAs do not. A flat horizontal Kijun means that price extremes have not changed, and that the current trend losing momentum. Crypto-adjusted calculation: (highest high + lowest low) / 2 calculated over the last 60 periods.
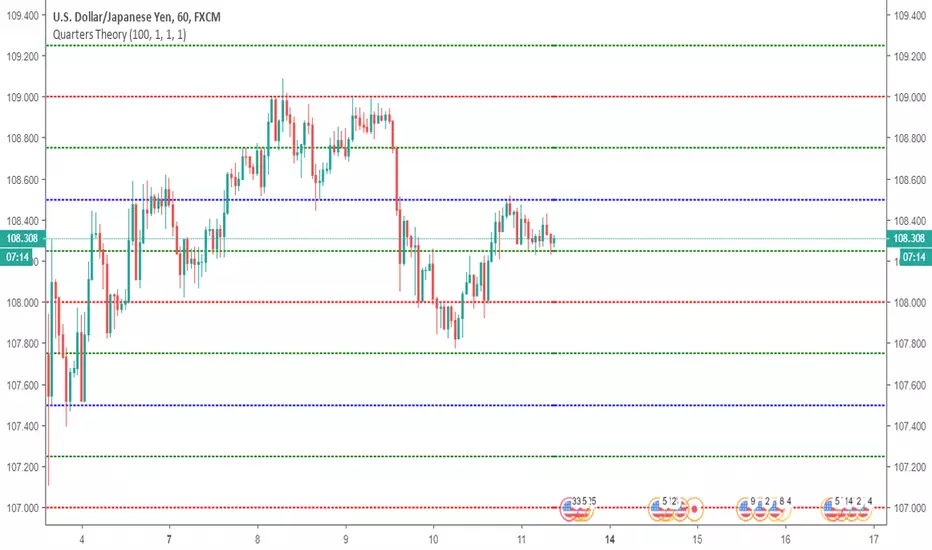
Quarters TheoryThis indicator helps you to put Quarter Theory lines on your chart. It's defaults are meant for EURUSD , but you can change it for other charts. There are 16 lines in this indicator.
For EURUSD recommended settings right now are: Starting Price (Bottom):1.12 and Gap: 0.0025
USDCAD: Starting Price (Bottom):1.315 and Gap: 0.005
EURAUD: Starting Price (Bottom):1.59 and Gap: 0.005
USDJPY: Starting Price (Bottom):107 and Gap: 0.5
USDCHF: Starting Price (Bottom):0.97 and Gap: 0.0025
BTCUSD: Starting Price (Bottom):3200 and Gap: 100
XAUUSD: Starting Price (Bottom): 1230 and Gap: 5
These settings are the ones I use, but you could find better settings for yourself.
Works very well on JPY pairs.
Horizontal LinesHorizontal lines help you to put Quarter Theory lines on your chart. It's defaults are meant for EURUSD , but you can change it for other charts. There are 16 lines in this indicator.
For EURUSD recommended settings right now are: Starting Price (Bottom):1.12 and Gap: 0.0025
USDCAD: Starting Price (Bottom):1.315 and Gap: 0.005
EURAUD: Starting Price (Bottom):1.59 and Gap: 0.005
USDJPY: Starting Price (Bottom):107 and Gap: 0.5
USDCHF: Starting Price (Bottom):0.97 and Gap: 0.0025
BTCUSD: Starting Price (Bottom):3200 and Gap: 100
XAUUSD: Starting Price (Bottom): 1230 and Gap: 5
These settings are the ones I use, but you could find better settings for yourself. It works very well on JPY pairs.
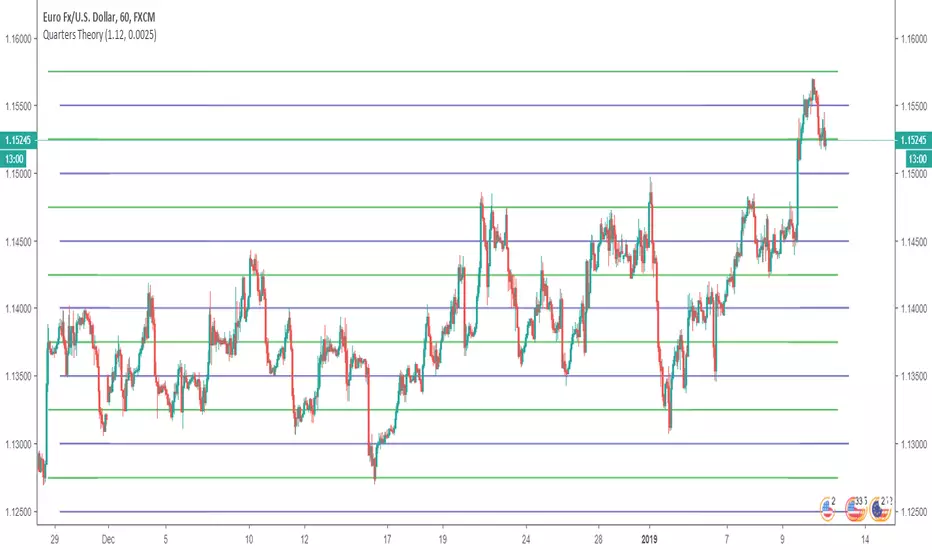
Trend Trigger Factor T3Trend Trigger Factor was described by M.H. Pee in the Technical Analysis of Stocks and Commodities magazine in December, 2004.
From the author:
The TTF (Trend Trigger Factor) will help you long in an uptrend and short in an downtrend. This indicator allows you to follow the trend and capitalize on that rare nonrandom trend component of the markets.
Basically it calculates range from highest high and lowest low on 2 different time periods: a recent one and an older one, called buypower and sellpower and then apply the formula:
100*(BuyPower-SellPower)/(0.5*(BuyPower+SellPower))
to calculate the TTF.
The trend trigger is made with a fixed levels (that you can change in the setting), when the TTF is over the upper level, the trend is up and when it’s below the lower level, the trend is down.
In this version the TTF value is smoothed with a Wilson’s T3 average.
Thanks for the work of Nicolas @ www.prorealcode.com

Supertrend FilterA derivation of the famous SuperTrend indicator.
My motivation for such indicator was to use more recursion in the original SuperTrend code, this work was made quite fast but feel free to modify it, as always my work is more for inspirational use than anything else so i hope it will inspire you to get more involved with the SuperTrend code or to start coding with Pine.
The indicator no longer act as a trailing-stop but more like a filter, this is due to the fact that the indicator conditions are swapped and that the output is reused many times in the calculation.
Parameters change as well and involve particular gestion. The Factor Parameter is no longer an integer but decimals such that 0 < Factor < 1 .
When the Period is high the indicator tend to become less linear/static and look more like a classic moving average.So it is important to have higher Factor values when the Period is high and reciprocally.Here a table to help you with parameters settings :
for Period = 1 to 50 Factor = 0.5
for Period = 50 to 100 Factor = 0.6
for Period = 100 to 150 Factor = 0.7
for Period = 150 to 200 Factor = 0.8
for Period = 200 to 300 Factor = 0.9
There could be a formula to scale the Factor depending on the Period but there would be no proof that the scaling method used is optimal.
Hope you enjoy
For any questions/demands feel free to pm me, i would be happy to help you