Philakone 55/100 EMA incl. color & sizeInspired on Philakone's EMA settings in his colors and line width. Also added 100 EMA.
在脚本中搜索"马斯克+100万"
Multiple Ema 20/50/100Multiple Ema 20/50/100 and you can add more EMA Plot easily by changing the codes.


50, 100, 200 EMAsA simple script that displays the 50, 100, and 200-period exponential moving averages. Reduce clutter by combining them into one indicator!

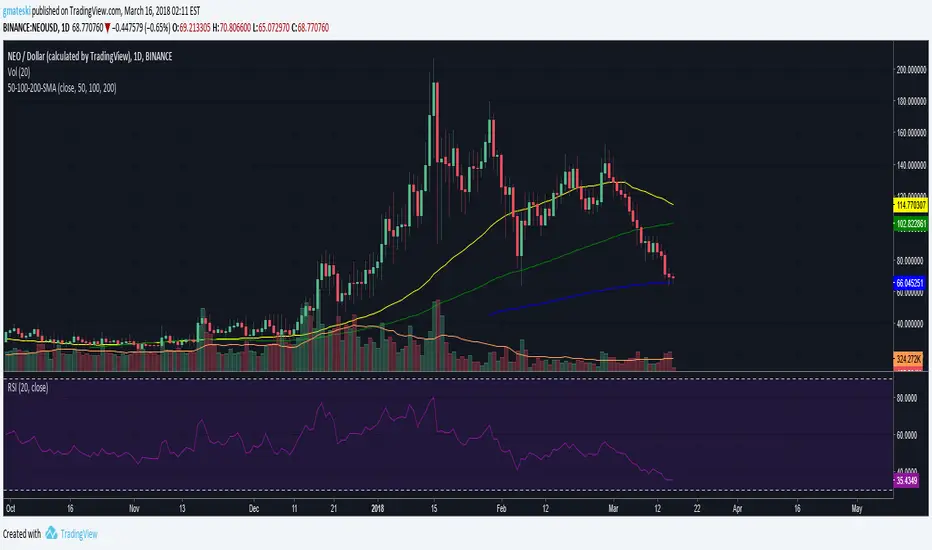
50, 100, 200 SMAsA simple script that displays the 50, 100, and 200-period simple moving averages. Reduce clutter by combining them into one indicator!

50,100,200 MA by CryptoLife71(FIXED)Updated the code by CryptoLife71 so that the 200ma shows correctly.


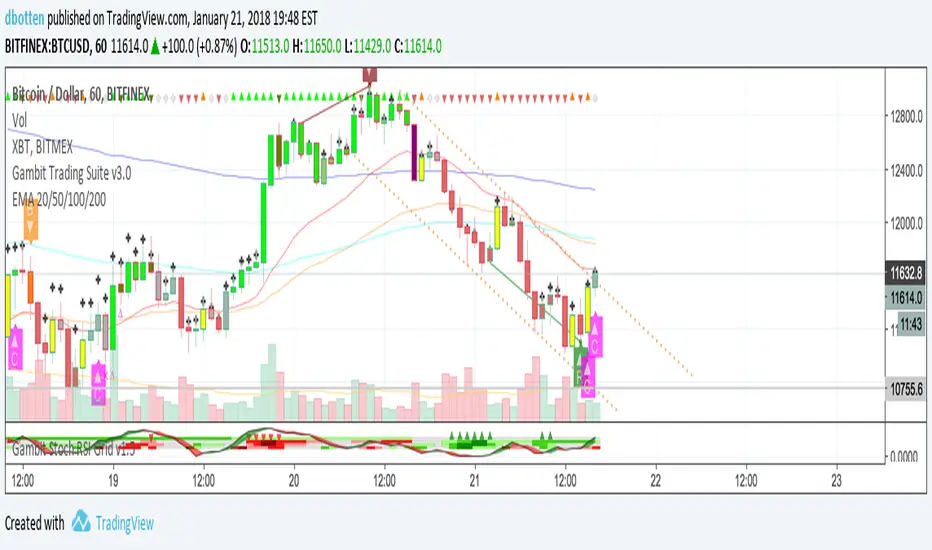
EMA 20/50/100/200Plots exponential moving average on four timeframes at once for rapid indication of momentum shift as well as slower-moving confirmations.
Displays EMA 20, 50, 100, and 200... default colors are hotter for faster timeframes, cooler for slower ones
DECL: 3 X Moving Average (50, 100 and 200 day)Basic Moving Average with 3 different intervals. Default: 50 day (blue), 100 day (red) and 200 day (purple)


BB 100 with Barcolors6/19/15 I added confirmation highlight bars to the code. In other words, if a candle bounced off the lower Bollinger band, it needed one more close above the previous candle to confirm a higher probability that a change in investor sentiment has reversed. Same is true for upper Bollinger band bounces. I also added confirmation highlight bars to the 100 sma (the basis). The idea is that lower and upper bands are potential points of support and resistance. The same is true of the basis if a trend is to continue. 6/28/15 I added a plotshape to identify closes above/below TLine. One thing this system points out is it operates best in a trend reversal. Consolidations will whipsaw the indicator too much. I have found that when this happens, if using daily candles, switch to hourly, 30 min, etc., to catch a better signal. Nothing moves in a straight line. As with any indicator, it is a tool to be used in conjunction with the art AND science of trading. As always, try the indicator for a time so that you are comfortable enough to use real money. This is designed to be used with "BB 25 with Barcolors".

BB 100 with Barcolors6/19/15 I added confirmation highlight bars to the code. In other words, if a candle bounced off the lower Bollinger band, it needed one more close above the previous candle to confirm a higher probability that a change in investor sentiment has reversed. Same is true for upper Bollinger band bounces. I also added confirmation highlight bars to the 100 sma (the basis). The idea is that lower and upper bands are potential points of support and resistance. The same is true of the basis if a trend is to continue. Nothing moves in a straight line. As with any indicator, it is a tool to be used in conjunction with the art AND science of trading. As always, try the indicator for a time so that you are comfortable enough to use real money. This is designed to be used with "BB 25 with Barcolors".
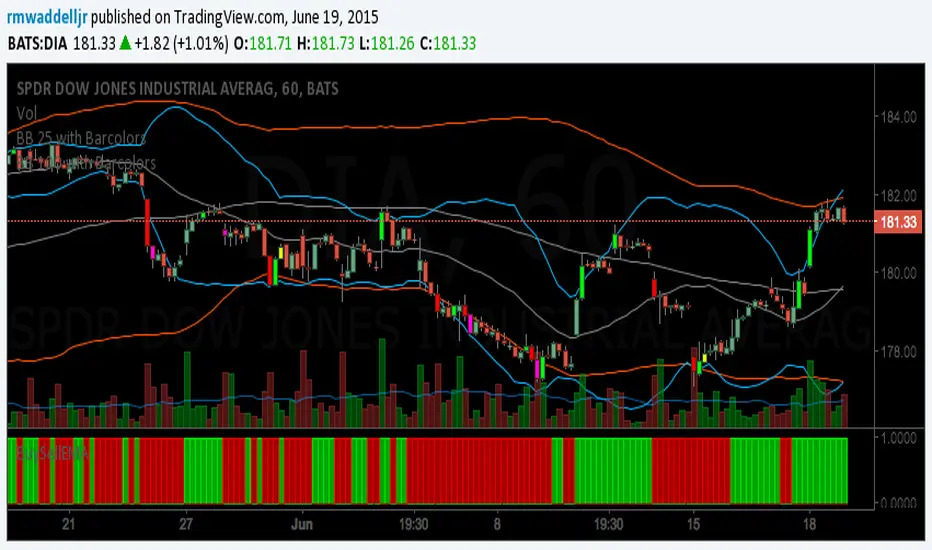
BB 100 with BarcolorsI cleaned up the highlight barcolor to reflect red or lime depending if it closed > or < the open.
The description is in the code. you want to catch bounces off the 25 (upper or lower) and 100 (upper or lower).
Works well on the hourly and 30 min charts. Haven't tested it beyond that. Haven't tested Forex, just equities.

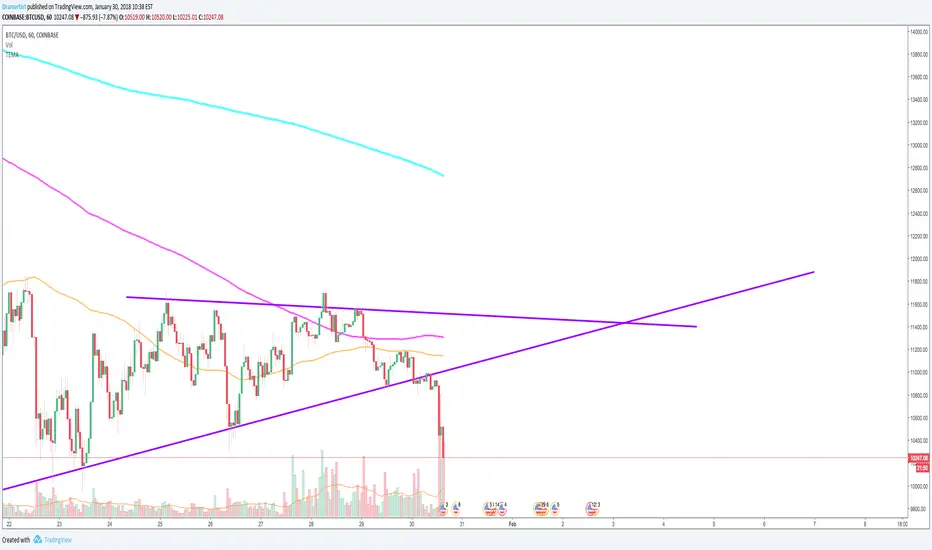
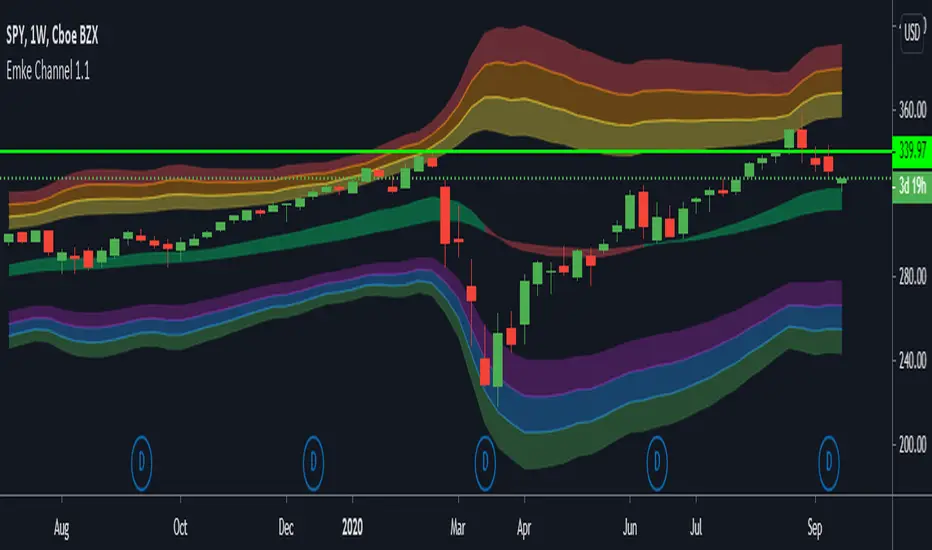
EMA Keltner Channel 1D100/200 EMAs, along with Keltner Bands based off them. Colors correspond to actions you should be ready to take in the area. Use to set macro mindset.
Uses the security function to display only the 1D values.
Red= Bad
Orange = Not as Bad, but still Bad.
Yellow = Warning, might also be Bad.
Purple = Dip a toe in.
Blue = Give it a shot but have a little caution.
Green = It's second mortgage time.
Quantrader📊 Overview
This custom indicator combines intraday session analysis with multi-timeframe trend confirmation to identify high-probability trading opportunities. It features:
Custom intraday session tracking (GMT+7 timezone)
Multi-level moving average confluence (SMA 20, 100, 200)
Bollinger Bands mean reversion signals
Key intraday reference levels
⚙️ Core Components
1. Custom Intraday Session Tracking
Session Start: 7:00 AM GMT+7 (Vietnamese market open)
Calculates per session:
Intraday High/Low (resets at 7:00 AM daily)
Intraday Midline = (Session High + Session Low) / 2
Pre-Day Center = Previous day's midline (carried forward)
Open Day = First 15-minute candle's open price
2. Trend Analysis Framework
SMA 20 (Short-term momentum)
SMA 100 (Medium-term trend)
SMA 200 (Long-term trend direction)
Bollinger Bands (20-period, 2 standard deviations)
3. Signal Detection Logic
Bullish Mean Reversion Setup:
javascript
Condition 1: Green candle closes ABOVE Upper Bollinger Band
Condition 2: Following candle is ALSO green
→ Triggers: Green highlight + Triangle below bar
Bearish Mean Reversion Setup:
javascript
Condition 1: Red candle closes BELOW Lower Bollinger Band
Condition 2: Following candle is ALSO red
→ Triggers: Red highlight + Triangle above bar
🎯 Visual Elements
Element Color Description
Intraday Midline Blue Real-time session midpoint
Pre-Day Center Yellow Yesterday's midline (reference)
Open Day Purple (dashed) Day's opening price
SMA 20 Red Short-term trend
SMA 100 Green Medium-term trend
SMA 200 Orange Long-term trend
Bollinger Bands Red/Green/Blue Volatility boundaries
Bull Signal Green triangle ↓ Oversold bounce potential
Bear Signal Red triangle ↑ Overbought rejection potential
📈 Trading Applications
1. Trend Confirmation
Bullish Alignment: Price > All SMAs + Above Intraday Midline
Bearish Alignment: Price < All SMAs + Below Intraday Midline
2. Mean Reversion Opportunities
Overbought Scenario: Consecutive green candles above Upper BB → Potential reversal
Oversold Scenario: Consecutive red candles below Lower BB → Potential bounce
3. Intraday Level Trading
Intraday Midline: Dynamic support/resistance
Pre-Day Center: Psychological reference level
Open Day: Key opening price level
⚡ Key Features
Automatic Session Reset: Daily at 7:00 AM GMT+7
Multi-Timeframe Confluence: Combines intraday, daily, and trend analysis
Clean Visual Design: Non-cluttered, focused on key levels
Real-Time Calculation: All levels update with each new candle
🛠️ Recommended Settings
Timeframe: 15-minute to 1-hour charts
Markets: Forex, Indices, Commodities
Best Pairs: EURUSD, XAUUSD, VN30, USDJPY
Trading Style: Swing trading, Day trading
📖 Usage Tips
Trend Trading: Enter in direction of SMA alignment (20 > 100 > 200 for bullish)
Mean Reversion: Use BB signals at key intraday levels (Midline, Pre-Day Center)
Confirmation: Wait for candle close above/below key levels
Risk Management: Place stops beyond opposite intraday extreme
🎨 Customization Options
Users can modify:
Session start time (line 6)
Bollinger Band parameters (length, multiplier)
SMA periods
Color schemes
