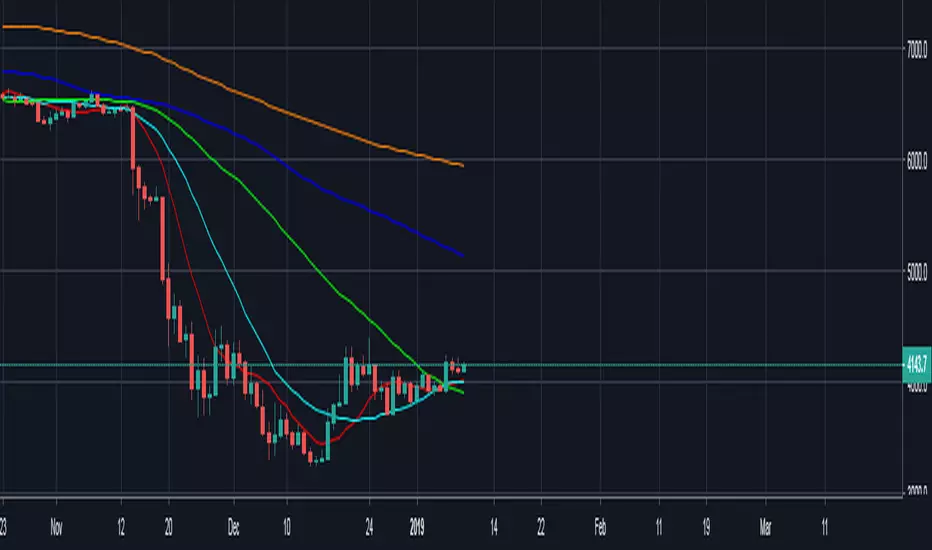
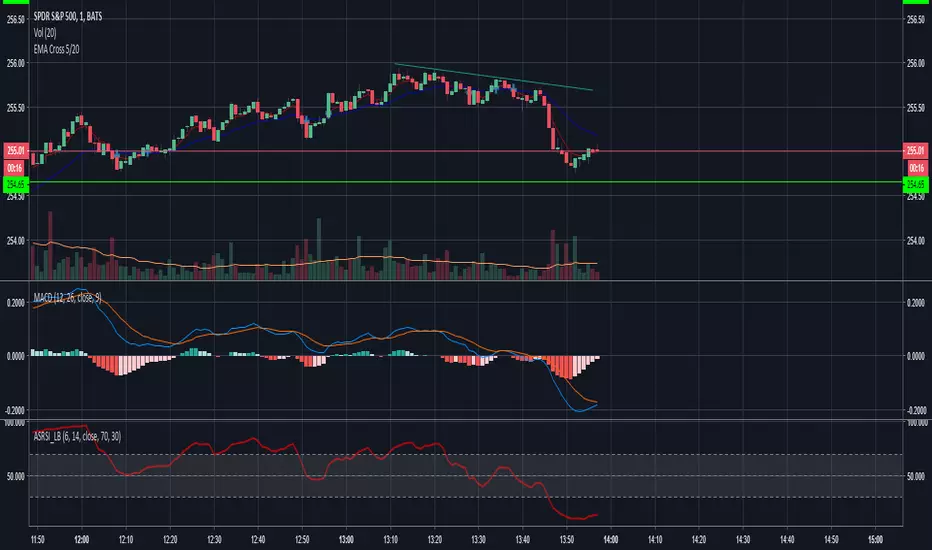
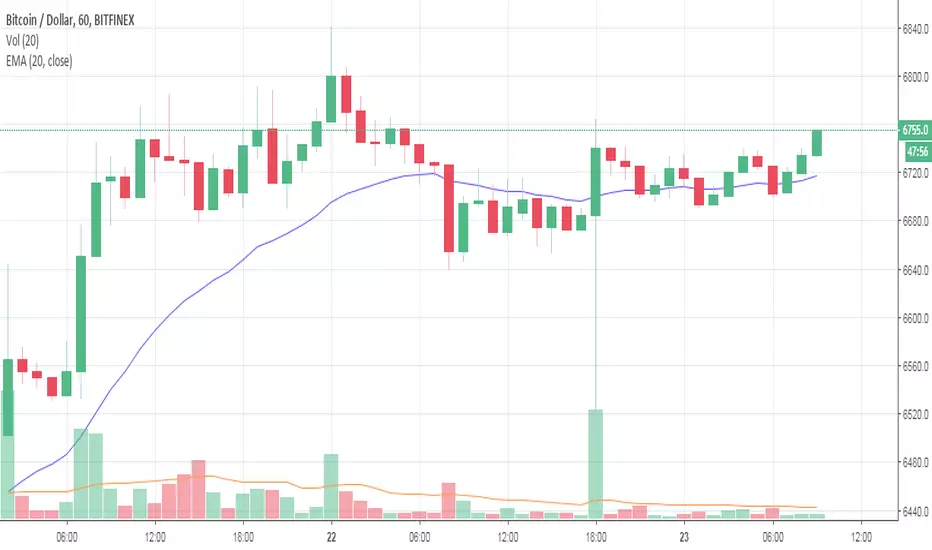
Bitazu MA 10,20Displays 10, 20 MAs on a single indicator.
Useful for Crypto trading and reduced the number of indicators needed to view multiple MAs
When shorter MA crosses over the longer it's a good sign of Bullish/Bearish reversal.
This sentiment is more true at longer timeframes, such as daily candles, as the trend has more momentum.
在脚本中搜索"黄金近20年走势"

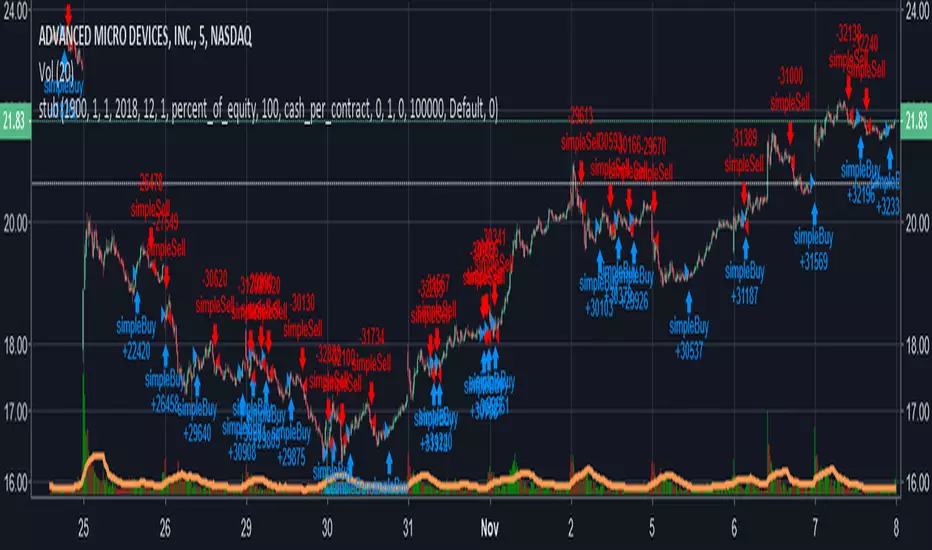
HullMA Strategy--HULL 20 Hisse senedinin hull moving average gibi hızlı bir hareketli ortalamada 20 li paremetrege performansını göstermektedir. Kodu trdingwiewswn alınmıştır.


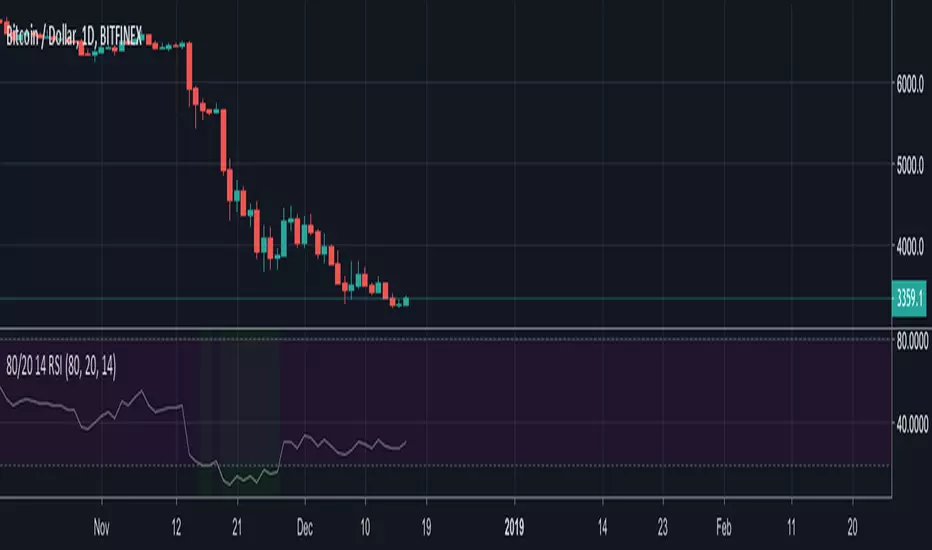
80/20 14 RSIThe default RSI (14) set up with Pareto (80/20 for overbought and oversold).
The background color is turning green and red as buy & sell signals
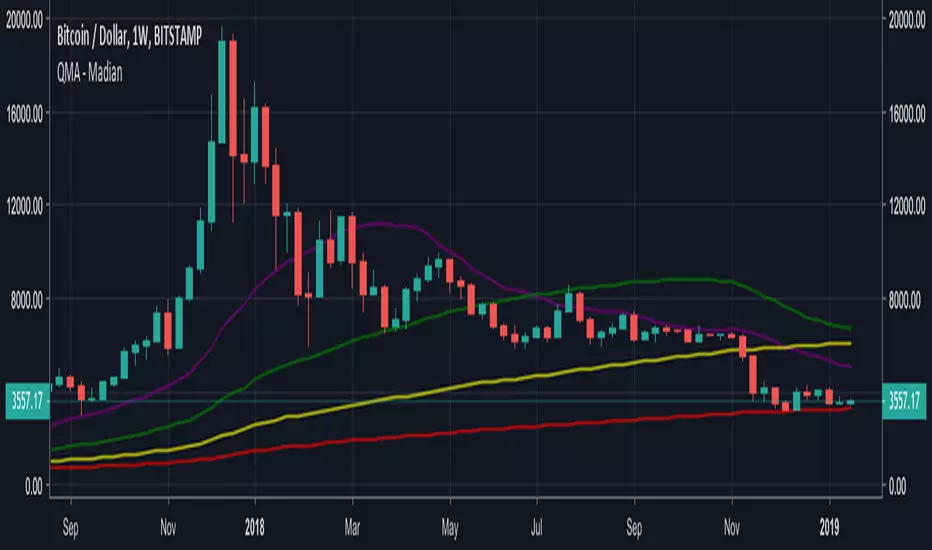
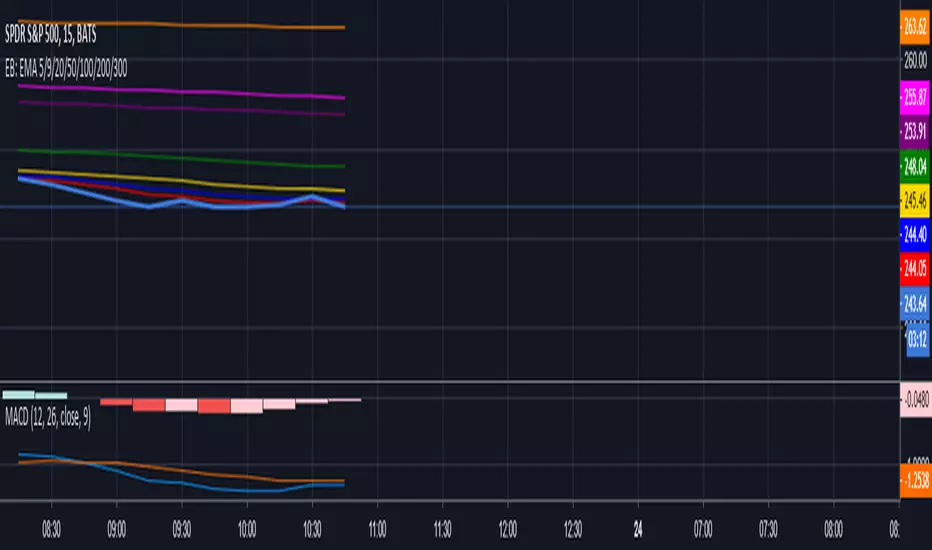
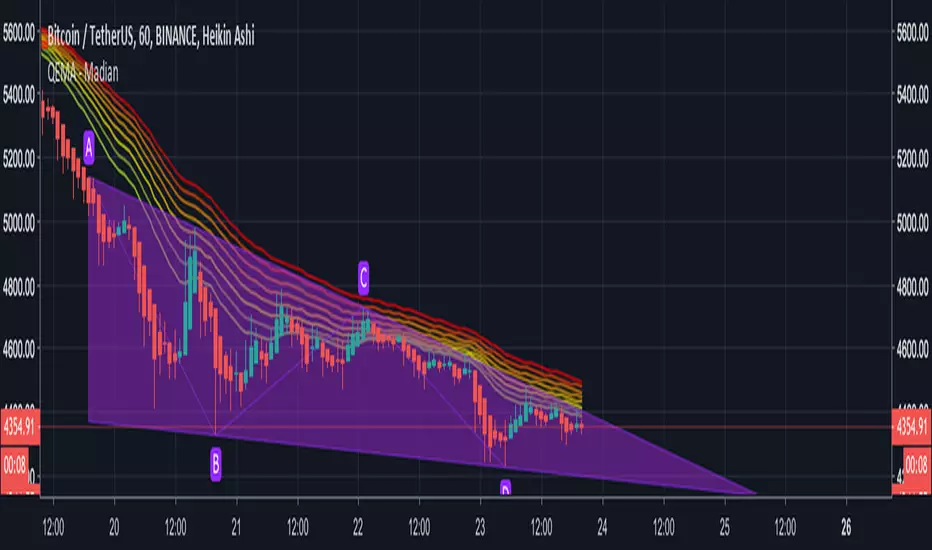
QEMA - 8 Exponential Moving Averages (20 - 55) / MadianQEMA - 8 Exponential Moving Averages (20, 25, 30, 35, 40, 45, 50, 55)
This QEMA act as support and resistance .

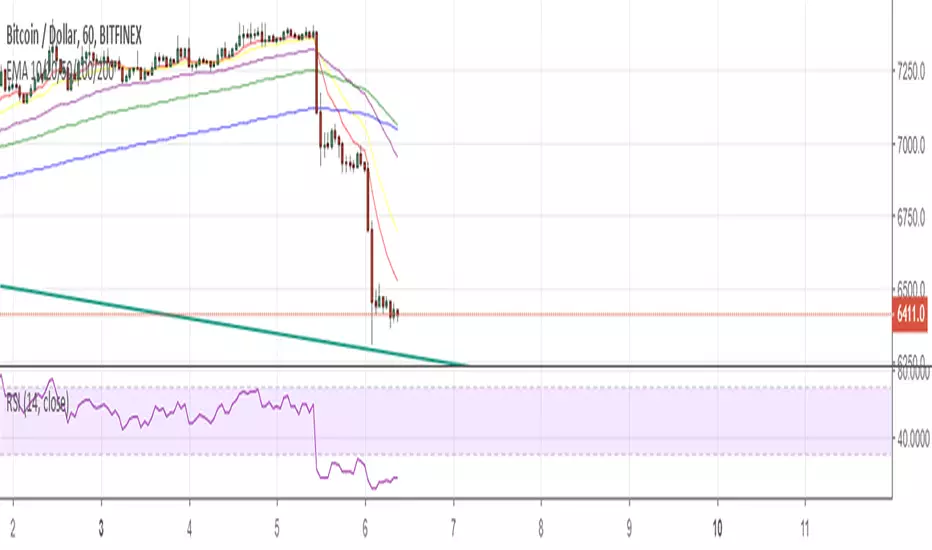
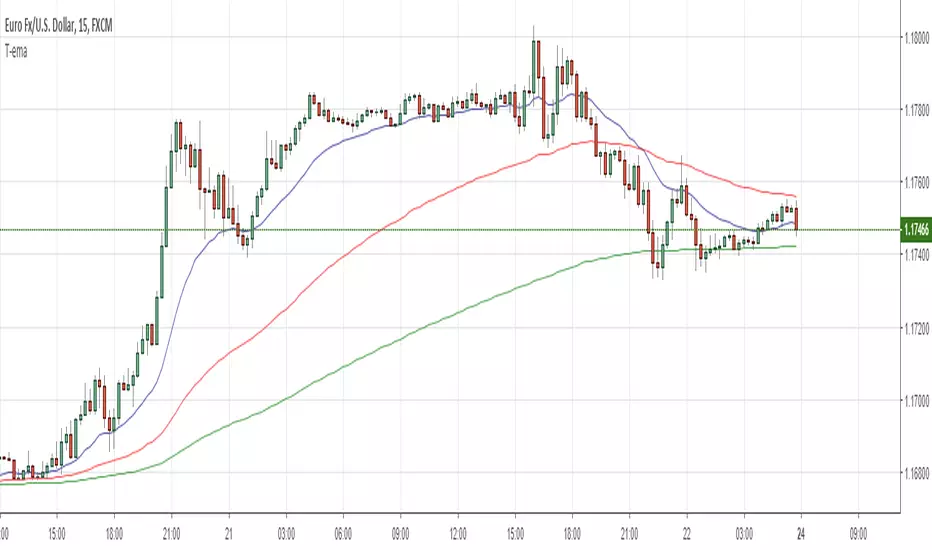
tvial/4MA Daily 20/50/100/200This indicator allows you to:
- display 4 Simple Moving Averages (SMA) at the same time with a single indicator
- display these MA in a DAILY timeframe whatever your current timeframe (4H in the example)
- settings are 20/50/100/200 but can be overridden
Simple but efficient.
Check my other indicators & strategy , they all start with "tvial/".


Multi Timeframe RSI 80 20 Different with 80 - 20 lines to help catch bottoms on multi time frames. The default was 70 - 30. Changed it to be more artistic the current RSI and 1 day are red the rest are white.


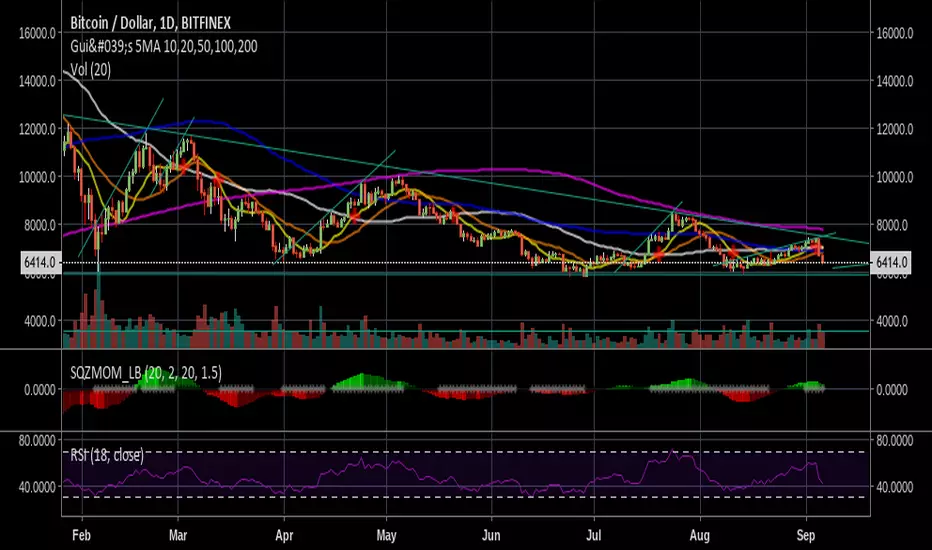
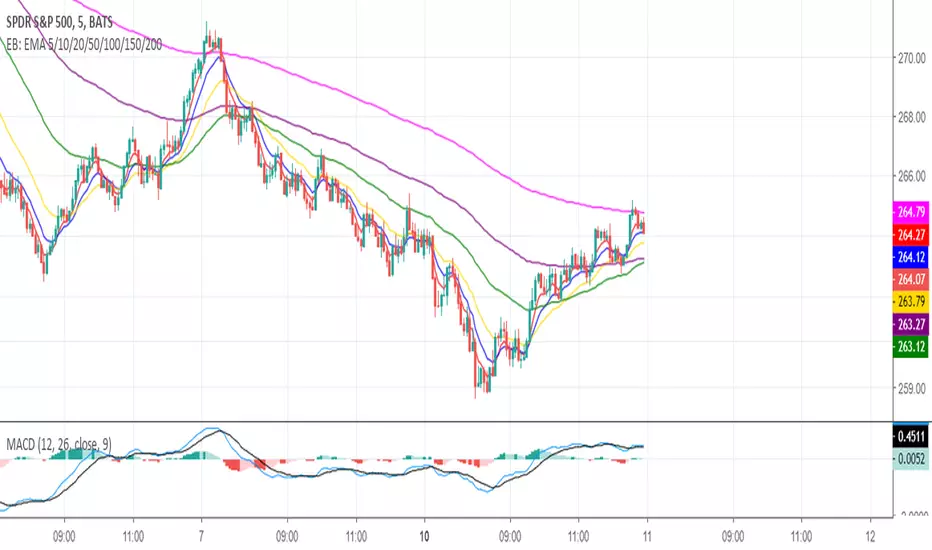
Gui's 5MA 10,20,50,100,2005 Simple Moving Averages for the 10, 20, 50, 100 and 200 day and a cross for whatever you want to read:P
Use it well! Buy high and sell low. Jk:P
Thank you!