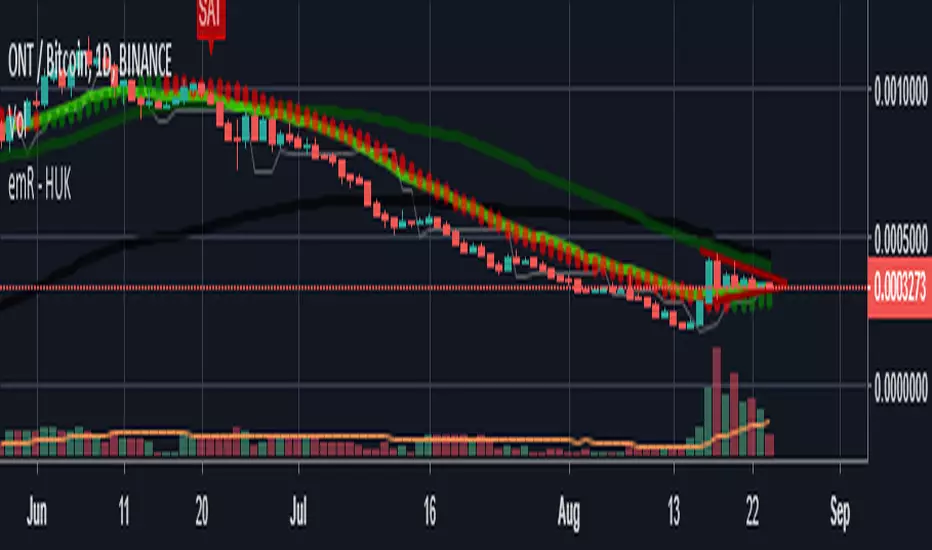
HUK ElasticVolume/50 MOVING AVERAGE e 50/200/20 Coral TrendElastic Volume Default Settings : 50 lenght!
Moving Average Default Settings:50 / 200
EMA Default Settings :20
Coral Trend Default Settings :21/0,4
Thank you ! emR Huk ..
在脚本中搜索"黄金近20年走势"

Anupam's MAs (20,50,200,365)This shows Multiple MAs of 20, 50, 200 and 365 as one common Indicator, thus it can save 4 Different Indicator inputs for Free users.

Multi Indicators v1 - 20 50 200 EMA/SMA, Bollinger Bands, VWAPMulti Indicators v1
20 50 200 EMA/SMA, Bollinger Bands, VWAP
These can be turned on and off
I'll be adding to this multi indicator in future updates

Multiple Ema 20/50/100Multiple Ema 20/50/100 and you can add more EMA Plot easily by changing the codes.

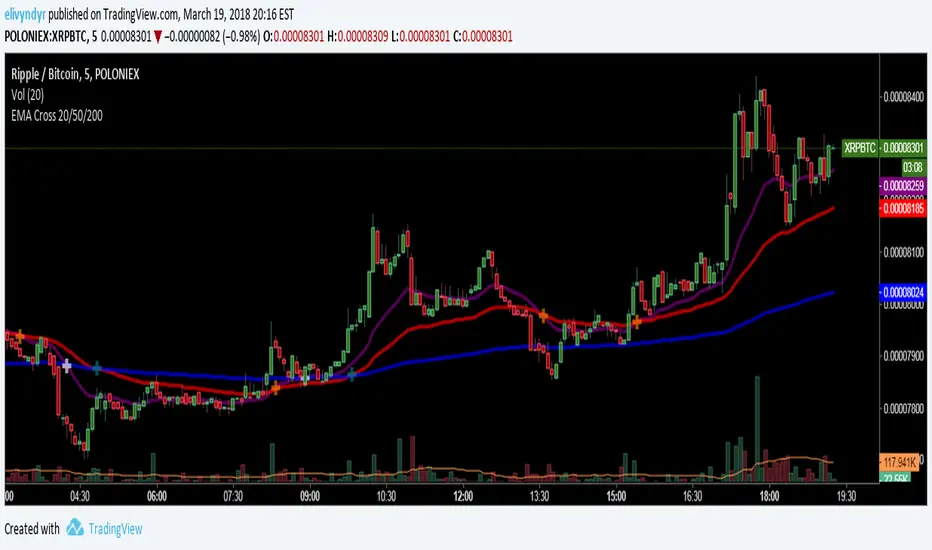
EMA Cross 20/50/200Added a 20 EMA cross to the avaiable 50/200 EMA Cross script in the public library
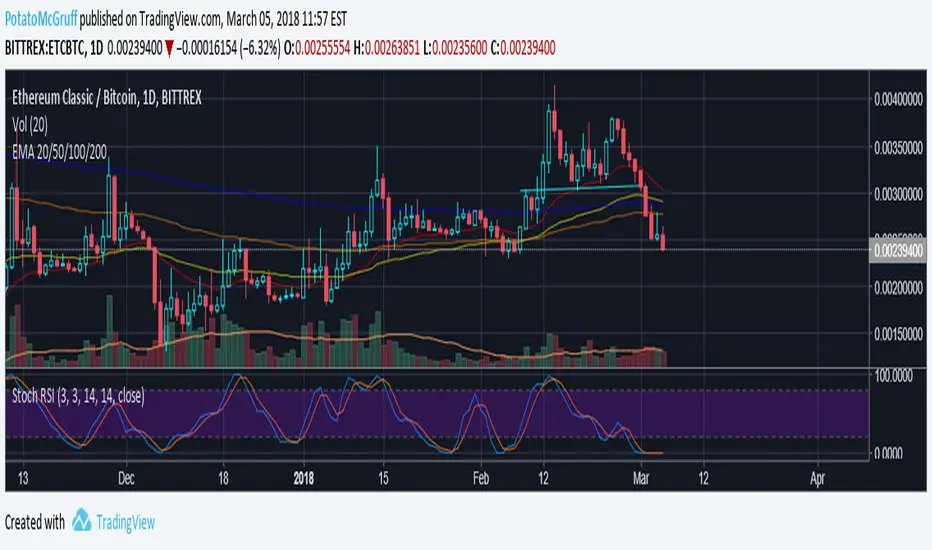
EMA 20/50/100/200Script that publishes the EMA for 20, 50, 100, and 200.
Follow me on Twitter at @PotatoMcGruff

EMA 20/50/100/200Plots exponential moving average on four timeframes at once for rapid indication of momentum shift as well as slower-moving confirmations.
Displays EMA 20, 50, 100, and 200... default colors are hotter for faster timeframes, cooler for slower ones
B3 20/50 MeanSimple MA's 20 and 50 are averaged to produce a mean MA line. I like the smoothness of it, and it can help you stay in a trade in the slow moving trends. Also if you start to see a large cloud in your favor, it could be a great time take the profits.


ShareGenius Swing Trading (SST) 20 days low
20 days high
target to set
special thanks to Shri Mahesh Chander Kaushik and Shri Krishan

MA Crossover20 Ema
200 Day Crossover
Marks Death and Golden Cross
Useful for longterm time frames and finding trends.
Can be used for intraday scalping but advised to be used with price action and other indicators like Williams %R or VWAP.

Bullish & Bearish Reversal Pattern with Sequential Bars20 Bollinger Bands and custom Stochasti_MTM Setup
Both long and short reversal signals.

EMA/SMA + Multi-Timeframe Dashboard (Vertical)20/50 ema and 200 sma
The EMA SMA Trading Indicator combines the power of Exponential Moving Averages (EMA) and Simple Moving Averages (SMA) to help traders identify trends, reversals, and key entry/exit points.
Features:
Dual Moving Averages: Tracks both EMA and SMA to provide a balanced view of short-term and long-term market trends.
Customizable Periods: Allows users to set unique periods for EMA and SMA to suit their trading style and timeframe (e.g., day trading, swing trading, or investing).
Cross Alerts: Highlights EMA and SMA crossover points, which often indicate potential buy or sell signals.
Color-Coded Lines: Visual differentiation between EMA (dynamic and responsive) and SMA (smooth and lagging) for better readability.
Multi-Timeframe Compatibility: Suitable for scalping, intraday trading, and long-term analysis.
Usage:
Trend Confirmation: When the EMA is above the SMA, it signals a bullish trend; when it is below the SMA, it signals a bearish trend.
Crossover Strategy: Use crossovers as potential buy (EMA crosses above SMA) or sell (EMA crosses below SMA) signals.
Dynamic Support/Resistance: EMA can act as short-term support/resistance, while SMA represents long-term levels.
This indicator is perfect for traders who want to combine EMA's speed with SMA's stability for improved decision-making in volatile markets. Customizable alerts and visual cues make it user-friendly for beginners and experienced traders.
Make informed decisions and take your trading to the next level with the EMA SMA Trading Indicator!
