Active PMI Support/Resistance Levels [EdgeTerminal]The PMI Support & Resistance indicator revolutionizes traditional technical analysis by using Pointwise Mutual Information (PMI) - a statistical measure from information theory - to objectively identify support and resistance levels. Unlike conventional methods that rely on visual pattern recognition, this indicator provides mathematically rigorous, quantifiable evidence of price levels where significant market activity occurs.
- The Mathematical Foundation: Pointwise Mutual Information
Pointwise Mutual Information measures how much more likely two events are to occur together compared to if they were statistically independent. In our context:
Event A: Volume spikes occurring (high trading activity)
Event B: Price being at specific levels
The PMI formula calculates: PMI = log(P(A,B) / (P(A) × P(B)))
Where:
P(A,B) = Probability of volume spikes occurring at specific price levels
P(A) = Probability of volume spikes occurring anywhere
P(B) = Probability of price being at specific levels
High PMI scores indicate that volume spikes and certain price levels co-occur much more frequently than random chance would predict, revealing genuine support and resistance zones.
- Why PMI Outperforms Traditional Methods
Subjective interpretation: What one trader sees as significant, another might ignore
Confirmation bias: Tendency to see patterns that confirm existing beliefs
Inconsistent criteria: No standardized definition of "significant" volume or price action
Static analysis: Doesn't adapt to changing market conditions
No strength measurement: Can't quantify how "strong" a level truly is
PMI Advantages:
✅ Objective & Quantifiable: Mathematical proof of significance, not visual guesswork
✅ Statistical Rigor: Levels backed by information theory and probability
✅ Strength Scoring: PMI scores rank levels by statistical significance
✅ Adaptive: Automatically adjusts to different market volatility regimes
✅ Eliminates Bias: Computer-calculated, removing human interpretation errors
✅ Market Structure Aware: Reveals the underlying order flow concentrations
- How It Works
Data Processing Pipeline:
Volume Analysis: Identifies volume spikes using configurable thresholds
Price Binning: Divides price range into discrete levels for analysis
Co-occurrence Calculation: Measures how often volume spikes happen at each price level
PMI Computation: Calculates statistical significance for each price level
Level Filtering: Shows only levels exceeding minimum PMI thresholds
Dynamic Updates: Refreshes levels periodically while maintaining historical traces
Visual System:
Current Levels: Bright, thick lines with PMI scores - your actionable levels
Historical Traces: Faded previous levels showing market structure evolution
Strength Tiers: Line styles indicate PMI strength (solid/dashed/dotted)
Color Coding: Green for support, red for resistance
Info Table: Real-time display of strongest levels with scores
- Indicator Settings:
Core Parameters
Lookback Period (Default: 200)
Lower (50-100): More responsive to recent price action, catches short-term levels
Higher (300-500): Focuses on major historical levels, more stable but less responsive
Best for: Day trading (100-150), Swing trading (200-300), Position trading (400-500)
Volume Spike Threshold (Default: 1.5)
Lower (1.2-1.4): More sensitive, catches smaller volume increases, more levels detected
Higher (2.0-3.0): Only major volume surges count, fewer but stronger signals
Market dependent: High-volume stocks may need higher thresholds (2.0+), low-volume stocks lower (1.2-1.3)
Price Bins (Default: 50)
Lower (20-30): Broader price zones, less precise but captures wider areas
Higher (70-100): More granular levels, precise but may be overly specific
Volatility dependent: High volatility assets benefit from more bins (70+)
Minimum PMI Score (Default: 0.5)
Lower (0.2-0.4): Shows more levels including weaker ones, comprehensive view
Higher (1.0-2.0): Only statistically strong levels, cleaner chart
Progressive filtering: Start with 0.5, increase if too cluttered
Max Levels to Show (Default: 8)
Fewer (3-5): Clean chart focusing on strongest levels only
More (10-15): Comprehensive view but may clutter chart
Strategy dependent: Scalpers prefer fewer (3-5), swing traders more (8-12)
Historical Tracking Settings
Update Frequency (Default: 20 bars)
Lower (5-10): More frequent updates, captures rapid market changes
Higher (50-100): Less frequent updates, focuses on major structural shifts
Timeframe scaling: 1-minute charts need lower frequency (5-10), daily charts higher (50+)
Show Historical Levels (Default: True)
Enables the "breadcrumb trail" effect showing evolution of support/resistance
Disable for cleaner charts focusing only on current levels
Max Historical Marks (Default: 50)
Lower (20-30): Less memory usage, shorter history
Higher (100-200): Longer historical context but more resource intensive
Fade Strength (Default: 0.8)
Lower (0.5-0.6): Historical levels more visible
Higher (0.9-0.95): Historical levels very subtle
Visual Settings
Support/Resistance Colors: Choose colors that contrast well with your chart theme Line Width: Thicker lines (3-4) for better visibility on busy charts Show PMI Scores: Toggle labels showing statistical strength Label Size: Adjust based on screen resolution and chart zoom level
- Most Effective Usage Strategies
For Day Trading:
Setup: Lookback 100-150, Volume Threshold 1.8-2.2, Update Frequency 10-15
Use PMI levels as bounce/rejection points for scalp entries
Higher PMI scores (>1.5) offer better probability setups
Watch for volume spike confirmations at levels
For Swing Trading:
Setup: Lookback 200-300, Volume Threshold 1.5-2.0, Update Frequency 20-30
Enter on pullbacks to high PMI support levels
Target next resistance level with PMI score >1.0
Hold through minor levels, exit at major PMI levels
For Position Trading:
Setup: Lookback 400-500, Volume Threshold 2.0+, Update Frequency 50+
Focus on PMI scores >2.0 for major structural levels
Use for portfolio entry/exit decisions
Combine with fundamental analysis for timing
- Trading Applications:
Entry Strategies:
PMI Bounce Trades
Price approaches high PMI support level (>1.0)
Wait for volume spike confirmation (orange triangles)
Enter long on bullish price action at the level
Stop loss just below the PMI level
Target: Next PMI resistance level
PMI Breakout Trades
Price consolidates near high PMI level
Volume increases (watch for orange triangles)
Enter on decisive break with volume
Previous resistance becomes new support
Target: Next major PMI level
PMI Rejection Trades
Price approaches PMI resistance with momentum
Watch for rejection signals and volume spikes
Enter short on failure to break through
Stop above the PMI level
Target: Next PMI support level
Risk Management:
Stop Loss Placement
Place stops 0.1-0.5% beyond PMI levels (adjust for volatility)
Higher PMI scores warrant tighter stops
Use ATR-based stops for volatile assets
Position Sizing
Larger positions at PMI levels >2.0 (highest conviction)
Smaller positions at PMI levels 0.5-1.0 (lower conviction)
Scale out at multiple PMI targets
- Key Warning Signs & What to Watch For
Red Flags:
🚨 Very Low PMI Scores (<0.3): Weak statistical significance, avoid trading
🚨 No Volume Confirmation: PMI level without recent volume spikes may be stale
🚨 Overcrowded Levels: Too many levels close together suggests poor parameter tuning
🚨 Outdated Levels: Historical traces are reference only, not tradeable
Optimization Tips:
✅ Regular Recalibration: Adjust parameters monthly based on market regime changes
✅ Volume Context: Always check for recent volume activity at PMI levels
✅ Multiple Timeframes: Confirm PMI levels across different timeframes
✅ Market Conditions: Higher thresholds during high volatility periods
Interpreting PMI Scores
PMI Score Ranges:
0.5-1.0: Moderate statistical significance, proceed with caution
1.0-1.5: Good significance, reliable for most trading strategies
1.5-2.0: Strong significance, high-confidence trade setups
2.0+: Very strong significance, institutional-grade levels
Historical Context: The historical trace system shows how support and resistance evolve over time. When current levels align with multiple historical traces, it indicates persistent market memory at those prices, significantly increasing the level's reliability.
在脚本中搜索"200元+股票大盘"

SMA Crossing Background Color (Multi-Timeframe)When day trading or scalping on lower timeframes, it’s often difficult to determine whether the broader market trend is moving upward or downward. To address this, I usually check higher timeframes. However, splitting the layout makes the charts too small and hard to read.
To solve this issue, I created an indicator that uses the background color to show whether the current price is above or below a moving average from a higher timeframe.
For example, if you set the SMA Length to 200 and the MT Timeframe to 5 minutes, the indicator will display a red background on the 1-minute chart when the price drops below the 200 SMA on the 5-minute chart. This helps you quickly recognize that the trend on the higher timeframe has turned bearish—without having to open a separate chart.
デイトレード、スキャルピングで短いタイムフレームでトレードをするときに、大きな動きは上に向いているのか下に向いているのかトレンドがわからなくなることがあります。
その時に上位足を確認するのですが、レイアウトをスプリットすると画面が小さくて見えにくくなるので、バックグラウンドの色で上位足の移動平均線では価格が上なのか下なのかを表示させるインジケーターを作りました。
例えば、SMA Length で200を選び、MT Timeframeで5分を選べば、1分足タイムフレームでトレードしていて雲行きが怪しくなってくるとBGが赤になり、5分足では200線以下に突入しているようだと把握することができます。

Multi-Timeframe EMA Alignment + Listing InfoEnhanced EMA Alignment Checks
Original 4-EMA rows: Check 10EMA ≥ 20EMA ≥ 50EMA ≥ 200EMA for all timeframes
New 3-EMA rows: Check 10EMA ≥ 20EMA ≥ 50EMA (without 200EMA requirement) for weekly and monthly timeframes
Visual Distinction
White background: 4-EMA alignment rows (standard check)
Yellow background: 3-EMA alignment rows (less restrictive check)
Asterisk notation: "1W*" and "1M*" indicate the 3-EMA version
Complete Table Layout
1H: 4-EMA alignment (10≥20≥50≥200)
1D: 4-EMA alignment (10≥20≥50≥200)
1W: 4-EMA alignment (10≥20≥50≥200)
1M: 4-EMA alignment (10≥20≥50≥200)
1W* : 3-EMA alignment (10≥20≥50) - NEW
1M* : 3-EMA alignment (10≥20≥50) - NEW
Separator line
Since List: Weeks/months since listing
Benefits of This Setup:
Comprehensive Analysis: You can now see both strict (4-EMA) and relaxed (3-EMA) trend conditions
Better Entry Signals: The 3-EMA alignment might trigger earlier than 4-EMA, providing potential early entry signals
Trend Strength Assessment: When both 3-EMA and 4-EMA are aligned, it indicates very strong trend conditions
Flexible Strategy: You can use 3-EMA for trend following and 4-EMA for confirmation
The table now provides a complete multi-timeframe trend analysis with both conservative and aggressive alignment criteria, giving you more flexibility in your trading decisions.

[blackcat] L1 Multi-Component CCIOVERVIEW
The " L1 Multi-Component CCI" is a sophisticated technical indicator designed to analyze market trends and momentum using multiple components of the Commodity Channel Index (CCI). This script calculates and combines various CCI-related metrics to provide a comprehensive view of price action, offering traders deeper insights into market dynamics. By integrating smoothed deviations, normalized ranges, and standard CCI values, this tool aims to enhance decision-making processes. It is particularly useful for identifying potential reversal points and confirming trend strength. 📈
FEATURES
Multi-Component CCI Calculation: Combines smoothed deviation, normalized range, percent above low, and standard CCI for a holistic analysis, providing a multifaceted view of market conditions.
Threshold Lines: Overbought (200), oversold (-200), bullish (100), and bearish (-100) thresholds are plotted for easy reference, helping traders quickly identify extreme market conditions.
Visual Indicators: Each component is plotted with distinct colors and line styles for clear differentiation, making it easier to interpret the data at a glance.
Customizable Alerts: The script includes commented-out buy and sell signal logic that can be enabled for automated trading notifications, allowing traders to set up alerts based on specific conditions. 🚀
Advanced Calculations: Utilizes a combination of simple moving averages (SMA) and exponential moving averages (EMA) to smooth out price data, enhancing the reliability of the indicator.
HOW TO USE
Apply the Script: Add the script to your chart on TradingView by searching for " L1 Multi-Component CCI" in the indicators section.
Observe the Plotted Lines: Pay close attention to the smoothed deviation, normalized range, percent above low, and standard CCI lines to identify potential overbought or oversold conditions.
Use Threshold Levels: Refer to the overbought, oversold, bullish, and bearish threshold lines to gauge extreme market conditions and potential reversal points.
Confirm Trends: Use the standard CCI line to confirm trend direction and momentum shifts, providing additional confirmation for your trading decisions.
Enable Alerts: If desired, uncomment the buy and sell signal logic to receive automated alerts when specific conditions are met, helping you stay informed even when not actively monitoring the chart. ⚠️
LIMITATIONS
Fixed Threshold Levels: The script uses fixed threshold levels (200, -200, 100, -100), which may need adjustment based on specific market conditions or asset volatility.
No Default Signals: The buy and sell signal logic is currently commented out, requiring manual activation if you wish to use automated alerts.
Complexity: The multi-component approach, while powerful, may be complex for novice traders to interpret, requiring a solid understanding of technical analysis concepts. 📉
Not for Isolation Use: This indicator is not designed for use in isolation; it is recommended to combine it with other tools and indicators for confirmation and a more robust analysis.
NOTES
Smoothing Techniques: The script uses a combination of simple moving averages (SMA) and exponential moving averages (EMA) for smoothing calculations, which helps in reducing noise and enhancing signal clarity.
Multi-Component Approach: The multi-component approach aims to provide a more nuanced view of market conditions compared to traditional CCI, offering a more comprehensive analysis.
Customization Potential: Traders can customize the script further by adjusting the parameters of the moving averages and other components to better suit their trading style and preferences. ✨
THANKS
Thanks to the TradingView community for their support and feedback on this script! Special thanks to those who contributed ideas and improvements, making this tool more robust and user-friendly. 🙏

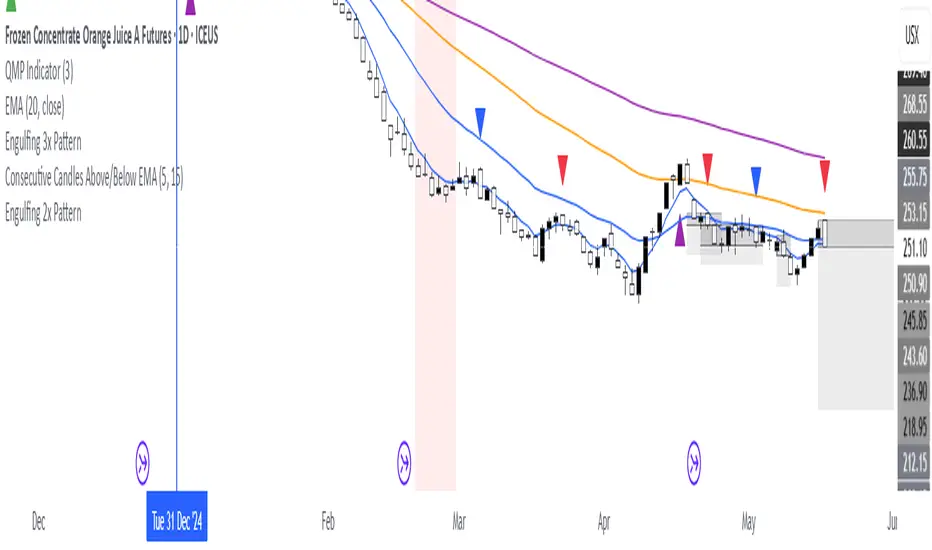
Consecutive Candles Above/Below EMADescription:
This indicator identifies and highlights periods where the price remains consistently above or below an Exponential Moving Average (EMA) for a user-defined number of consecutive candles. It visually marks these sustained trends with background colors and labels, helping traders spot strong bullish or bearish market conditions. Ideal for trend-following strategies or identifying potential trend exhaustion points, this tool provides clear visual cues for price behavior relative to the EMA.
How It Works:
EMA Calculation: The indicator calculates an EMA based on the user-specified period (default: 100). The EMA is plotted as a blue line on the chart for reference.
Consecutive Candle Tracking: It counts how many consecutive candles close above or below the EMA:
If a candle closes below the EMA, the "below" counter increments; any candle closing above resets it to zero.
If a candle closes above the EMA, the "above" counter increments; any candle closing below resets it to zero.
Highlighting Trends: When the number of consecutive candles above or below the EMA meets or exceeds the user-defined threshold (default: 200 candles):
A translucent red background highlights periods where the price has been below the EMA.
A translucent green background highlights periods where the price has been above the EMA.
Labeling: When the required number of consecutive candles is first reached:
A red downward arrow label with the text "↓ Below" appears for below-EMA streaks.
A green upward arrow label with the text "↑ Above" appears for above-EMA streaks.
Usage:
Trend Confirmation: Use the highlights and labels to confirm strong trends. For example, 200 candles above the EMA may indicate a robust uptrend.
Reversal Signals: Prolonged streaks (e.g., 200+ candles) might suggest overextension, potentially signaling reversals.
Customization: Adjust the EMA period to make it faster or slower, and modify the candle count to make the indicator more or less sensitive to trends.
Settings:
EMA Length: Set the period for the EMA calculation (default: 100).
Candles Count: Define the minimum number of consecutive candles required to trigger highlights and labels (default: 200).
Visuals:
Blue EMA line for tracking the moving average.
Red background for sustained below-EMA periods.
Green background for sustained above-EMA periods.
Labeled arrows to mark when the streak threshold is met.
This indicator is a powerful tool for traders looking to visualize and capitalize on persistent price trends relative to the EMA, with clear, customizable signals for market analysis.
Explain EMA calculation
Other trend indicators
Make description shorter
IBD Style Candles [tradeviZion]IBD Style Candles - Visualize Price Bars Like the Pros
Transform your chart with institutional-grade IBD-style bars and customizable moving averages for both daily and weekly timeframes. This indicator helps you visualize price action the way professionals at Investors Business Daily do.
What This Indicator Offers:
IBD-style bar visualization (clean, professional appearance)
Customizable coloring based on price movement or previous close
Automatic timeframe detection for appropriate moving averages
Four customizable moving averages for daily timeframes (10, 21, 50, 200)
Four customizable moving averages for weekly timeframes (10, 20, 30, 40)
Options to use SMAs or EMAs with adjustable colors and line widths
"The IBD-style bars provide a cleaner view of price action, allowing you to focus on market structure without the visual noise of traditional candles."
How to Apply the IBD-Style Bars:
On your TradingView chart, select "Bars" as the chart type from the main chart type selection menu (next to the time interval options).
Right-click on the chart and select "Settings".
Go to the "Symbol" tab.
Uncheck the "Thin Bars" option to display thicker bars.
Set the "Up Color" and "Down Color" opacity to 0 for a clean IBD-style appearance.
Enable "IBD-style Candles" from the script's settings.
To revert to the original chart style, repeat the above steps and restore the default settings.
Moving Average Configuration:
The indicator automatically detects your timeframe and displays the appropriate moving averages:
Daily Timeframe Moving Averages:
10-day moving average (SMA/EMA)
21-day moving average (SMA/EMA)
50-day moving average (SMA/EMA)
200-day moving average (SMA/EMA)
Weekly Timeframe Moving Averages:
10-week moving average (SMA/EMA)
20-week moving average (SMA/EMA)
30-week moving average (SMA/EMA)
40-week moving average (SMA/EMA)
Usage Tips:
Enable "Color bars based on previous close" to identify momentum shifts based on prior candle closes
Customize colors to match your chart theme or preference
Enable only the moving averages relevant to your trading strategy
For cleaner charts, reduce the number of visible moving averages
For stock trading, the 10/21/50/200 daily and 10/40 weekly MAs are most commonly used by institutions
// Example configuration for different timeframes
if timeframe.isweekly
// Weekly configuration
showSMA1_Weekly = true // 10-week MA
showSMA4_Weekly = true // 40-week MA
else
// Daily configuration
showMA2_Daily = true // 21-day MA
showMA3_Daily = true // 50-day MA
showMA4_Daily = true // 200-day MA
While the IBD style provides clarity, remember that no visualization method guarantees trading success. Always combine with proper analysis and risk management.
If you found this indicator helpful, please consider leaving a comment or suggestion for future improvements. Happy trading!

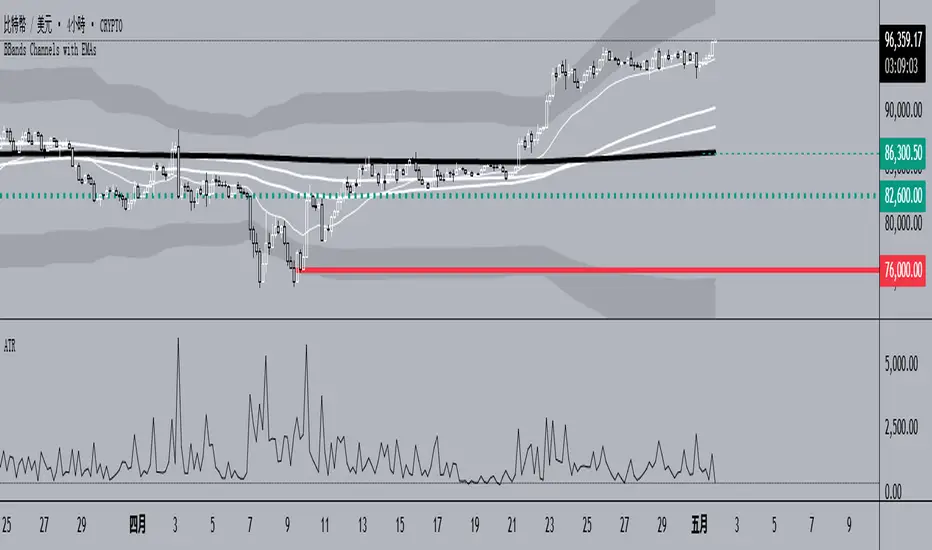
BBands Channels with EMAs# **BBands Channels with EMAs Indicator Explanation**
---
## **📌 Feature Overview**
### **1. Bollinger Bands**
- **Basis Line**: 160-period SMA (adjustable)
- **Inner Bands**:
- **Upper**: Basis + 2× Standard Deviation
- **Lower**: Basis - 2× Standard Deviation
- **Outer Bands**:
- **Upper Top**: Basis + 3× Standard Deviation
- **Lower Low**: Basis - 3× Standard Deviation
- **Fill Effect**: Semi-transparent black fill between inner and outer bands
### **2. Exponential Moving Averages (EMAs)**
| Period | Purpose | Line Style |
|--------------|-----------------------------|------------------|
| **EMA 27** | Short-term trend | Thin line |
| **EMA 120** | Short-to-medium-term trend | Medium line |
| **EMA 200** | Medium-term trend | Medium line |
| **EMA 1120** | Ultra-long-term trend | Thick line |
---
## **⚙️ Parameter Settings**
### **Bollinger Bands**
| Parameter | Default | Description |
|---------------|---------|--------------------------------------|
| `length` | 160 | SMA calculation period |
| `mult` | 2.0 | Standard deviation multiplier (inner bands) |
| `multOuter` | 3.0 | Standard deviation multiplier (outer bands) |
| `offset` | 0 | Time offset for plots (±500 bars) |
### **Exponential Moving Averages (EMAs)**
| Parameter | Default | Description |
|-----------------|---------|---------------------------|
| `ema1Length` | 27 | EMA 1 period |
| `ema2Length` | 120 | EMA 2 period |
| `ema3Length` | 200 | EMA 3 period |
| `ema4Length` | 1120 | EMA 4 period |
---
## **📊 Use Cases**
### **1. Trend Confirmation**
- **Bullish Trend**: Price above EMA200 + Bollinger Band expansion
- **Bearish Trend**: Price below EMA200 + Bollinger Band expansion
### **2. Overbought/Oversold Signals**
- **Upper Band Touch**: Price reaches Upper Top → Potential overbought
- **Lower Band Touch**: Price reaches Lower Low → Potential oversold
### **3. Volatility Strategies**
- **Band Squeeze**: Narrowing gap between bands → Breakout warning
- **Band Expansion**: Price breaks outer band → Trend acceleration
---
**✅ Summary**
This indicator combines **Bollinger Bands + Multi-period EMAs** for:
- Trend tracking
- Volatility analysis
- Multi-timeframe strategies
---
# **BBands Channels with EMAs 指標說明**
---
## **📌 功能概述**
### **1. 布林通道 (Bollinger Bands)**
- **基礎線 (Basis Line)**: 160週期SMA(可調整)
- **內通道 (Inner Bands)**:
- 上軌 (Upper): 基礎線 + 2倍標準差
- 下軌 (Lower): 基礎線 - 2倍標準差
- **外通道 (Outer Bands)**:
- 上外軌 (Upper Top): 基礎線 + 3倍標準差
- 下外軌 (Lower Low): 基礎線 - 3倍標準差
- **填充效果**: 內外通道間半透明黑色填充
### **2. 指數移動平均線 (EMAs)**
| 週期 | 用途 | 線條樣式 |
|-------------|-------------------|-----------------|
| **EMA 27** | 短期趨勢 | 細線 |
| **EMA 120** | 中短期趨勢 | 中等線 |
| **EMA 200** | 中期趨勢 | 中等線 |
| **EMA 1120**| 超長期趨勢 | 粗線 |
---
## **⚙️ 參數設定**
### **布林通道 (Bollinger Bands)**
| 參數名 | 預設值 | 說明 |
|-------------|--------|---------------------------|
| `length` | 160 | SMA計算週期 |
| `mult` | 2.0 | 內通道標準差倍數 |
| `multOuter` | 3.0 | 外通道標準差倍數 |
| `offset` | 0 | 線圖時間偏移(±500根K棒) |
### **指數移動平均線 (EMAs)**
| 參數名 | 預設值 | 說明 |
|----------------|---------|-------------------|
| `ema1Length` | 27 | 第一條EMA週期 |
| `ema2Length` | 120 | 第二條EMA週期 |
| `ema3Length` | 200 | 第三條EMA週期 |
| `ema4Length` | 1120 | 第四條EMA週期 |
---
## **📊 應用場景**
### **1. 趨勢確認**
- **多頭趨勢**: 價格在EMA200上方 + 布林通道擴張
- **空頭趨勢**: 價格在EMA200下方 + 布林通道擴張
### **2. 超買超賣信號**
- **觸及外軌**: 價格觸碰Upper Top → 可能超買
- **觸及下軌**: 價格觸碰Lower Low → 可能超賣
### **3. 波動率策略**
- **通道收窄**: 內外通道間距縮小 → 突破預警
- **通道擴張**: 價格突破外軌 → 趨勢加速
---
**✅ 總結**
本指標透過**布林通道+多週期EMA**的組合,適用於:
- 趨勢跟蹤
- 波動率分析
- 多時間框架策略
ScalpSwing Pro SetupScript Overview
This script is a multi-tool setup designed for both scalping (1m–5m) and swing trading (1H–4H–Daily). It combines the power of trend-following , momentum , and mean-reversion tools:
What’s Included in the Script
1. EMA Indicators (20, 50, 200)
- EMA 20 (blue) : Short-term trend
- EMA 50 (orange) : Medium-term trend
- EMA 200 (red) : Long-term trend
- Use:
- EMA 20 crossing above 50 → bullish trend
- EMA 20 crossing below 50 → bearish trend
- Price above 200 EMA = uptrend bias
2. VWAP (Volume Weighted Average Price)
- Shows the average price weighted by volume
- Best used in intraday (1m to 15m timeframes)
- Use:
- Price bouncing from VWAP = reversion trade
- Price far from VWAP = likely pullback incoming
3. RSI (14) + Key Levels
- Shows momentum and overbought/oversold zones
- Levels:
- 70 = Overbought (potential sell)
- 30 = Oversold (potential buy)
- 50 = Trend confirmation
- Use:
- RSI 30–50 in uptrend = dip buying zone
- RSI 70–50 in downtrend = pullback selling zone
4. MACD Crossovers
- Standard MACD with histogram & cross alerts
- Shows trend momentum shifts
- Green triangle = Bullish MACD crossover
- Red triangle = Bearish MACD crossover
- Use:
- Confirm swing trades with MACD crossover
- Combine with RSI divergence
5. Buy & Sell Signal Logic
BUY SIGNAL triggers when:
- EMA 20 crosses above EMA 50
- RSI is between 50 and 70 (momentum bullish, not overbought)
SELL SIGNAL triggers when:
- EMA 20 crosses below EMA 50
- RSI is between 30 and 50 (bearish momentum, not oversold)
These signals appear as:
- BUY : Green label below the candle
- SELL : Red label above the candle
How to Trade with It
For Scalping (1m–5m) :
- Focus on EMA crosses near VWAP
- Confirm with RSI between 50–70 (buy) or 50–30 (sell)
- Use MACD triangle as added confluence
For Swing (1H–4H–Daily) :
- Look for EMA 20–50 cross + price above EMA 200
- Confirm trend with MACD and RSI
- Trade breakout or pullback depending on structure

Buy/Sell EMA Trend Filter v6Buy/Sell EMA Trend Filter v6
This indicator provides a comprehensive trading system based on EMA crossovers with trend filtering for TradingView. It's designed to identify high-probability buy and sell signals by combining short-term crossovers with longer-term trend direction confirmation.
Key Features:
EMA Crossover System: Uses fast and slow EMAs (9 and 21 by default) to generate initial signals
Trend Filtering: Confirms signals with longer-term trend direction (50 and 200 EMAs)
Automatic TP/SL Calculation: Displays clear take profit and stop loss levels based on fixed risk points
Visual Alerts: Clear buy/sell markers at the point of signal with detailed labels
Risk Management: Pre-calculated risk-to-reward setup (default 1:2 ratio)
How It Works:
Buy Signal: When the fast EMA crosses above the slow EMA while the 50 EMA is above the 200 EMA (bullish trend)
Sell Signal: When the fast EMA crosses below the slow EMA while the 50 EMA is below the 200 EMA (bearish trend)
Customizable Parameters:
Fast EMA period (default: 9)
Slow EMA period (default: 21)
Trend EMA periods (default: 50 and 200)
Fixed risk in points (default: 20)
Reward ratio (default: 2.0)
The indicator displays clear entry points with predefined stop loss and take profit levels, making it ideal for traders looking for a systematic approach to the markets. Perfect for both day trading and swing trading timeframes.
This tool combines both trend following and momentum principles to filter out low-probability trades and focus on high-quality setups where the trend and momentum align.

Multi-Symbol EMA Status Table🔍 Multi-Symbol EMA Trend Scanner Table
This script displays a clean, customizable table showing whether the price of up to 16 different assets is above or below a user-defined EMA, on a per-symbol and per-timeframe basis.
✅ Supports up to 16 symbols, each with:
Custom exchange + ticker (e.g., BINANCE:BTCUSDT.P, PEPPERSTONE:EURUSD)
Custom timeframe (e.g., 15, 60, 240, D, W)
Custom EMA length (e.g., 50, 100, 200)
🧩 Fully customizable visuals:
Table position (top, middle, bottom + left, center, right)
Text size and text color
Background color for "above" and "below" EMA
Optional ✅❌ emojis
📊 The table updates live on your main chart — no switching required!
💡 Great for:
Monitoring trend direction across multiple markets
Spotting trend alignment (e.g., price above 200 EMA on 4H + 1D)
Multi-asset swing trading or scalping strategies
📘 How to Use:
Open a chart and add the indicator from your scripts.
In the settings panel:
Enter any symbol (with exchange prefix, like BINANCE:BTCUSDT.P or OANDA:EURUSD)
Set a timeframe (e.g., "15" for 15min, "60" for 1h, "D" for daily)
Choose your EMA length (e.g., 200)
Repeat for as many symbols as you need (up to 16).
Customize table visuals:
Position on the screen
Font size and color
Enable/disable emojis ✅❌
Watch the table update live!
🧠 Optional Tips:
Use different colors or groupings to track asset classes (crypto, forex, stocks).
Combine it with your favorite entry/exit signals for confirmation.
Try setting all symbols to the same EMA (e.g., 200) but with different timeframes to monitor multi-timeframe alignment.

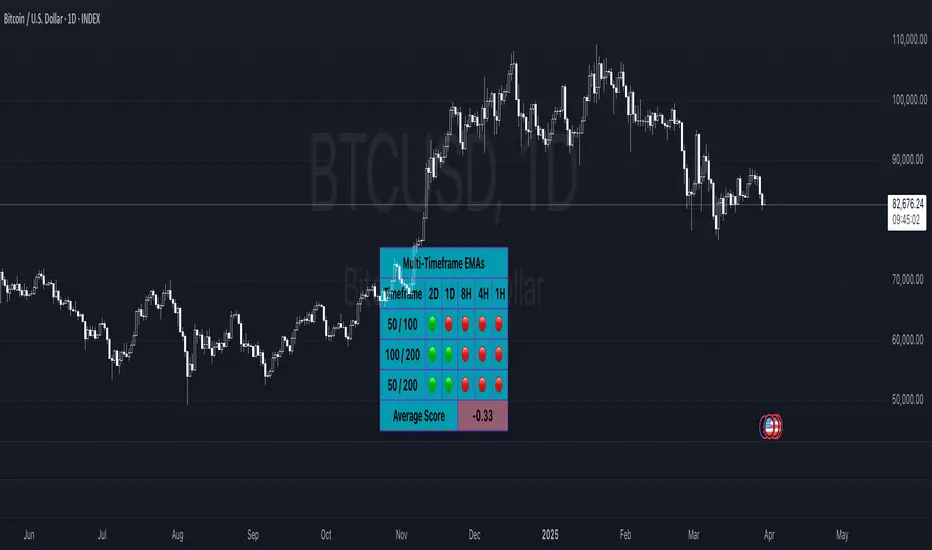
Multi-Timeframe EMAsMulti Timeframe EMA's
The 'Multi-Timeframe EMA Band Comparison' indicator is a tool designed to analyze trend direction across multiple timeframes using Exponential Moving Averages. it calculates the 50, 100, and 200 period EMAs for fiver user defined timeframes and compares their relationships to provide a visual snapshot of bullish or bearish momentum.
How it Works:
EMA Calculations: For each selected timeframe, the indicator computes the 50, 100, and 200 period EMAs based on the closing price.
Band Comparisons: Three key relationships are evaluated:
50 EMA vs 100 EMA
100 EMA vs 200 EMA
50 EMA vs 200 EMA
Scoring System: Each comparison is assigned a score:
🟢 (Green Circle): The shorter EMA is above the longer EMA, signaling bullish momentum.
🔴 (Red Circle): The shorter EMA is below the longer EMA, signaling bearish momentum.
⚪️ (White Circle): The EMAs are equal or data is unavailable (rare).
Average Score:
An overall average score is calculated across all 15 comparisons ranging from 1 to -1, displayed with two decimal places and color coded.
Customization:
This indicator is fully customizable from the timeframe setting to the color of the table. The only specific part that is not changeable is the EMA bands.
Nef33-Volume Footprint ApproximationDescription of the "Volume Footprint Approximation" Indicator
Purpose
The "Volume Footprint Approximation" indicator is a tool designed to assist traders in analyzing market volume dynamics and anticipating potential trend changes in price. It is inspired by the concept of a volume footprint chart, which visualizes the distribution of trading volume across different price levels. However, since TradingView does not provide detailed intrabar data for all users, this indicator approximates the behavior of a footprint chart by using available volume and price data (open, close, volume) to classify volume as buy or sell, calculate volume delta, detect imbalances, and generate trend change signals.
The indicator is particularly useful for identifying areas of high buying or selling activity, imbalances between supply and demand, delta divergences, and potential reversal points in the market. It provides specific signals for bullish and bearish trend changes, making it suitable for traders looking to trade reversals or confirm trends.
How It Works
The indicator uses volume and price data from each candlestick to perform the following calculations:
Volume Classification:
Classifies the volume of each candlestick as "buy" or "sell" based on price movement:
If the closing price is higher than the opening price (close > open), the volume is classified as "buy."
If the closing price is lower than the opening price (close < open), the volume is classified as "sell."
If the closing price equals the opening price (close == open), it compares with the previous close to determine the direction:
If the current close is higher than the previous close, it is classified as "buy."
If the current close is lower than the previous close, it is classified as "sell."
If the current close equals the previous close, the classification from the previous bar is used.
Delta Calculation:
Calculates the volume delta as the difference between buy volume and sell volume (buyVolume - sellVolume).
A positive delta indicates more buy volume; a negative delta indicates more sell volume.
Imbalance Detection:
Identifies imbalances between buy and sell volume:
A buy imbalance occurs when buy volume exceeds sell volume by a defined percentage (default is 300%).
A sell imbalance occurs when sell volume exceeds buy volume by the same percentage.
Delta Divergence Detection:
Positive Delta Divergence: Occurs when the price is falling (for at least 2 bars) but the delta is increasing or becomes positive, indicating that buyers are entering despite the price decline.
Negative Delta Divergence: Occurs when the price is rising (for at least 2 bars) but the delta is decreasing or becomes negative, indicating that sellers are entering despite the price increase.
Trend Change Signals:
Bullish Signal (trendChangeBullish): Generated when the following conditions are met:
There is a positive delta divergence.
The delta has moved from a negative value (e.g., -500) to a positive value (e.g., +200) over the last 3 bars.
There is a buy imbalance.
The price is near a historical support level (approximated as the lowest low of the last 50 bars).
Bearish Signal (trendChangeBearish): Generated when the following conditions are met:
There is a negative delta divergence.
The delta has moved from a positive value (e.g., +500) to a negative value (e.g., -200) over the last 3 bars.
There is a sell imbalance.
The price is near a historical resistance level (approximated as the highest high of the last 50 bars).
Visual Elements
The indicator is displayed in a separate panel below the price chart (overlay=false) and includes the following elements:
Volume Histograms:
Buy Volume: Represented by a green histogram. Shows the volume classified as "buy."
Sell Volume: Represented by a red histogram. Shows the volume classified as "sell."
Note: The histograms overlap, and the last plotted histogram (red) takes visual precedence, meaning the sell volume may cover the buy volume if it is larger.
Delta Line:
Delta Volume: Represented by a blue line. Shows the difference between buy and sell volume.
A line above zero indicates more buy volume; a line below zero indicates more sell volume.
A dashed gray horizontal line marks the zero level for easier interpretation.
Imbalance Backgrounds:
Buy Imbalance: Light green background when buy volume exceeds sell volume by the defined percentage.
Sell Imbalance: Light red background when sell volume exceeds buy volume by the defined percentage.
Divergence Backgrounds:
Positive Delta Divergence: Lime green background when a positive delta divergence is detected.
Negative Delta Divergence: Fuchsia background when a negative delta divergence is detected.
Trend Change Signals:
Bullish Signal: Green label with the text "Bullish Trend Change" when the conditions for a bullish trend change are met.
Bearish Signal: Red label with the text "Bearish Trend Change" when the conditions for a bearish trend change are met.
Information Labels:
Below each bar, a label displays:
Total Vol: The total volume of the bar.
Delta: The delta volume value.
Alerts
The indicator generates the following alerts:
Positive Delta Divergence: "Positive Delta Divergence Detected! Price is falling, but delta is increasing."
Negative Delta Divergence: "Negative Delta Divergence Detected! Price is rising, but delta is decreasing."
Bullish Trend Change Signal: "Bullish Trend Change Signal! Positive Delta Divergence, Delta Rise, Buy Imbalance, and Near Support."
Bearish Trend Change Signal: "Bearish Trend Change Signal! Negative Delta Divergence, Delta Drop, Sell Imbalance, and Near Resistance."
These alerts can be configured in TradingView to receive real-time notifications.
Adjustable Parameters
The indicator allows customization of the following parameters:
Imbalance Threshold (%): The percentage required to detect an imbalance between buy and sell volume (default is 300%).
Lookback Period for Divergence: Number of bars to look back for detecting price and delta trends (default is 2 bars).
Support/Resistance Lookback Period: Number of bars to look back for identifying historical support and resistance levels (default is 50 bars).
Delta High Threshold (Bearish): Minimum delta value 2 bars ago for the bearish signal (default is +500).
Delta Low Threshold (Bearish): Maximum delta value in the current bar for the bearish signal (default is -200).
Delta Low Threshold (Bullish): Maximum delta value 2 bars ago for the bullish signal (default is -500).
Delta High Threshold (Bullish): Minimum delta value in the current bar for the bullish signal (default is +200).
Practical Use
The indicator is useful for the following purposes:
Identifying Trend Changes:
The trend change signals (trendChangeBullish and trendChangeBearish) indicate potential price reversals. For example, a bullish signal near a support level may be an opportunity to enter a long position.
Detecting Divergences:
Delta divergences (positive and negative) can anticipate trend changes by showing a disagreement between price movement and underlying buying/selling pressure.
Finding Key Levels:
Imbalances (green and red backgrounds) often coincide with support and resistance levels, helping to identify areas where the market might react.
Confirming Trends:
A consistently positive delta in an uptrend or a negative delta in a downtrend can confirm the strength of the trend.
Identifying Failed Auctions:
Although not detected automatically, you can manually identify failed auctions by observing a price move to new highs/lows with decreasing volume in the direction of the move.
Limitations
Intrabar Data: It does not use detailed intrabar data, making it less precise than a native footprint chart.
Approximations: Volume classification and support/resistance detection are approximations, which may lead to false signals.
Volume Dependency: It requires reliable volume data, so it may be less effective on assets with inaccurate volume data (e.g., some forex pairs).
False Signals: Divergences and imbalances do not always indicate a trend change, especially in strongly trending markets.
Recommendations
Combine with Other Indicators: Use tools like RSI, MACD, support/resistance levels, or candlestick patterns to confirm signals.
Trade on Higher Timeframes: Signals are more reliable on higher timeframes like 1-hour or 4-hour charts.
Perform Backtesting: Evaluate the indicator's accuracy on historical data to adjust parameters and improve effectiveness.
Adjust Parameters: Modify thresholds (e.g., imbalanceThreshold or supportResistanceLookback) based on the asset and timeframe you are trading.
Conclusion
The "Volume Footprint Approximation" indicator is a powerful tool for analyzing volume dynamics and anticipating price trend changes. By classifying volume, calculating delta, detecting imbalances and divergences, and generating trend change signals, it provides traders with valuable insights into market buying and selling pressure. While it has limitations due to the lack of intrabar data, it can be highly effective when used in combination with other technical analysis tools and on assets with reliable volume data.

ETH/USDT EMA Crossover Strategy - OptimizedStrategy Name: EMA Crossover Strategy for ETH/USDT
Description:
This trading strategy is designed for the ETH/USDT pair and is based on exponential moving average (EMA) crossovers combined with momentum and volatility indicators. The strategy uses multiple filters to identify high-probability signals in both bullish and bearish trends, making it suitable for traders looking to trade in trending markets.
Strategy Components
EMAs (Exponential Moving Averages):
EMA 200: Used to identify the primary trend. If the price is above the EMA 200, it is considered a bullish trend; if below, a bearish trend.
EMA 50: Acts as an additional filter to confirm the trend.
EMA 20 and EMA 50 Short: These short-term EMAs generate entry signals through crossovers. A bullish crossover (EMA 20 crosses above EMA 50 Short) is a buy signal, while a bearish crossover (EMA 20 crosses below EMA 50 Short) is a sell signal.
RSI (Relative Strength Index):
The RSI is used to avoid overbought or oversold conditions. Long trades are only taken when the RSI is above 30, and short trades when the RSI is below 70.
ATR (Average True Range):
The ATR is used as a volatility filter. Trades are only taken when there is sufficient volatility, helping to avoid false signals in quiet markets.
Volume:
A volume filter is used to confirm sufficient market participation in the price movement. Trades are only taken when volume is above average.
Strategy Logic
Long Trades:
The price must be above the EMA 200 (bullish trend).
The EMA 20 must cross above the EMA 50 Short.
The RSI must be above 30.
The ATR must indicate sufficient volatility.
Volume must be above average.
Short Trades:
The price must be below the EMA 200 (bearish trend).
The EMA 20 must cross below the EMA 50 Short.
The RSI must be below 70.
The ATR must indicate sufficient volatility.
Volume must be above average.
How to Use the Strategy
Setup:
Add the script to your ETH/USDT chart on TradingView.
Adjust the parameters according to your preferences (e.g., EMA periods, RSI, ATR, etc.).
Signals:
Buy and sell signals will be displayed directly on the chart.
Long trades are indicated with an upward arrow, and short trades with a downward arrow.
Risk Management:
Use stop-loss and take-profit orders in all trades.
Consider a risk-reward ratio of at least 1:2.
Backtesting:
Test the strategy on historical data to evaluate its performance before using it live.
Advantages of the Strategy
Trend-focused: The strategy is designed to trade in trending markets, increasing the probability of success.
Multiple filters: The use of RSI, ATR, and volume reduces false signals.
Adaptability: It can be adjusted for different timeframes, although it is recommended to test it on 5-minute and 15-minute charts for ETH/USDT.
Warnings
Sideways markets: The strategy may generate false signals in markets without a clear trend. It is recommended to avoid trading in such conditions.
Optimization: Make sure to optimize the parameters according to the market and timeframe you are using.
Risk management: Never trade without stop-loss and take-profit orders.
Author
Jose J. Sanchez Cuevas
Version
v1.0

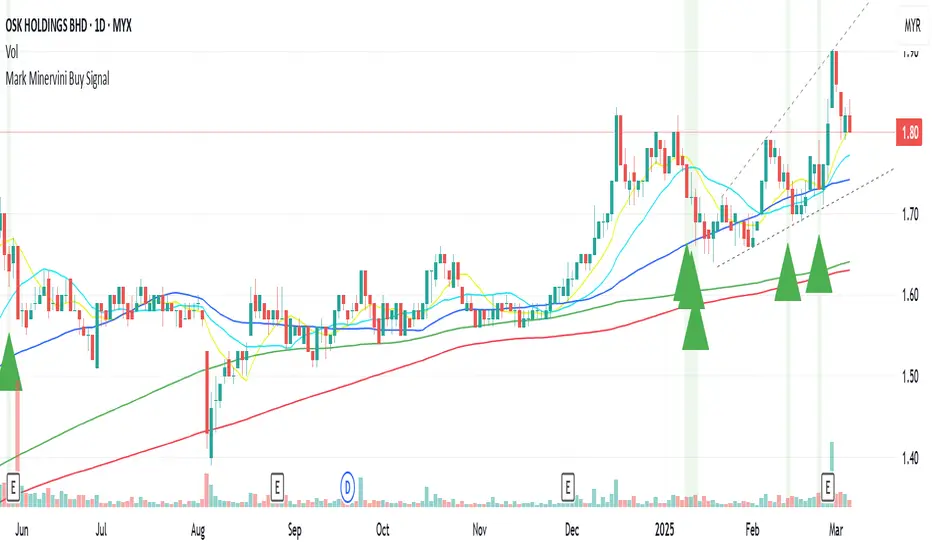
Mark Minervini Buy Signal# Mark Minervini Buy Signal Indicator
This indicator implements Mark Minervini's "Stage 2 Uptrend" buy criteria from his SEPA (Specific Entry Point Analysis) methodology as described in his books "Trade Like a Stock Market Wizard" and "Think & Trade Like a Champion". The script identifies potential buy setups based on Minervini's technical criteria for stocks showing strong momentum characteristics.
## How It Works
The indicator evaluates various technical conditions to identify stocks in a Stage 2 uptrend according to Minervini's methodology:
1. **Moving Average Alignment**
- 150-day MA above 200-day MA (confirming overall uptrend)
- 200-day MA trending up (compared to 20 days ago)
- 50-day MA above both 150-day and 200-day MAs (showing recent strength)
- Price above all major moving averages (50, 150, 200-day MAs)
2. **Price Relative to 52-Week Range**
- Price at least 25% above 52-week low (showing strong recovery)
- Price within 75-95% of 52-week high (room for further upside)
3. **Relative Strength**
- Stock ranks in the top 30% based on 100-day price performance
- This implements Minervini's emphasis on buying only strong performers
4. **Volume Criteria**
- Volume above its 50-day moving average (showing increasing interest)
## How to Use This Indicator
When all conditions are met, the indicator displays a green triangle below the price bar and colors the background green. These signals identify potential candidates for further analysis. According to Minervini's methodology, you should:
1. Use this as a screening tool to identify potential candidates
2. Perform additional chart analysis to identify specific entry points
3. Look for decreased volatility and proper bases or consolidation patterns
4. Consider broader market conditions and sector strength before entering
## Sources and Credit
This indicator is based on Mark Minervini's trading methodology as outlined in:
1. Minervini, Mark. "Trade Like a Stock Market Wizard: How to Achieve Super Performance in Stocks in Any Market" (2013)
2. Minervini, Mark. "Think & Trade Like a Champion: The Secrets, Rules & Blunt Truths of a Stock Market Wizard" (2016)
3. Minervini, Mark. "Mindset Secrets for Winning: How to Bring Personal Power to Everything You Do" (2019)
4. Interviews and workshops where Minervini has described his SEPA methodology
The specific criteria implemented are derived from Minervini's "Stage Analysis" framework, particularly focusing on Stage 2 uptrends which he considers optimal for buying opportunities.
## Disclaimer
This indicator is provided for informational purposes only. It attempts to reproduce Minervini's published criteria but should be used as part of a complete trading strategy with proper risk management. Minervini's complete methodology includes additional subjective elements that cannot be fully automated.
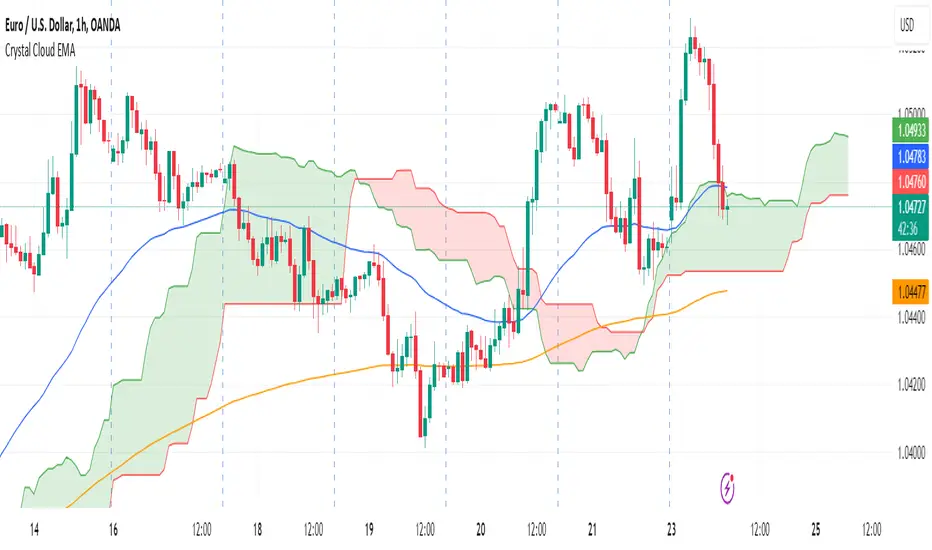
Crystal Cloud EMA# Crystal Cloud EMA Indicator 🚀
The **Crystal Cloud EMA Indicator** is a hybrid technical analysis tool that uniquely merges the multi-dimensional perspective of the Ichimoku Cloud with the precision of EMA crossovers (EMA 50 & EMA 200). This integration is designed to help traders identify key market trends, dynamic support and resistance zones, and potential momentum shifts with enhanced clarity and reliability.
---
## Key Components & Originality
### Ichimoku Cloud
- **Dynamic Support & Resistance:**
Utilizes standard Ichimoku calculations to form a cloud (Kumo) that highlights areas where price may find support or resistance.
- **Visual Clarity:**
The cloud’s upper and lower boundaries provide clear visual cues of market sentiment, helping to identify potential reversal or consolidation zones.
### EMA 50 & EMA 200
- **Trend Confirmation:**
These exponential moving averages smooth price data to reveal underlying trends.
- **Crossover Signals:**
A crossover of EMA 50 and EMA 200 is used as a signal confirmation—when EMA 50 crosses above EMA 200, it suggests a bullish trend; when it crosses below, it indicates a bearish trend.
### Unique Integration
- **Combined Analysis for Enhanced Accuracy:**
By fusing the Ichimoku Cloud’s dynamic support/resistance zones with the precise timing of EMA crossovers, the indicator minimizes false signals.
- **Confluence of Methods:**
Only when both the cloud position and EMA crossover align does the indicator generate a trading signal, offering a more robust framework than using either method in isolation.
---
## How It Works
1. **Cloud Evaluation:**
- The indicator calculates the Ichimoku Cloud using traditional parameters, establishing dynamic zones where price reactions are likely.
- It monitors how price interacts with these zones, signaling potential momentum shifts when the price moves in or out of the cloud.
2. **EMA Crossover Analysis:**
- Simultaneously, it computes EMA 50 and EMA 200.
- **Bullish Condition:** When price is above the cloud and EMA 50 crosses above EMA 200.
- **Bearish Condition:** When price is below the cloud and EMA 50 crosses below EMA 200.
3. **Signal Confirmation:**
- A breakout from the cloud, in conjunction with a crossover, further validates the strength of the trend.
- This dual confirmation approach filters out market noise and increases the reliability of the signals.
---
## Trading Strategy & Usage
### Buy Signal
- **Conditions:**
- Price is trading above the Ichimoku Cloud.
- EMA 50 crosses above EMA 200.
- A confirmed breakout above the cloud supports the bullish trend.
- **Application:**
- Enter long positions when these conditions align.
- Use the cloud’s lower boundary for potential stop-loss placement and set profit targets based on key resistance levels identified by the cloud.
### Sell Signal
- **Conditions:**
- Price is trading below the Ichimoku Cloud.
- EMA 50 crosses below EMA 200.
- A breakdown below the cloud reinforces the bearish trend.
- **Application:**
- Enter short positions under these conditions.
- Use the cloud’s upper boundary as a reference for setting stop-loss orders and profit targets.
### Best Timeframes & Trading Styles
- **Timeframes:**
Optimally used on M30 and higher timeframes to ensure trend reliability and reduce market noise.
- **Trading Styles:**
Suitable for swing trading, intraday trading, and momentum-based strategies.
- **Risk Management:**
Always complement indicator signals with additional analysis (like volume or price action) and apply proper risk management techniques.
---
## Important Note
This indicator is a **technical analysis tool** designed to assist traders in identifying market trends and potential reversal points. It should be used in conjunction with comprehensive market analysis and proper risk management. Trading decisions should not rely solely on this indicator.
[SHORT ONLY] 10 Bar Low Pullback█ STRATEGY DESCRIPTION
The "10 Bar Low Pullback" strategy is a contrarian short trading system designed to capture pullbacks after a new 10‐bar low is made. it identifies a potential short opportunity when the current bar’s low breaks below the lowest low of the previous 10 bars, provided that the bar exhibits strong internal momentum as measured by its IBS value. An optional trend filter further refines entries by requiring that the close is below a 200-period EMA.
█ WHAT IS INTERNAL BAR STRENGTH (IBS)?
Internal Bar Strength (IBS) measures where the closing price falls within the high-low range of a bar. It is calculated as:
ibs = (close - low) / (high - low)
- Low IBS (≤ 0.2): Indicates the close is near the bar's low, suggesting oversold conditions.
- High IBS (≥ 0.8): Indicates the close is near the bar's high, suggesting overbought conditions.
█ SIGNAL GENERATION
1. SHORT ENTRY
A Short Signal is triggered when:
The current bar’s low is below the lowest low of the past X bars (default: 10).
The bar’s IBS is greater than the specified threshold (default: 0.85).
The signal occurs within the defined trading window (between Start Time and End Time).
If the EMA Filter is enabled, the close must be below the 200-period EMA.
2. EXIT CONDITION
An exit Signal is generated when the current close falls below the previous bar’s low (close < low ), indicating a potential bearish reversal and prompting the strategy to close its short position.
█ ADDITIONAL SETTINGS
Lookback Period: Defines the number of bars (default is 10) over which the lowest low is calculated.
IBS Threshold: Sets the minimum required IBS value (default is 0.85) to qualify as a pullback.
Trading Window: Trades are only executed between the user-defined Start Time and End Time.
EMA Filter (Optional): When enabled, short entries are only considered if the current close is below the 200-period EMA, with the EMA period being adjustable (default is 200).
█ PERFORMANCE OVERVIEW
Designed for shorting opportunities, this strategy aims to capture pullbacks following an aggressive 10-bar low break.
It leverages a combination of a lookback low and IBS measurement to identify overextended bullish moves that may revert.
The optional EMA filter helps confirm a bearish market environment by ensuring the price remains under the trend line.
Suitable for use on various assets, including stocks and ETFs, on daily or similar timeframes.
Backtesting and parameter optimization are recommended to tailor the strategy to specific market conditions.

EMA/SMA Ribbon Pro (AUTO HTF + Labels)This indicator is a multi-timeframe (MTF) moving average ribbon that dynamically adjusts to the next highest timeframe. It provides a visual representation of market trends by stacking multiple EMAs and SMAs with customizable color fills and labels.
Features
✅ Multi-Timeframe (MTF) Support: Automatically detects the next highest time frame or allows for manual selection
✅ Customizable Moving Averages: Supports EMA and SMA with different lengths for flexible configuration
✅ Ribbon Visualization: Smooth color transitions between different moving averages for better trend identification
✅ Crossover Labels: Detects bullish and bearish EMA/SMA crossovers and marks them on the chart
✅ Price Labels & Timeframe Display: Displays moving average values to the right of the price axis with customizable label padding and colors
How It Works
Select the HTF mode: Manual or automatic
Choose EMA/SMA lengths to create different ribbons
Enable/disable price labels for each moving average
Customize colors and transparency for ribbons and labels
Crossover labels appear when faster moving averages cross slower ones and vice versa
Use Cases
📌 Trend Identification: Identify bullish and bearish trends using multiple EMAs and SMAs
📌 Support & Resistance Zones: MAs can act as dynamic support and resistance levels
📌 Reversal & Confirmation Signals: Watch for MTF crossovers to confirm trend changes
Customization
🔹 Standard EMA Lengths: 6, 8, 13, 21, 34, 48, 100, 200, 300, 400
🔹 SMA Lengths: 48, 100, 200
🔹 Color Adjustments: Set custom colors for bullish/bearish ribbons
🔹 Crossovers: Enable/disable custom crossover pairs (e.g., 100/200 EMA, 200 EMA/SMA).
This indicator is perfect for traders who rely on multi-timeframe confluence while seeking to enhance their market analysis and decision-making process.
As always, by combining EMA/SMA Ribbon with other tools, traders ensure that they are not relying on a single indicator. This layered approach can reduce the likelihood of false signals and improve overall trading accuracy.
As always, be sure to use any indicator with price action and volume indicators for better trade confirmation!

TRENDSYNC BUY/SELL BY SIMPLY_DANTE-FXTrendSync Buy and Sell Indicator
PS: Kindly give me feedback on the comment section, I will really appriciate
Created By: Simply_Dante-FX
About the Author:
Simply_Dante-FX is a skilled trader and developer with a focus on creating custom indicators and strategies for technical analysis. With a strong understanding of market behavior, he has designed the TrendSync Buy and Sell indicator to help traders identify high-probability buy and sell signals based on a combination of trend-following, momentum, and price action strategies. Simply_Dante-FX aims to provide tools that enhance trading decisions and improve the overall trading experience.
---
Description:
The TrendSync Buy and Sell indicator is designed to help traders identify potential buy and sell signals based on a combination of trend-following and momentum-based strategies. This custom indicator combines a range of technical tools, including the Simple Moving Average (SMA), Average True Range (ATR), and the Relative Strength Index (RSI), to filter and confirm entry points.
---
How It Works:
1. Trend Identification (SMA):
- The indicator uses the 200-period Simple Moving Average (SMA) to determine the overall trend direction.
- A Buy Signal is generated when the price is above the SMA, indicating an uptrend.
- A Sell Signal is generated when the price is below the SMA, indicating a downtrend.
2. Range Filtering (ATR):
- The Average True Range (ATR) is used to filter out signals that occur during periods of low volatility.
- The ATR is multiplied by a user-defined range filter multiplier (default is 1.2) to ensure the signal is coming from a sufficiently volatile market condition.
3. Momentum Confirmation (RSI):
- The RSI is used as a momentum filter. For Buy Signals, the RSI must be above the user-defined threshold (default is 50), indicating bullish momentum.
- For Sell Signals, the RSI must be below the opposite threshold (100 - RSI Threshold), indicating bearish momentum.
4.Price Action Conditions:
- Buy and Sell signals are further confirmed by price action:
- Buy Signal: Identifies higher lows during an uptrend.
- Sell Signal: Identifies higher highs during an uptrend, or lower highs in a downtrend.
5. Unified Signal:
- The script combines the various conditions to generate a unified signal, ensuring that only high-probability trade opportunities are highlighted.
How to Use It:
1.Buy Signal: Look for a green label below the bar, which indicates a potential buying opportunity. This signal is generated when:
- The price is above the 200-period SMA (uptrend).
- The RSI is above the defined threshold (momentum confirmation).
- The ATR-based range filter confirms sufficient market movement.
2. Sell Signal: Look for a red label above the bar, which indicates a potential selling opportunity. This signal is generated when:
- The price is below the 200-period SMA (downtrend).
- The RSI is below the defined threshold (momentum confirmation).
- The ATR-based range filter confirms sufficient market movement.
3. Visual Confirmation: The script also plots the 200-period SMA for easy identification of the overall trend direction.
4.Alert Setup: You can set up an alert using the “Unified Buy/Sell Alert” condition to notify you when a buy or sell signal is triggered.
Disclaimer:
- Risk Warning: The TrendSync Buy and Sell indicator is a tool for technical analysis and is not a guaranteed method for predicting market movements. Trading carries risk, and it is essential to use proper risk management techniques and not rely solely on any one indicator.
- No Financial Advice: This indicator does not constitute financial advice, and the author, Simply_Dante-FX, does not take responsibility for any trading losses or profits resulting from the use of this tool.
- Performance: Past performance is not indicative of future results. Always conduct your own analysis and use additional tools and strategies to confirm trade decisions.
Use this indicator with caution, and always ensure that you understand the risks involved in trading before committing real capital.

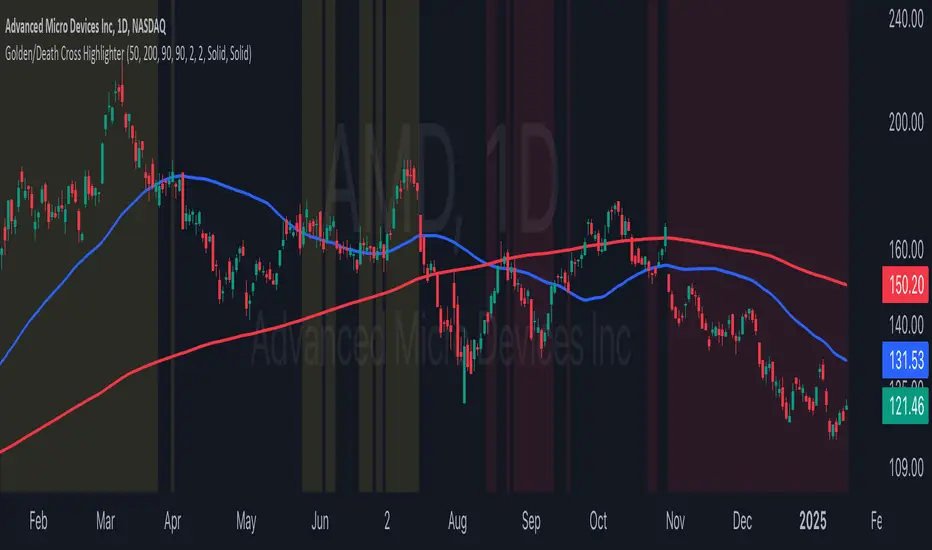
Golden/Death Cross HighlighterThis indicator helps you easily identify and visualize Golden Cross and Death Cross patterns combined with price action confirmation. It highlights chart backgrounds when specific conditions are met, making it easy to spot potential trend changes.
🔑 Key Features:
Highlights Golden Cross conditions (50 SMA crosses above 200 SMA) when price closes above both MAs
Highlights Death Cross conditions (50 SMA crosses below 200 SMA) when price closes below both MAs
Customizable MA lengths (default: 50 and 200)
Adjustable highlight opacity
Built-in alerts for cross events
Clear visualization of both moving averages
📈 Color Guide:
Yellow Background: Golden Cross active + price above both MAs
Red Background: Death Cross active + price below both MAs
⚙️ Settings:
Fast MA Length: Length of faster moving average (default 50)
Slow MA Length: Length of slower moving average (default 200)
Golden Cross Highlight Opacity: Adjust visibility of bullish highlights
Death Cross Highlight Opacity: Adjust visibility of bearish highlights
💡 Usage Tips:
Use in combination with other indicators for confirmation
Set up alerts for potential trend changes
Adjust opacity to match your chart style
Works best on higher timeframes (4H, Daily, Weekly)
Mean Reversion Pro Strategy [tradeviZion]Mean Reversion Pro Strategy : User Guide
A mean reversion trading strategy for daily timeframe trading.
Introduction
Mean Reversion Pro Strategy is a technical trading system that operates on the daily timeframe. The strategy uses a dual Simple Moving Average (SMA) system combined with price range analysis to identify potential trading opportunities. It can be used on major indices and other markets with sufficient liquidity.
The strategy includes:
Trading System
Fast SMA for entry/exit points (5, 10, 15, 20 periods)
Slow SMA for trend reference (100, 200 periods)
Price range analysis (20% threshold)
Position management rules
Visual Elements
Gradient color indicators
Three themes (Dark/Light/Custom)
ATR-based visuals
Signal zones
Status Table
Current position information
Basic performance metrics
Strategy parameters
Optional messages
📊 Strategy Settings
Main Settings
Trading Mode
Options: Long Only, Short Only, Both
Default: Long Only
Position Size: 10% of equity
Starting Capital: $20,000
Moving Averages
Fast SMA: 5, 10, 15, or 20 periods
Slow SMA: 100 or 200 periods
Default: Fast=5, Slow=100
🎯 Entry and Exit Rules
Long Entry Conditions
All conditions must be met:
Price below Fast SMA
Price below 20% of current bar's range
Price above Slow SMA
No existing position
Short Entry Conditions
All conditions must be met:
Price above Fast SMA
Price above 80% of current bar's range
Price below Slow SMA
No existing position
Exit Rules
Long Positions
Exit when price crosses above Fast SMA
No fixed take-profit levels
No stop-loss (mean reversion approach)
Short Positions
Exit when price crosses below Fast SMA
No fixed take-profit levels
No stop-loss (mean reversion approach)
💼 Risk Management
Position Sizing
Default: 10% of equity per trade
Initial capital: $20,000
Commission: 0.01%
Slippage: 2 points
Maximum one position at a time
Risk Control
Use daily timeframe only
Avoid trading during major news events
Consider market conditions
Monitor overall exposure
📊 Performance Dashboard
The strategy includes a comprehensive status table displaying:
Strategy Parameters
Current SMA settings
Trading direction
Fast/Slow SMA ratio
Current Status
Active position (Flat/Long/Short)
Current price with color coding
Position status indicators
Performance Metrics
Net Profit (USD and %)
Win Rate with color grading
Profit Factor with thresholds
Maximum Drawdown percentage
Average Trade value
📱 Alert Settings
Entry Alerts
Long Entry (Buy Signal)
Short Entry (Sell Signal)
Exit Alerts
Long Exit (Take Profit)
Short Exit (Take Profit)
Alert Message Format
Strategy name
Signal type and direction
Current price
Fast SMA value
Slow SMA value
💡 Usage Tips
Consider starting with Long Only mode
Begin with default settings
Keep track of your trades
Review results regularly
Adjust settings as needed
Follow your trading plan
⚠️ Disclaimer
This strategy is for educational and informational purposes only. It is not financial advice. Always:
Conduct your own research
Test thoroughly before live trading
Use proper risk management
Consider your trading goals
Monitor market conditions
Never risk more than you can afford to lose
📋 Release Notes
14 January 2025
Added New Fast & Slow SMA Options:
Fibonacci-based periods: 8, 13, 21, 144, 233, 377
Additional period: 50
Complete Fast SMA options now: 5, 8, 10, 13, 15, 20, 21, 34, 50
Complete Slow SMA options now: 100, 144, 200, 233, 377
Bug Fixes:
Fixed Maximum Drawdown calculation in the performance table
Now using strategy.max_drawdown_percent for accurate DD reporting
Previous version showed incorrect DD values
Performance metrics now accurately reflect trading results
Performance Note:
Strategy tested with Fast/Slow SMA 13/377
Test conducted with 10% equity risk allocation
Daily Timeframe
For Beginners - How to Modify SMA Levels:
Find this line in the code:
fastLength = input.int(title="Fast SMA Length", defval=5, options= )
To add a new Fast SMA period: Add the number to the options list, e.g.,
To remove a Fast SMA period: Remove the number from the options list
For Slow SMA, find:
slowLength = input.int(title="Slow SMA Length", defval=100, options= )
Modify the options list the same way
⚠️ Note: Keep the periods that make sense for your trading timeframe
💡 Tip: Test any new combinations thoroughly before live trading
"Trade with Discipline, Manage Risk, Stay Consistent" - tradeviZion

AI InfinityAI Infinity – Multidimensional Market Analysis
Overview
The AI Infinity indicator combines multiple analysis tools into a single solution. Alongside dynamic candle coloring based on MACD and Stochastic signals, it features Alligator lines, several RSI lines (including glow effects), and optionally enabled EMAs (20/50, 100, and 200). Every module is individually configurable, allowing traders to tailor the indicator to their personal style and strategy.
Important Note (Disclaimer)
This indicator is provided for educational and informational purposes only.
It does not constitute financial or investment advice and offers no guarantee of profit.
Each trader is responsible for their own trading decisions.
Past performance does not guarantee future results.
Please review the settings thoroughly and adjust them to your personal risk profile; consider supplementary analyses or professional guidance where appropriate.
Functionality & Components
1. Candle Coloring (MACD & Stochastic)
Objective: Provide an immediate visual snapshot of the market’s condition.
Details:
MACD Signal: Used to identify bullish and bearish momentum.
Stochastic: Detects overbought and oversold zones.
Color Modes: Offers both a simple (two-color) mode and a gradient mode.
2. Alligator Lines
Objective: Assist with trend analysis and determining the market’s current phase.
Details:
Dynamic SMMA Lines (Jaw, Teeth, Lips) that adjust based on volatility and market conditions.
Multiple Lengths: Each element uses a separate smoothing period (13, 8, 5).
Transparency: You can show or hide each line independently.
3. RSI Lines & Glow Effects
Objective: Display the RSI values directly on the price chart so critical levels (e.g., 20, 50, 80) remain visible at a glance.
Details:
RSI Scaling: The RSI is plotted in the chart window, eliminating the need to switch panels.
Dynamic Transparency: A pulse effect indicates when the RSI is near critical thresholds.
Glow Mode: Choose between “Direct Glow” or “Dynamic Transparency” (based on ATR distance).
Custom RSI Length: Freely adjustable (default is 14).
4. Optional EMAs (20/50, 100, 200)
Objective: Utilize moving averages for trend assessment and identifying potential support/resistance areas.
Details:
20/50 EMA: Select which one to display via a dropdown menu.
100 EMA & 200 EMA: Independently enabled.
Color Logic: Automatically green (price > EMA) or red (price < EMA). Each EMA’s up/down color is customizable.
Configuration Options
Candle Coloring:
Choose between Gradient or Simple mode.
Adjust the color scheme for bullish/bearish candles.
Transparency is dynamically based on candle body size and Stochastic state.
Alligator Lines:
Toggle each line (Jaw/Teeth/Lips) on or off.
Select individual colors for each line.
RSI Section:
RSI Length can be set as desired.
RSI lines (0, 20, 50, 80, 100) with user-defined colors and transparency (pulse effect).
Additional lines (e.g., RSI 40/60) are also available.
Glow Effects:
Switch between “Dynamic Transparency” (ATR-based) and “Direct Glow”.
Independently applied to the RSI 100 and RSI 0 lines.
EMAs (20/50, 100, 200):
Activate each one as needed.
Each EMA’s up/down color can be customized.
Example Use Cases
Trend Identification:
Enable Alligator lines to gauge general trend direction through SMMA signals.
Timing:
Watch the Candle Colors to spot potential overbought or oversold conditions.
Fine-Tuning:
Utilize the RSI lines to closely monitor important thresholds (50 as a trend barometer, 80/20 as possible reversal zones).
Filtering:
Enable a 50 EMA to quickly see if the market is trading above (bullish) or below (bearish) it.

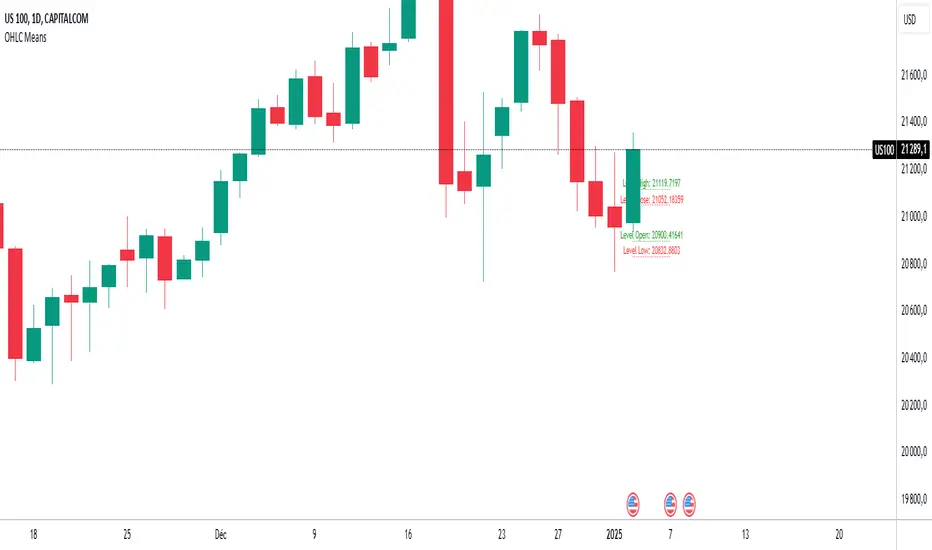
OHLC MeansNote: This indicator works only on daily timeframes.
The indicator calculates the OHLC averages for days corresponding to the day of the last displayed candlestick. For instance, if the last candlestick displayed is Monday, it calculates the OHLC average for all Mondays; if Tuesday, it does the same for all Tuesdays.
Customizable period: The indicator allows you to select the number of candlesticks to analyze, with a default value of 1000. This means it will consider the last 1000 candlesticks before the final displayed one. Assuming there are only five trading days per week, this corresponds to about 200 days. (not true for cryptos, you need to devide by 7)
Example scenario:
Today is Tuesday and we analyse NQ
By default, the indicator analyzes the last 1000 candlesticks (modifiable parameter).
Since there are five trading days in a week,
1000 ÷ 5 = 200
The indicator calculates the OHLC averages for the last 200 Tuesdays, corresponding to the past seven years. Of course it is not exactly 200 becauses the may be one tuesday where the market is closed (if christmas is on tuesday for instance)
Output:
Displays four daily averages as four lines with their levels as labels :
High and Low averages are displayed at the extremes.
Open and Close averages are displayed at the center.
Color coding:
Red indicates bearish movement.
Green indicates bullish movement.
Usage recommendations:
Best suited for assets with a significant historical dataset.
Only functional on daily timeframes.
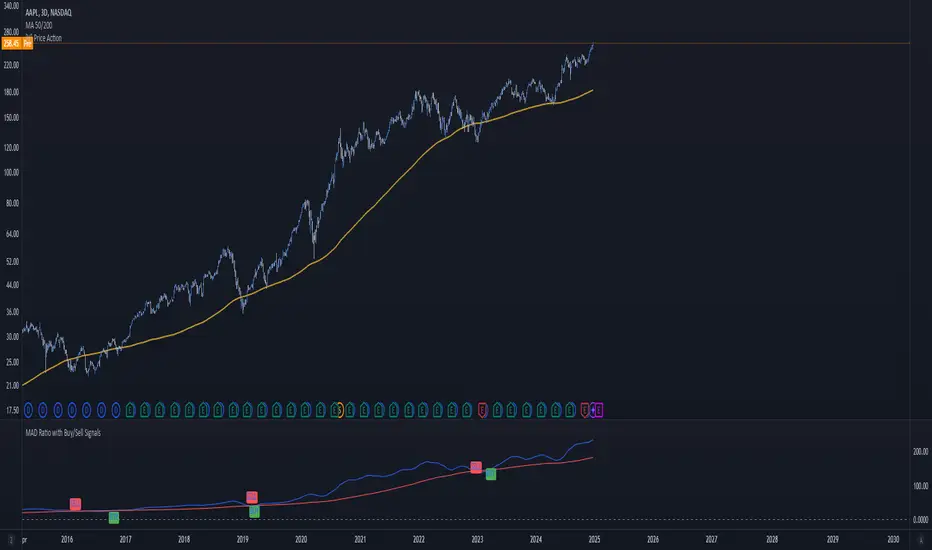
MAD Ratio with Buy/Sell SignalsThis code creates an indicator that generates Buy and Sell signals based on the Moving Average Distance (MAD) Ratio and the crossover/crossunder of two Simple Moving Averages (SMA). Here's a breakdown of what it does:
What the Indicator Shows:
Moving Averages:
21-day SMA (shortMA): Plotted in blue.
200-day SMA (longMA): Plotted in red.
These lines visually represent short-term and long-term trends in price.
Horizontal Reference Line:
A gray horizontal line at Ratio = 1 marks when the 21-day SMA and 200-day SMA are equal. This is the neutral point for the MAD ratio.
Buy and Sell Signals:
Buy Signal (Green Label):
Triggered when:
MAD Ratio > 1 (shortMA is greater than longMA, indicating upward momentum).
The 21-day SMA crosses above the 200-day SMA.
Displays a green "BUY" label below the price chart.
Sell Signal (Red Label):
Triggered when:
MAD Ratio < 1 (shortMA is less than longMA, indicating downward momentum).
The 21-day SMA crosses below the 200-day SMA.
Displays a red "SELL" label above the price chart.