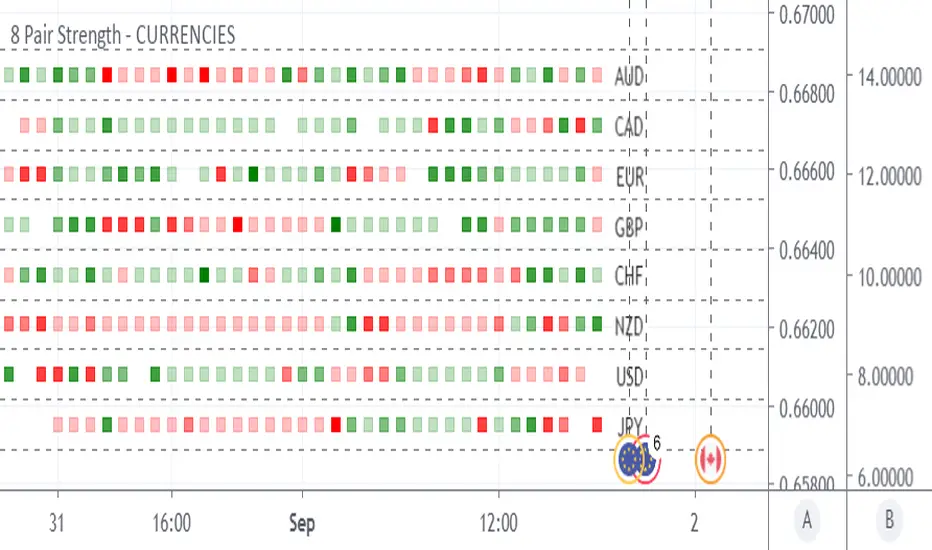
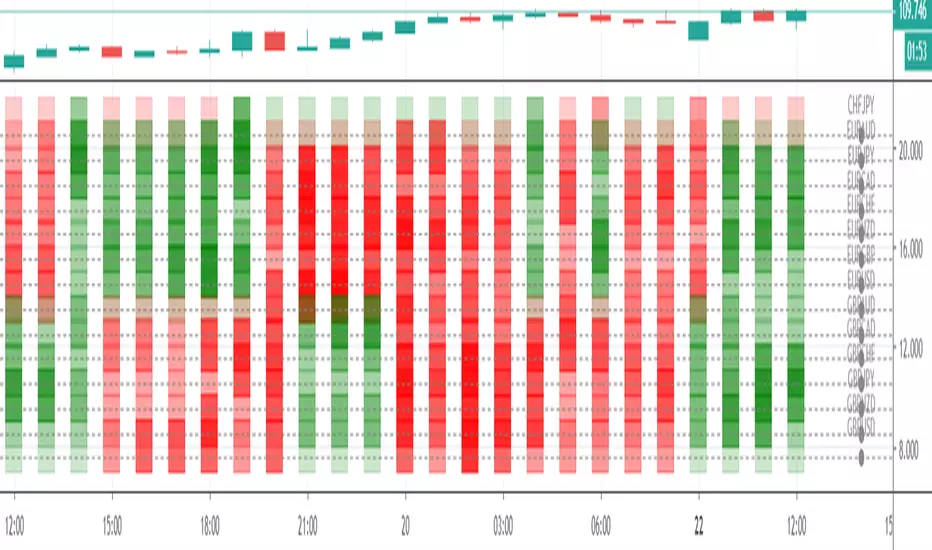
8 Pair StrengthCurrency Strength meter
This is a stripped down version of the "8 Pair Strength - updated by rmireland for CHF/ EUR/GBP" and "8 Pair Strength - updated by rmireland for AUD/CAD / NZD/USD"
which give a Heat-map of all Pairs
First created by Glaz in 2015 and updated a few times by JustUncleL in 2017 , I have stripped out the plot functions and Heat Mapped the currencies
Enjoy and comments welcome
ps : The bottom window is the original 8 Pair Strength code with columns added for better clarity and ray coming off the previous points to show movement from the previous to the current
在脚本中搜索"2015年黄金价格走势"
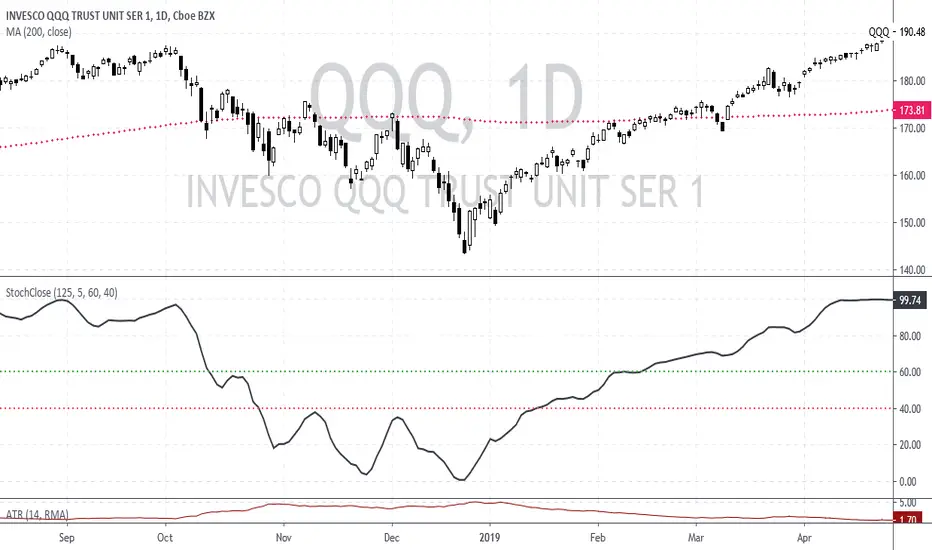
Stochastic based on Closing Prices - Identify and Rank TrendsStochClose is a trend indicator that can be used on its own to measure trend strength, in a scan to rank a group of securities according to trend strength or as part of a trend following strategy. Moreover, it acts as a volatility-adjusted trend indicator that puts securities on an equal footing.
StochClose measures the location of the current close relative to the close-only high-low range over a given period of time. In contrast to the traditional Stochastic Oscillator, this indicator only uses closing prices. Traditional Stochastic uses intraday highs and lows to calculate the range. The focus on closing prices reduces signal noise caused by intraday highs and lows, and filters out errant or irrationally exuberant price spikes.
Here are some examples when the high or low was out of proportion and suspect. Perhaps most famously, there were errant spike lows in dozens of ETFs in August 2015 (XLK, IJR, ITB). There were other spikes in VMBS (October 2014), IJR (October 2008) and KRE (May 2011). Elsewhere, there were suspicious spikes in IEI (April 2020), CHD (March 2020), CCRN (March 2020) and FNB (March 2020)
The preferred setting to identify medium and long-term uptrends is 125 days with 5 days smoothing. 125 days covers around six months. Thus, StochClose(125,5) is a 5-day SMA of the 125-day Stochastic based on closing prices. Smoothing with the 5-day SMA introduces a little lag, but reduces whipsaws and signal noise.
StochClose fluctuates between 0 and 100 with 50 as the midpoint. Values above 80 indicate that the current price is near the high end of the 125-day range, while values below 20 indicate that price is near the low end of the range. For signals, a move above 60 puts the indicator firmly in the top half of the range and points to an uptrend. A move below 40 puts the indicator firmly in the bottom half of the range and points to a downtrend.
StochClose values can also be ranked to separate the leaders from the laggards. In contrast to Rate-of-Change and Percentage Above/Below a Moving Average, StochClose acts as a volatility-adjusted indicator that can identify trend strength or weakness. The Consumer Staples SPDR is unlikely to win in a Rate-of-Change contest with the Technology SPDR. However, it is just as easy for the Consumer Staples SPDR to get in the top of its range as it is for the Technology SPDR. StochClose puts securities on an equal footing.
StochClose measures trend direction and trend strength with one number. The indicator value tells us immediately if the security is trending higher or lower. Furthermore, we can compare this value against the values for other securities. Securities with higher StochClose values are stronger than those with lower values.
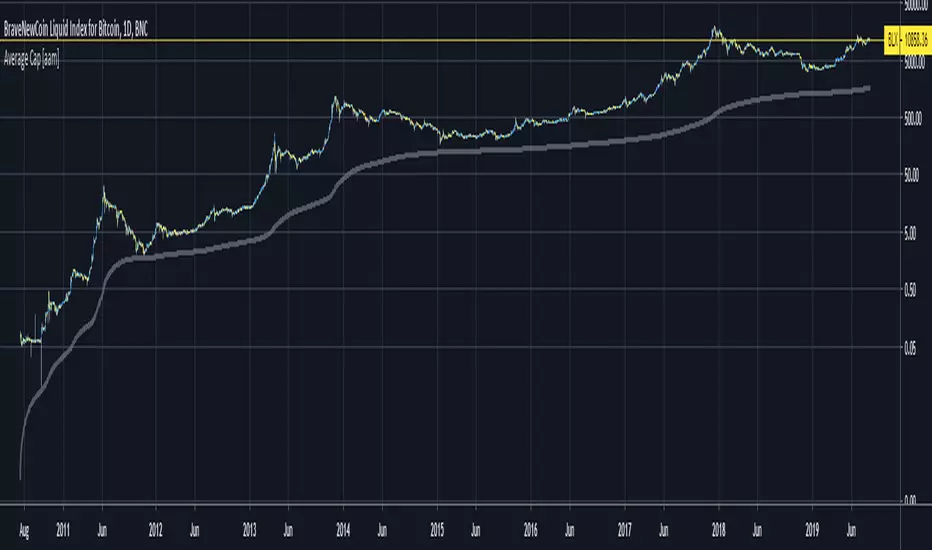
Average Cap [aamonkey]This is the "forever" moving average of the Market Cap.
The cumulative sum of the daily Market Cap values divided by the age of the market in days.
Can be seen as an ultimate bottom that should never be touched and if so is a good buying opportunity.
The default settings are for BTC.
If you want to test this indicator on another chart you have to change the launch date settings (and maybe play around with the multiplier).
Some Interesting Launch dates:
- BTC: 3 JAN 2009
- ETH: 30. JUL 2015
- LTC: 7. OCT 2011
This indicator is also the base for other indicators like my "Top Cap" indicator.
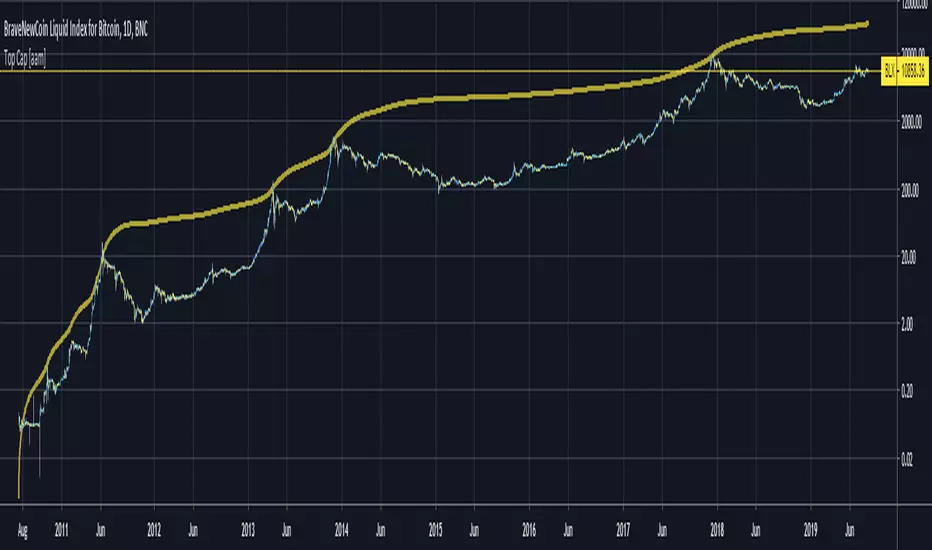
Top Cap [aamonkey]Historically matched market tops for BTC.
It's the Average Cap (see my other indicator) multiplied by 35.
The default settings are for BTC.
If you want to test this indicator on another chart you have to change the launch date settings (and maybe play around with the multiplier).
Some Interesting Launch dates:
- BTC: 3 JAN 2009
- ETH: 30. JUL 2015
- LTC: 7. OCT 2011
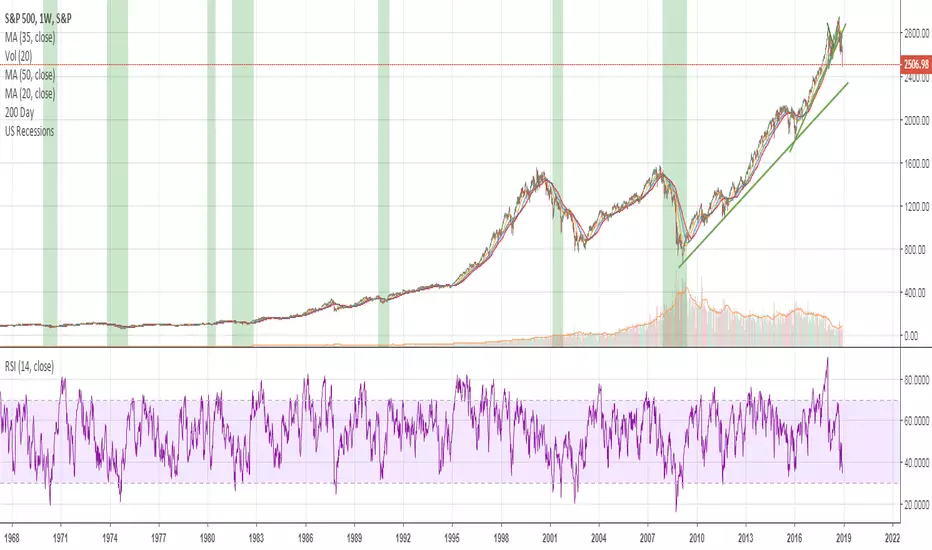
Mega Trend Plus - S&P 500 Trend Follower / Market GaugeFirstly, 100% of the credit goes to Greg Morris @ Stockcharts.com for the article detailing the concept and most of the settings/components. I've simply implemented his idea. I haven't sought permission from him, but given that he was open with the components of the indicator I'm assuming he's happy for me to go ahead and code this in pinescript. See the article here: stockcharts.com
Okay, so this is part of a system/indicator Greg outlined in the article that he calls Trend Gauge. The idea is fairly simple: take a group of indexes that cover the breadth of the market you want to trade, track their relationship/position to their 200 period Exponential Moving Average (EMA), and assign scores to bull/bear crosses + relative location to the EMA. Once you've normalized and aggregated the scores you finish up with a trend following indicator that works surprisingly well.
This part is called Mega Trend Plus, and tracks whether an index is above or below its 200 period EMA. I'll be releasing the second part ("Trend Strength") soon. Once that's done I'll combine them to form the full "Trend Gauge" indicator.
I decided to provide the base version that people can then experiment with and tweak to their liking, so Greg's version shown in the article is smoother than the one provided here. It's up to you to play with smoothing options, and potentially tweak the weightings of the various components. Please see the script for info on what the various inputs are - I've added notes there.
So, how does it do? Well, as you can see from the chart above it works pretty well overall. The S&P 500 has been fairly trendy over the last few decades, so it's been prime territory for a system like this. It would have kept you out of the big bear markets (particularly GFC & 2015-16), and that's the goal of any trend-based system. They thrive on how little they lose, not necessarily on how much they make.
As you can see, the indicator is pretty choppy. So it's not designed (in the current configuration) to provide accurate buy/hold/sell signals. It currently functions more as a market gauge / strength indicator.
Hopefully you find this concept interesting. It's simple, but the best systems often are.
Please add comments below if you come up with an interesting configuration or variation.
Let me know if you have any queries.
DD

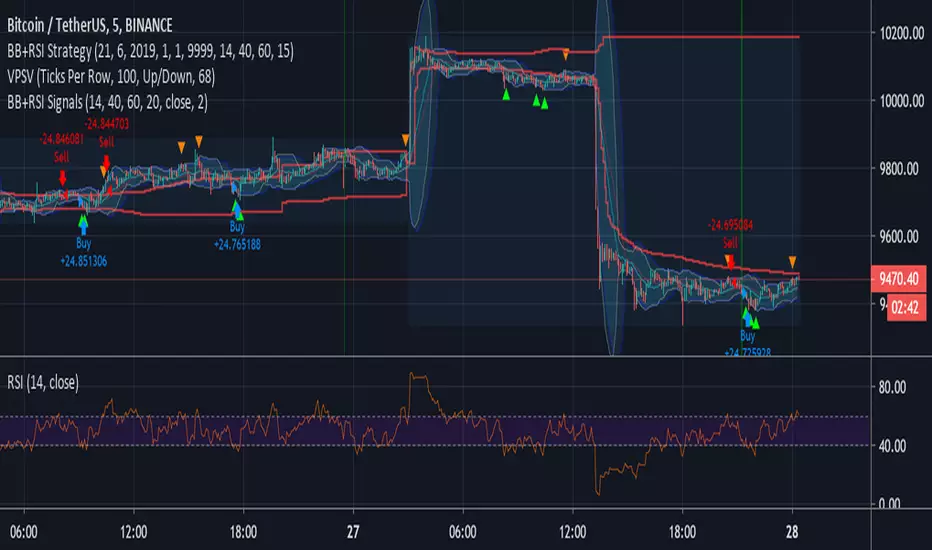
Bollinger + RSI Signals (by Bader Kamal)This idea originally by ChartArt on January 14, 2015 as Strategy, and I modify it to become as Signals on 26 July 2019.
This signals uses a modified RSI to sell when the RSI increases over the value of 60 (or to buy when the value falls below 40), with the classic Bollinger Bands strategy to sell when the price is above the upper Bollinger Band (and to buy when this value is below the lower band).
This signals only triggers when both the RSI and the Bollinger Bands indicators are at the same time in a overbought or oversold condition.
8 Pair Strength - updated by rmireland for CHF/EUR/GBPCurrency Strength meter
First created by Glaz in 2015 and updated a few times by JustUncleL in 2017 , I have stripped out the plot functions and color coded results against pairs.
I feel this makes the results easier to interpret. The darker the color the stronger the asset.
As Pine Script only allows a maximum of outputs, I have split this into 2 Scripts to cover all 28 pairs.
8 Pair Strength - AUD/CAD/NZD/USD for AUD/CAD - AUD/CHF - AUD/JPY - AUD/NZD
AUD/USD - CAD/CHF - CAD/JPY - NZD/CAD
NZD/CHF - NZD/JPY - NZD/USD - USD/CAD
USD/CHF - USD/JPY
8 Pair Strength - CHF/EUR/GBP for CHF/JPY - EUR/AUD - EUR/JPY - EUR/CAD
EUR/CHF - EUR/NZD - EUR/GBP - EUR/USD
GBP/AUD - GBP/CAD - GBP/CHF - GBP/JPY
GBP/NZD - GBP/USD
Enjoy
8 Pair Strength - updated by rmireland for AUD/CAD/NZD/USDCurrency Strength meter
First created by Glaz in 2015 and updated a few times by JustUncleL in 2017 , I have stripped out the plot functions and color coded results against pairs.
I feel this makes the results easier to interpret. The darker the color the stronger the asset.
As Pine Script only allows a maximum of outputs, I have split this into 2 Scripts to cover all 28 pairs.
8 Pair Strength - AUD/CAD/NZD/USD for AUD/CAD - AUD/CHF - AUD/JPY - AUD/NZD
AUD/USD - CAD/CHF - CAD/JPY - NZD/CAD
NZD/CHF - NZD/JPY - NZD/USD - USD/CAD
USD/CHF - USD/JPY
8 Pair Strength - CHF/EUR/GBP for CHF/JPY - EUR/AUD - EUR/JPY - EUR/CAD
EUR/CHF - EUR/NZD - EUR/GBP - EUR/USD
GBP/AUD - GBP/CAD - GBP/CHF - GBP/JPY
GBP/NZD - GBP/USD
Enjoy

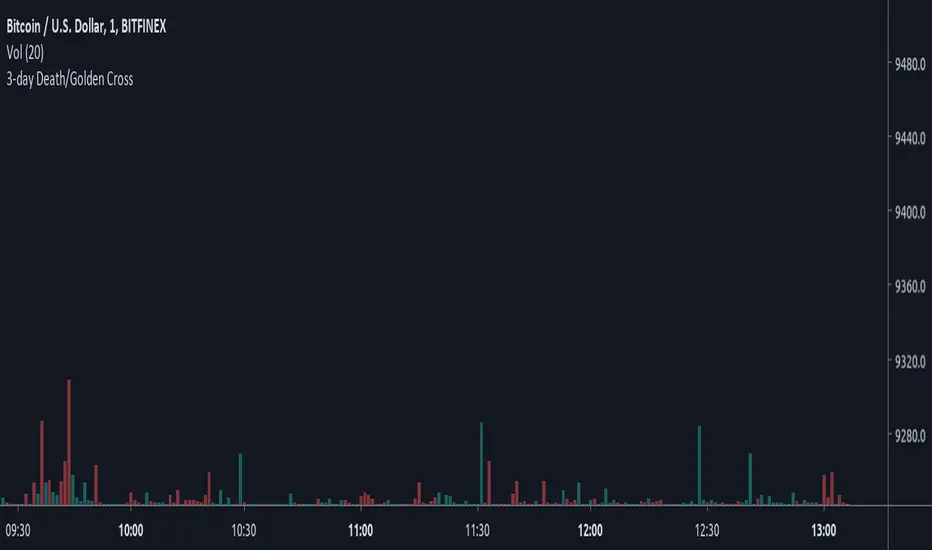
3-day Death/Golden CrossBased on Crypto Crew University youtube video, "Emergency Update: New Bitcoin GOLDEN Cross Emerges (btc crypto live news market price today 2019 ta" (19 June 2019), comparing 2015 and 2018 bull runs.
Featherlite RSI - Extra SensitiveFeatherlite RSI - Extra Sensitive
This is a combined relative strength index (RSI) ans stochastic RSI indicator set to the super sensitive period of 2 candles.
I use this setting particularly on higher timeframes such as M, W, D but can also be useful on 4h. However lower timeframes, will become to noisy.
If you compare to the standard setting of 14, you can see that the pump and dump structure is a lot more washed out
The RSI builds up slowly from its low point in 2015 to a single maximum in 2017. This is great for charting the longer cycle (interyear bull / bear), but is of little help for charting the intermediate swings. However, by increasing the sensitivity we can see when the RSI is maxing out on an intermonth basis. And indeed this matches the actual high points of the previous bull runs very well.
The indicator also includes a stochastic RSI indicator also set to the same candle period.
In practice it is always good to use a range of indicators to get a feel for what is going on. This is good for intermonth cycles on M and W timeframes. For longer cycles use the standard period setting of 14.

Hucklekiwi Pip - HLHB Trend-Catcher SystemThe strategy was authored by Hucklekiwi Pip back in 2015 and is still being updated today. She says that the system was designed to simply catch short-term forex trends. At its heart, the system is a simple EMA crossover strategy with a couple of other indicators used for confirming entries.
Strategy Rules
See her original post here:
www.babypips.com
Be sure to check out the updates and tweaks over the years!
HOW TO USE
For full information on how to use this strategy and how to correctly set the exit time, see this post:
backtest-rookies.com

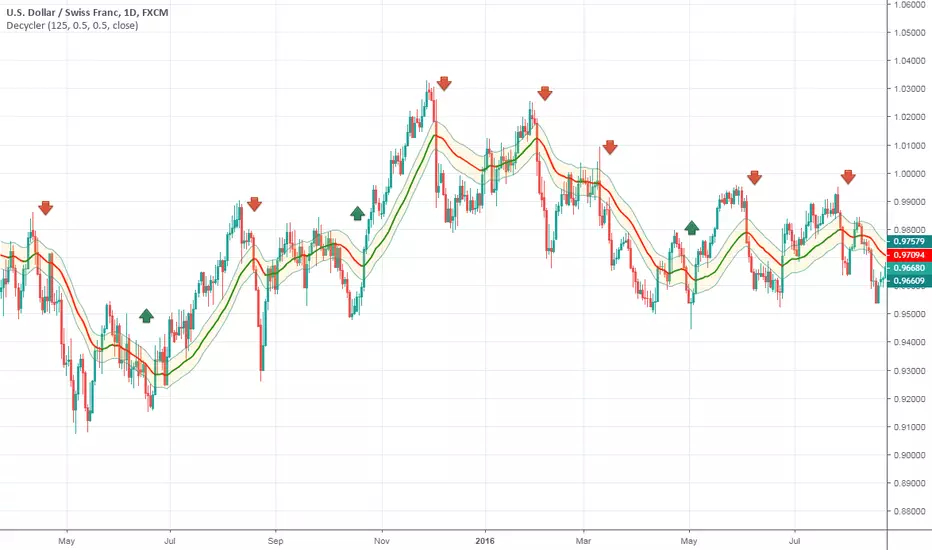
Ehlers Decycler OscillatorThis indicator was originally developed by John F. Ehlers (Stocks & Commodities , V.33:10 (September, 2015): "Decyclers").
The idea is still the same as for the Simple Decycler.
Mr. Ehlers suggested to virtually eliminate lag by getting rid of the very low-frequency components. So, he applied the high-pass filter to the simple decycler.
Mr. Ehlers recommended to use two instances of the Decycler Oscillator with different parameters (high-pass filter period and multiplier). As a result, he got the Decycler Oscillator pair.
The first oscillator (red line) has a period of 125 bars, the second one (yellow line) has a period of 100 bars.
The interpretation is straightforward:
When the yellow line crosses over the red line, a trend reversal to the upside is indicated.
When the yellow line crosses under the red line, a trend reversal to the downside is indicated.

Ehlers Simple DecyclerThis indicator was originally developed by John F. Ehlers (Stocks & Commodities, V.33:10 (September, 2015): "Decyclers").
Mr. Ehlers suggested a way to improve trend identification using high-pass filters. The basic smoothers like SMA, low-pass filters, have considerable lag in their display. Mr. Ehlers applied the high-pass filter and subtracted the high-pass filter output from the time series input. Doing these steps he removed high-frequency short-wavelength components (the ones causing the wiggles) from the time series.
As a result he got a special series of the low-frequency components with virtually no lag - the Decycler.
The Decycler is plotted with two additional lines (the percent-shifts of Decycler) and together they form a hysteresis band.
If the prices are above the upper hysteresis line, then the market is in an uptrend . If the prices are below the low hysteresis line, then the market is in a downtrend . Prices within the hysteresis band are trend-neutral .
US Recessions Credit to Sinuhet for creating the primary script. My change just gets rid of the bug that had erred in indicating another recession in 2015/2016.
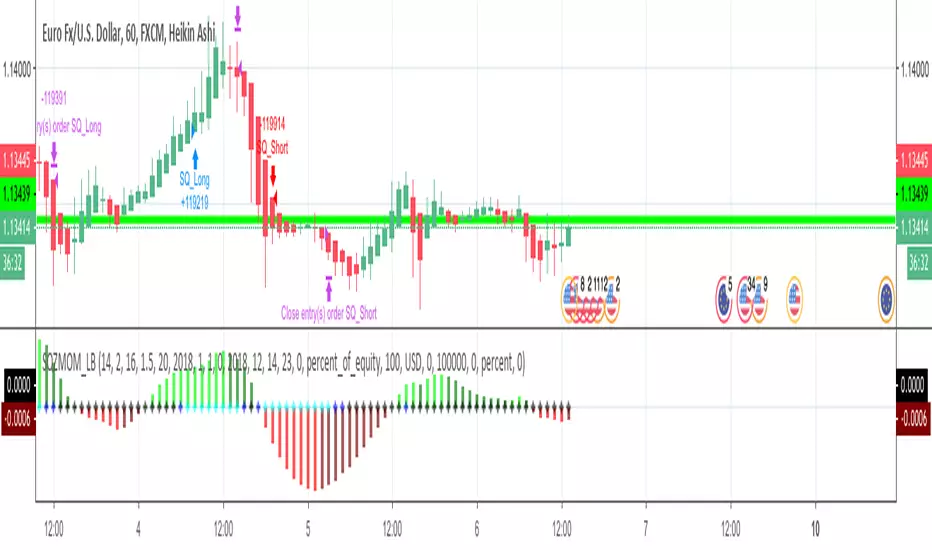
Strategy based on Squeeze Momentum Indicator [LazyBear]This Strategy is based on LazyBear Squeeze Momentum Indicator.
I added some custom feature and filters.
You can customize a lot of features to get a profitable strategy.
Here is a link to original study.
Please use comment section for any feedback.
Next improvement (only to whom is interested to this script and follows me): study with alerts on multiple tickers all at one. Leave a comment if you want to have access to study.
********************************** IMPORTANT*******************************
I have developed an expert advisor for metatrader4 (MT4) and for jforex platform: results of expert advisor form 2015-01-01 to 2018-11-25 are very good with low drawdown and good profit.
********************************************************************************
ec tEST cODE FOR pERCENT DIFERENCE ////////////////////////////////////////////////////////////
// Copyright by HPotter v1.0 04/04/2015
// Percent difference between price and MA
////////////////////////////////////////////////////////////
study(title="Percent difference between price and MA")
source = close
useCurrentRes = input(true, title="Use Current Chart Resolution?")
resCustom = input(title="Use Different Timeframe? Uncheck Box Above", type=resolution, defval="60")
smd = input(true, title="Show MacD & Signal Line? Also Turn Off Dots Below")
sd = input(true, title="Show Dots When MacD Crosses Signal Line?")
sh = input(true, title="Show Histogram?")
macd_colorChange = input(true,title="Change MacD Line Color-Signal Line Cross?")
hist_colorChange = input(true,title="MacD Histogram 4 Colors?")
res = useCurrentRes ? period : resCustom
fastLength = input(12, minval=1), slowLength=input(26,minval=1)
signalLength=input(9,minval=1)
fastMA = ema(source, fastLength)
slowMA = ema(source, slowLength)
Length = input(9, minval=1)
Length2= input(36,minval=1)
Length3= input(81,minval=1)
AveragePrice= input(9,minval=1)
Length5= input(3,minval=1)
xSMA = (sma(close, Length)+sma(close, Length2)+sma(close, Length3))/3
pSAM=sma(close, AveragePrice)
nRes = (pSAM - xSMA) * 100 / close
signalnRes = sma(nRes, signalLength)
macd = nRes
signal = sma(macd, signalLength)
hist = macd - signal
outMacD = security(tickerid, res, macd)
outSignal = security(tickerid, res, signal)
outHist = security(tickerid, res, hist)
histA_IsUp = outHist > outHist and outHist > 0
histA_IsDown = outHist < outHist and outHist > 0
histB_IsDown = outHist < outHist and outHist <= 0
histB_IsUp = outHist > outHist and outHist <= 0
//MacD Color Definitions
macd_IsAbove = outMacD >= outSignal
macd_IsBelow = outMacD < outSignal
plot_color = hist_colorChange ? histA_IsUp ? aqua : histA_IsDown ? blue : histB_IsDown ? red : histB_IsUp ? maroon :yellow :gray
macd_color = macd_colorChange ? macd_IsAbove ? lime : red : red
signal_color = macd_colorChange ? macd_IsAbove ? yellow : yellow : lime
circleYPosition = outSignal
// MA COLOR DEFINITION
maColor = change(nRes)>0 ? green : change(nRes)<0 ? red : na
mA_IsAbove = nRes> 0
mA_IsBelow = nRes< 0
plot( nRes, color=maColor, style=line, title="MMA", linewidth=2)
//plot(smd and signalnRes ? signalnRes : na, title="Signal Line", color=signal_color, style=line ,linewidth=2)
//plot(smd and outMacD ? outMacD : na, title="MACD", color=macd_color, linewidth=4)
//plot(smd and outSignal ? outSignal : na, title="Signal Line", color=signal_color, style=line ,linewidth=2)
//plot(sh and outHist ? outHist : na, title="Histogram", color=plot_color, style=histogram, linewidth=4)
plot(sd and cross(outMacD, outSignal) ? circleYPosition : na, title="Cross", style=circles, linewidth=4, color=macd_color)
hline(0, '0 Line', linestyle=solid, linewidth=2, color=white)
//////ALERT cONDITION////
src = input(close)
ma_1 = sma(src, 20)
ma_2 = sma(src, 10)
c = cross(ma_1, ma_2)
alertcondition(c, title='Red crosses blue', message='Red and blue have crossed!')
d = cross(outMacD, outSignal)
alertcondition(d, title='GOING DOWN', message='SELL!')
//
//e = cross(outSignal, outMacD)
//alertcondition(E, title='GOING UP', message='BUY!')

@WACC Volatility Weighted PUT/CALL Positions [SPX]This indicator is based on Volatility and Market Sentiment. When volatility is high, and market sentiment is positive, the indicator is in a low or 'buy state'. When volatility is low and market sentiment is poor, the indicator is high.
The indicator uses the VIX as it's volatility input.
The indicator uses the spread between the Call Volume on SPX/SPY and the Put Volume.
This is pulled from CVSPX and PVSPX.
When volatility and put/call reaches a critical level, such as the levels present in a crisis or a sell off, the line will be green. See Sept 2015, 2008, and Feb 2018.
This level can be edited in the source code.
As the indicator is based on Put/Call, the indicator works best on larger time frames as the put/call ratio becomes a more discernible measure of sentiment over time.

Kripto Index (KRIN) [WOZDUX]Created cryptocurrency index in the image and likeness of the Dow Jones. for this we have created a virtual cryptoperthite. This portfolio was formed on 7-08-2014, when allegedly purchased for 1 thousand dollars of each cryptocurrency. On that date, make a certain quantity amount of cryptocoins depending on the value. If bought 5 coins, then spent 5 thousand dollars. In the future, we calculate the current value of this portfolio and divide by 5000 to get a parameter showing how much the value of this crypto-portfolio has dared.
I used two dates. The first date is August 7, 2014 and 5 coins were used, the second date is January 1, 2015 and 6 coins were used.
The green line corresponds to the first date and the blue line corresponds to the second date. Thus, we obtain two variants of the crypto index.
With this crypto index ( abbreviated name-KRIN), you can observe the aggregate price movement of the crypto community.

Money Flow Oscillator 2A volume indicator that measures buying and selling pressure over a given lookback period.
As described at traders.com
See also:
- Are price updates a good proxy for actual traded volume in FX?
- Using Tick Volume in Forex: A Clear NVO Based Example
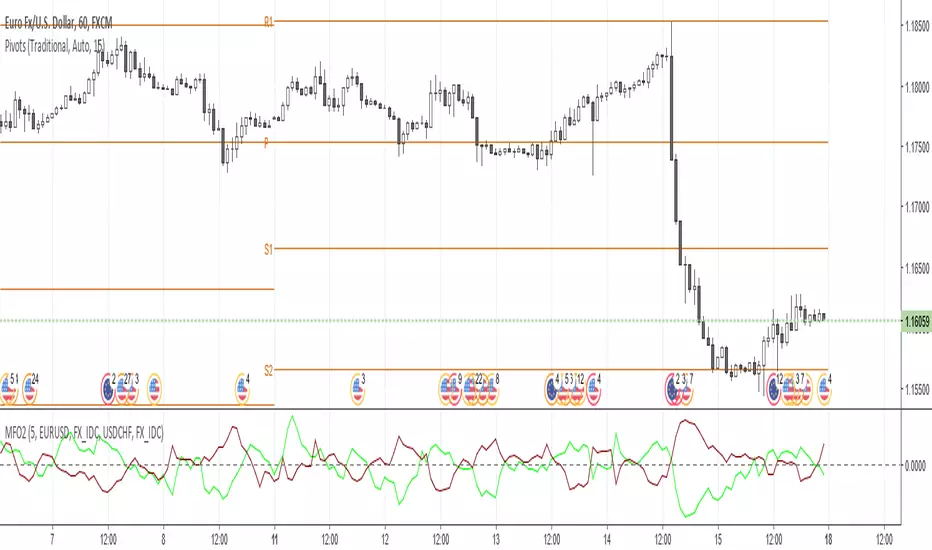
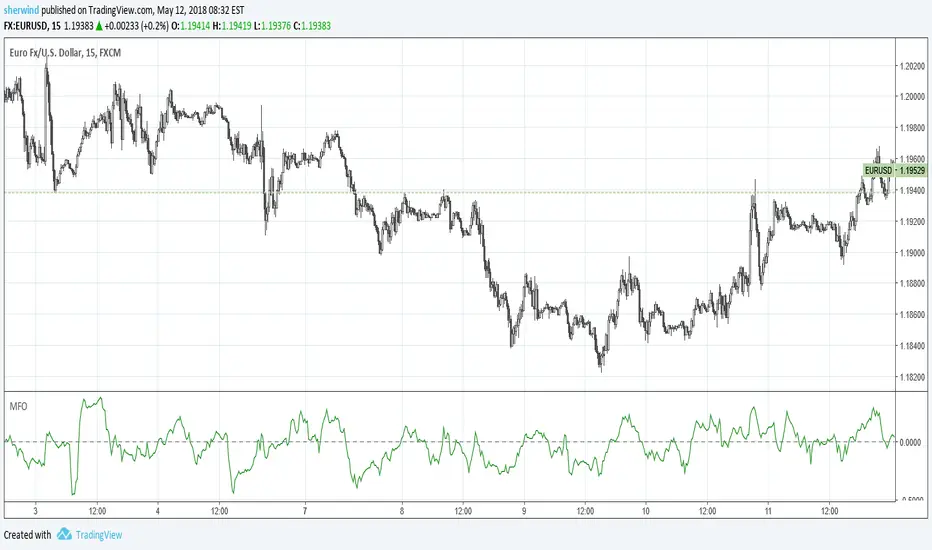
Money Flow OscillatorMeasures buying and selling pressure over a given lookback period.
As described at traders.com
See also:
- Are price updates a good proxy for actual traded volume in FX?
- Using Tick Volume in Forex: A Clear NVO Based Example
Mayer Multiple + Bollinger Bands: NVDAAs requested by Parabolic Trav, this is an experiment to adapt the Mayer Multiple to other assets displaying parabolic growth trends. It builds upon previous work by using Bollinger Band-style indicators based on the moving average of the multiple as indicator thresholds, rather than simply a value on the Y axis or an addition to the MA as I proposed here . This greatly increases the adaptability of the multiple to assets other than BTC.
As per the above chart, it does seem that the standard deviation lines can function as areas of support and resistance, as the multiple bounces off the lower 2SD in late 2008, and interacts with the upper 1SD multiple times through 2015-2017.
- Shlomo Klahr

VIX Term Roll OscillatorMy implementtion of VIX term roll Oscillator according to the articles below
seekingalpha.com
vixcontango.wordpress.com
Hope it helps!
Daniel
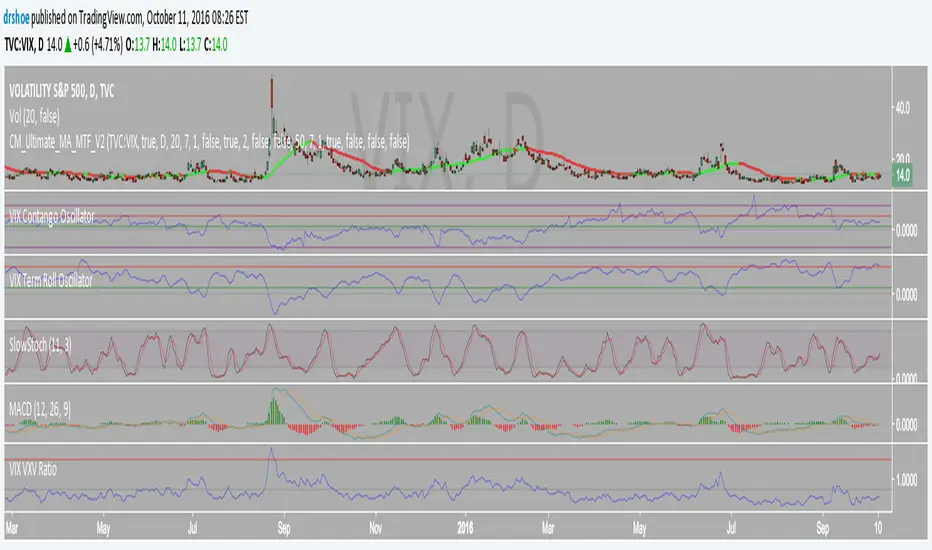
VIX Contango OscillatorVIX Contango Oscillator as outlined in the following blog post
vixcontango.wordpress.com
By Daniel Xu
